Voice Comparison Using Acoustic Analysis and Generative Adversarial Network for Forensics

Author: Kruthika S.G., Trisiladevi C Nagavi, P. Mahesha, Abhishek Kumar
Journal: International Journal of Image, Graphics and Signal Processing @ijigsp
Article in issue: 2 vol.17, 2025.
Free access
Forensic Voice Comparison (FVC) is a scientific analysis that examines audio recordings to determine whether they come from the same or different speakers in digital forensics. In this research work, the experiment utilizes three different techniques, like pre-processing, feature extraction, and classification. In preprocessing, the stationery noise reduction algorithm is used to remove unwanted background noise by increasing the clarity of the speech. This in turn helps to improve the overall audio quality by reducing distractions. Further, acoustic features like Mel Frequency Cepstral Coefficients (MFCC) are used to extract relevant and distinctive features from audio signals to characterize and analyze the unique vocal patterns of different individual. Later, the Generative Adversarial Network (GAN) is used to generate synthetic MFCC features and also for augmenting the data samples. Finally, the Logistic Regression (LR) is realized using UK framework for the classification of the model to predict whether the result is true or false. The results achieved in terms of accuracy are 62% considering 3899 samples and 85% when considering set of 985 samples for the Australian English datasets.
Generative Adversarial Network (GAN), Acoustic Features, Digital Forensics, Mel Frequency Cepstral Coefficients (MFCC), Logistic Regression (LR), Forensic Voice Comparison (FVC)
Short address: https://sciup.org/15019719
IDR: 15019719 | DOI: 10.5815/ijigsp.2025.02.07
Text of the scientific article Voice Comparison Using Acoustic Analysis and Generative Adversarial Network for Forensics
Digital forensics has gained a lot of importance in the investigation of crime and disputes involving digital evidences because of the advancement in digital technology. Speech forensics is the sub field of digital forensics which includes Forensic Voice comparison (FVC), Forensic Speaker Recognition (FSR)/Forensic Speaker Identification (FSI) and Forensic Audio Enhancement (FAE). The known speech samples are compared with the trace samples in FVC. The FSR, also referred as FSI is the process of determining the identity of a speaker based on the analysis of voice characteristics obtained from audio recordings collected at crime scenes or during investigations. The FAE involves the quality improvement, intelligibility and perceptibility of audio recorded in forensic investigation. Numerous FVC categories are typically used in forensic investigation to examine and compare speech samples from the suspect. Those categories are often automatic and semi-automatic methods. In automatic method, human intervention is not there, but in a semi-automatic method, which integrates computer algorithms with manual intervention by forensic experts to analyze and compare audio recordings.
The FVC is carried out using features like auditory, acoustic, linguistic, phonetic and spectrographic features. The auditory analysis refers to the process of evaluating and comparing audio recordings based on human perception to determine speaker identity. The physical characteristics of human speech production system are analyzed in acoustic features such as pitch, formants, shape, and size of the vocal tract, trachea, and vocal resonance. Further the linguistic feature considers phonetic and phonological aspects of speech such as the articulation, perception of the individual sounds, patterns and variations of different languages. The phonetic will also cover the linguistic features for the identification of the suspect. Lastly, the feature called spectrographic explains about the suspect voice sample that is visualized in the form of graphical representation of frequency map. A wide range of blended approaches among the previously described methodologies have been used by numerous researchers in FVC. For instance, they could be of the variants like acoustic-phonetic, acoustic-linguistic, acoustic-spectrographic, auditory-acoustic, auditory-phonetic, auditory-spectrographic, acoustic-phonetic-spectrographic, and auditory-acoustic-phonetic [1].
In FVC, a framework refers to a structured approach or set of guidelines followed while carrying out voice comparison analysis. It provides a consistent and rigorous way to evaluate and compare voice samples to determine whether or not they are most likely coming from the same individual. Some of the popularly used frameworks in FVC are likelihood ratio, posterior-probability, and UK framework. Since acoustic analysis is the most often used method in both single and combined FVC, the proposed work adopts the same methodology. Acoustic characteristics are crucial for speech analysis because they offer quantifiable, objective data on speech that is useful to identify or differentiate between various speakers. For instance, in the forensic scenario there is a possibility of noise in the speech sample. The length and tension of a person's vocal cords, which are specific to each individual, influence the fundamental frequency or pitch of their voice. Numerous surveys were carried out in the field of acoustic analysis to determine different feature extractors in the frequency domain, including Gammatone Frequency Cepstral Coefficients (GFCCs), Perceptual Linear Prediction (PLP), PLP-Relative Spectra (PLP-RASTA), Linear Predictive Coding (LPC), and Linear Predictive Cepstral Coefficients (LPCC). The MFCC is the finest feature extractor when it comes to feature identification because of its ability to capture, analyze distinct speech features that are robust and trustworthy for identifying persons based on their voice patterns. This capability is useful for speech, audio, and video analysis. Unique vocal patterns of various people are characterized and analyzed using the MFCC to extract pertinent and distinguishing features from audio signals. This process helps with the comparison and evaluation of the similarity of voice samples for forensic purposes. Acoustic properties are therefore essential to speech analysis and FVC [2-4].
Further, the Deep learning is an emerging popular approach for classification in FVC. The techniques used are Artificial Neural Networks (ANN) approach such as Convolution Neural Networks (CNN), Recurrent Neural Networks (RNN), Long Short- Term Memory (LSTM), and Generative Adversarial Networks (GAN). The ANN is a computational model for processing speech data that can recognize and synthesize speech, among other speech-related tasks, by learning intricate correlations and patterns in audio signals. Similarly, CNN uses convolution layers to identify the speakers from the audio recordings in FVC to extract the voice features. Further, RNNs are used in FVC for tasks like speaker recognition, voice analysis, and temporal pattern recognition within audio recordings, allowing for the modeling of dependencies over time. A recurrent neural network called LSTM is frequently employed in speech processing because it enables the model to grasp and store long-term dependencies in speech data, enabling tasks like voice recognition and synthesis. The GAN, on the other hand, offers a distinct and superior Artificial Intelligence (AI) approach for FVC due to its capacity to generate realistic and diverse audio samples, which facilitates improved voice pattern identification and analysis.
In order to train the model, other Machine Learning (ML) classification algorithms were identified including, K-Mean Nearest Neighbor (KNN), Naive Bayes (NB), Random Forest (RF), Support Vector Machine (SVM), and Logistic Regression (LR). Because of its ease of use, effectiveness in binary classification problems and interpretability of results and LR is used for FVC in these techniques. The final results are predicted to be true or false using the LR model through UK Framework for classification [5, 6]. The primary goal of the work is to increase accuracy for FVC by employing an acoustic feature with GAN and LR model through UK framework. The first objective is to preprocess the speech samples for background noise reduction using stationary noise reduction algorithm. As part of the second main objective, MFCC acoustic features are used to extract relevant and distinctive features. This is useful to assess the likelihood of a match between voice samples and trace for forensic purposes. In the third objective of generating fake or synthetic MFCC features, GAN is adopted. It facilitates for determining the strength of the evidence for FVC. The last objective is to predict the given samples are real or fake using LR model through UK framework.
The organization of the paper is as follows: Literature review is presented in Section 2. The Section 3 offers the data collection. The proposed architecture for FVC is discussed in Section 4. In continuation of this, Section 5 covers the results and discussion. The comparative analysis of the proposed approach is presented in Section 6. The research work conclusion is presented in Section 7.
2. Literature Review
Over the last decades, research on voice comparison for forensics has resulted in several interesting methodologies to determine the authenticity and integrity of the speech using various techniques [5-15]. Due to tremendous growth in digital technology, much attention is paid to voice comparison and it has gained importance in the field of forensics. Hence in this section, a literature review on voice comparison methods for forensics is discussed. Researchers have suggested a wide range of FVC methods, including acoustic, phonetic, spectrographic, auditory, and automatic methods, to extract information from voice recordings. Many frameworks like UK framework, identification/exclusion/inconclusive, and likelihood-ratio are also used. Specifically, acoustic characteristics and GAN for FVC classification are the key study areas in this research. The corresponding subsections provide a brief overview of FVC using acoustic characteristics and GAN.
-
A. Forensic Voice Comparison Approaches
In 2018, Morrison et al.,[4] offered a number of FVC techniques, including auditory, spectrographic, acoustic-phonetic, and automatic, to extract information from voice recordings. In the next works, many classification frameworks are used, including likelihood ratio, posterior probability, identification/exclusion/inconclusive, UK framework. Empirical validation of FVC systems, admissibility in court, and future of FVC is discussed in the paper. After evaluating the direct reporting of the calculated likelihood ratio value in the form of a similarity metric, the employment of human-supervised automatic procedures within the likelihood ratio framework is next tested for empirical assessment of system performance under casework situations. Additionally, the Batvox approach Enzinger E and Morrison GS in [2022] [1, 4], developed on FVC, at the Netherlands Forensic Institute produced the best results when the recordings of 105 speakers were utilized as reference material, and performance was enhanced by the introduction of imposters. As a potential variable in FVC, filled pauses (FPs) were investigated [1, 4].The bestperforming system combined dynamic measurements of all three formants with the extraction of features like vowel and nasal duration for "um," yielding results with an Equal Error Rate (EER) of 4.08% and a Cllr of 0.12 in the study of 60 young male speakers of standard southern British English. "Um" consistently outperformed "uh," and formant dynamic systems produced more valid results than those based on midpoints for "um," but midpoints outperformed dynamics for "uh."
The Bayesian technique and the likelihood ratio concept have both been demonstrated to be reliable and logically sound methodologies for evaluating and modeling forensic data in the forensic sciences, according to Phil Rose [7, 8]. The method created in this paper is known as Forensic Semi-Automatic Speaker Recognition (FSASR), and it combines a phonetically based FVC with Bayesian inference.
Later, the author Phil Rose et al.[2001][7, 8], proposed a pilot forensic-phonetic experiment. Extracted features and comparison of formant and cepstrally based analyses on intonationally varying tokens of the word "hello" spoken by similar-sounding speakers. Use of a novel band selective cepstral analysis to evaluate discrimination performance by considering 23 speaker’s sample is discussed. The similarity matrix of cepstrum-based analysis outperforms formant analysis by 5% for discriminating same-speaker recordings at the second diphthongal target in "hello". Cepstrum-based analysis shows good discrimination performance at other landmarks in "hello" not demonstrated in this paper. Need to calculate likelihood ratios for cepstral analysis within the appropriate Bayesian approach for forensic science. Further research on discrimination performance of formant and cepstrum analyses for same-speaker and different-speaker recordings is provided. Cepstrum-based analysis shows better discrimination performance than formant analysis for forensically realistic speech in a restricted task. Importance of continued research and development in digital forensic analysis of speech for forensic investigations [7, 8]. Some of the researchers have also conducted experiments by utilizing acoustic features after examining FVC methodologies.
-
B. Acoustic Features
Damanpreet Kaur 2021 et al.[8], proposed acoustic analysis and speaker identification. This study describes about rise in digital crimes, importance of digital evidence preservation, use of audio and video recordings in forensic investigations, use of advanced tools such as MultiSpeech and PRAAT for analysis that is used for analyzing speech patterns of individuals with Parkinson's disease. The work also used to analyze voice signals and recognize various accents used in linguistic, phonetic, and auditory features. It also involved disguising of voices by criminals using advanced digital signals. It was found that there is need for more compatible tools for deciphering original voice and research is ongoing for the development of more advanced tools to signify the importance of digital forensic analysis in criminal investigations. The author concluded that the need of advanced tools with accurate and reliable analysis is a much-needed parameter and obviously there is a need for continued research and development of more advanced tools [8].
Further, Mahesh K. Singh et al., in 2018[9, 10] proposed an algorithm for identifying electronically disguised voice through acoustic analysis. Acoustic features computed using the Mel-frequency cepstral coefficients (MFCC) methods are compared between normal voice and electronically disguised voice by different semitones. The featurebased classifier is used for speaker identification with Support Vector Machine (SVM) and Decision Tree (DT)
classifiers. The speaker identification rate of the feature-based classifier is 93.51% and 78.51% efficient for normal voice and electronically disguised voice, respectively. The mean value of disguised voice for speaker 6 is close to that of normal voice. The DT classifier performs better than the SVM classifier for identifying both normal and electronically disguised voices. The acoustic features reveal differences between normal and electronically disguised voices. The proposed algorithm achieved a speaker identification rate closer to 100% with further improvements. The DT classifier is more efficient than the SVM classifier for identifying normal and electronically disguised voices [9, 10].
C. Generative Adversarial Network
In 2021 Qian Wang et al.[11], proposed work using adversarial attacks using neural networks for Automatic Speech Recognition (ASR). It is difficult to design practical adversarial cases against ASR systems since this assumption is false in practice. Selective Gradient Estimation Assault (SGEA), a brand-new and successful assault on ASR systems, is described in this work. The SGEA achieves great efficiency and success rates with only limited access to neural network output probabilities. In the experiments, the Deep Speech system on the Mozilla Common Voice and LibriSpeech datasets was assaulted. The SGEA decreases the amount of queries by 66% while increasing the attack success rate from 35% to 98%. To cut down on the amount of queries, coordinate selection approach and mini-batch gradient estimation were introduced. With an average of 78,400 queries against the Deep Speech system on the Mozilla Common Voice dataset and LibriSpeech dataset, the suggested attack had a 98% success rate. The proposed attack improved the success rate by 63% over the state-of-the-arts while decreasing the number of inquiries by 66%. The suggested assault has success rates of 73% on five-word target texts, compared to far lower success rates for even two-word targets for existing methods [11].
3. Data Collection
Later, the Xiaowen Li et al. 2019 [6], presents an antiforensic method against Audio Source Identification (ASI) and GAN techniques using a data-driven approach. The work demonstrates the effectiveness of the proposed method in confusing existing ASI detectors and controlling their conclusions. Rigorous experiments are carried outto evaluate the proposed method against three state-of-art ASI methods. Confusing attack significantly reduces detection accuracies from 97% to less than 5%. Misleading attack achieves a misleading rate of about 81.32% while ensuring high perceptual quality.
Table 1. Literature review on acoustic features and generative adversarial network
|
Citation |
Dataset |
Method |
Results |
|
Enzinger E and Morrison GS [1] |
Standard southern British English |
Batvox, Imposters improved performance, Filled Pauses (FPs) |
EER= 4.08% and Cllr of 0.12. |
|
Phil Rose, et al. [2001][7] |
Australian English for 23 speakers |
LR, i-vector, UBM, PLDA |
Accuracy = 69% |
|
Bhanudas K. Dethe,et al.[2016][5] |
Multispeech |
Critical Listening, Segregation, Noise reduction, Spectrographic |
Accuracy=94.2% |
|
Mahesh K. Singh [2018][9] |
Normal and electronically distinguished voice sample |
MFCC, SVM, DT |
Accuracy=78% |
|
Xiaowen Li et al. [2019][6] |
TIMIT-RD Live record |
GAN |
Accuracy=81.32% |
|
Damanpreet Kaur, et al. [2021][8] |
Multi-Speech |
PRAAT, MATLAB |
Ongoing research for development of more advanced tools |
|
Sonal Joshi et al. [2021][13] |
Vox-Celeb2 data RIR dataset |
Speaker identification, Speaker Verification, Baseline, Adversarial attacks. |
Accuracy=93% |
|
Qian Wang et al. [2021][11] |
Mozilla Common Voice dataset, Libri Speech |
Batch Size Adaptation, Selective Gradient Estimation Attacks, Whitebox |
Accuracy=73% |
The Sonal Joshi et al., in 2022 [12,13] proposed and explanation makes a similar claim. Adversarial instances can trick Speaker Recognition (SR) algorithms by contaminating voice signals with undetectable noise. Modern x-vector based SR systems' susceptibility to white-box adversarial attacks has to be researched. It is necessary to suggest counter-measures to defend the SR systems from these assaults. Evaluation of x-Vector based SR systems against Fast Gradient Sign Method (FGSM), Basic Iterative Method (BIM),Projected Gradient Descent (PGD), and Carlini-Wagner (CW) assault white-box adversarial attacksis required. Attacks like BIM, PGD, and CW demonstrates how vulnerable SR systems are. The initial line of defence against these assaults is adversarial training. To counteract these threats, four pre-processing defenseslikerandomized smoothing, DefenseGAN, Variational Autoencoder (VAE), and Parallel WaveGAN vocoder (PWG) are researched. The most effective defence against the attacks is PWG paired with randomised smoothing, which has an average accuracy of 93% as opposed to 52% in the undefended system. Only marginalof about 4.8% absolute in the worst scenario are benign accuracies reduced by the proposed pre-processing defences. It is investigated abouthow resistant various x-vector SR systems are against black-box and adaptive whitebox adversarial attacks. In order to strengthen the adversarial robustness, four pre-processing defences are examined. The pre-processing defences that have been suggested have shown promise in defending x-vector based SR systems from white-box adversarial attacks. Countermeasures must be developed further to defend SR systems from adversarial black-box and adaptive white-box attacks [12, 13].
The literature review indicates that the speech is the significant challenge in the field of digital forensics. The analysis is done using semi-automatic and automatic voice comparison methods. The Table 1 provides the consolidated review for the acoustic features and GAN [5-15] for various research works. After a thorough review of the literature, we discovered that there aren't enough studies utilizing these novel combinations of approaches. Hence, the current research work proposes the FVC approach using MFCC, GAN and, UK framework based LR approach.
The MFCC has ability to produces realistic features and it enhances voice pattern identification. Further, the GAN presents a unique and superior AI based approach using synthetic sample generation. The UK framework with LR model assists in identifying real and fake samples effectively.
The benchmark speech data samples and traces are collected from the University of New South Wales Faculty of Electrical Engineering and Telecommunications in Sydney, Australia. It is referred as Australian English dataset [16, 17]. For proposed experiments, an Australian English database is selected to ensure precise analysis of speech patterns specific to Australian English speakers. Variations in accents, pronunciation, and linguistic features across different English dialects necessitate the use of an Australian English dataset to accurately capture these distinct characteristics. This approach enhances the reliability and relevance of results, particularly in forensic contexts where voice comparisons involve Australian speakers. Access to the dataset was granted following approval from the appropriate authorities. The datasets utilized in this FVC experiment were sourced from the Forensic Voice Comparison Data Repository, available at The obtained data is in the form of Free Lossless Audio Codec (.flac) file formats. The datasets consists of 3899 recordings of speech samples [18]. The details of dataset and number of samples are tabulated in Table 2.
Table 2. Summary of datasets.
|
Dataset Name |
Number of Sample |
Gender |
Audio Format |
|
Australian English |
3899 |
Female & Male |
“.flac” |
4. Proposed Architecture for Forensic Voice Comparison
The proposed FVC architecture has training and testing phase steps, it’s represented in Fig.1. The preprocessing, MFCC feature extraction and GAN module are used during training phase. Forensic speech samples are fed as input. Then stationary noise reduction algorithm is used for preprocessing. This algorithm helps to remove background noise and improves the overall audio quality by reducing distractions. Further, pertinent and unique acoustic features in the form of MFCC are extracted. The output is in the form of .CSV file containing the fields such as speaker ID, gender, recording styles (casual conversation, telephone tasks, police-style interview), and file names. They also include the duration of each recording in seconds as numerical values.
After feature extraction, GAN model which is a popular generative AI approach for synthetic sample generation and augmentation is used. The generator generates the synthetic features and augments the same. These sub phases explained so far are part of training phase. Similarly, in the testing phase, preprocessing and MFCC feature extraction sub phases are carried out. Further, in order to discriminate the real and fake samples, the LR classifier along with UK framework is adopted. The following subsections provide a detailed discussion of the phases, including preprocessing, MFCC feature extraction, and GAN.
-
A. Pre-Processing
Initially the forensic speech samples are prepared for experiment by removing background noise. The empirical stationary noise reduction algorithm is used for the same. The algorithm is provided as follows.
The algorithm takes a forensic speech sample in .flac format: a noise clip that contains the typical noise. A signal clip with the signal and the noise that should be eliminated is depicted in Fig.2. The plots of the spectrum, and the noisy speech that was recorded are shown in Fig.2. The noise level is considerable and broad, as we can see in the noisy spectrum. The spectrum of enhanced speech is displayed in Fig.3. The clean speech is clearly distinguishable, and the spectrum shows that the noise components have been completely removed.
Algorithm 1: Algorithm for Stationary Noise Reduction
Inputs: Original forensic noisy speech samples.
Output: Enhanced forensic speech samples.
-
1: Over the noisy audio clip, a spectrogram is calculated.
-
2: Statistics are computed across the noise spectrogram (in frequency).
-
3: Based on the noise statistics (and the desired algorithmic sensitivity), a threshold is generated.
-
4: Over the signal, a spectrogram is calculated.
-
5: The signal spectrogram is compared to the threshold to determine the mask.
-
6: A linear filter is used to smooth the mask over frequency and time.
-
7: If the noise signal is not there, the mask is applied to the spectrogram of the signal and is inverted.
-
8: The algorithm will consider the signal as the noise clip, which typically yields good results.
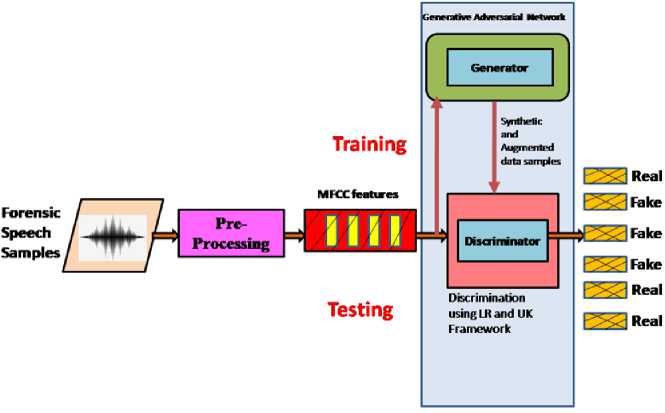
Fig. 1. Architecture for forensic voice comparison using MFCC, GAN and LR.
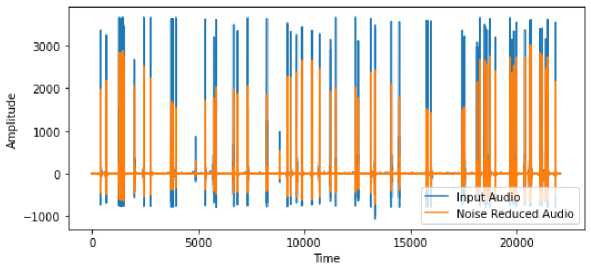
Fig. 2. Noisy speech and its spectrum.
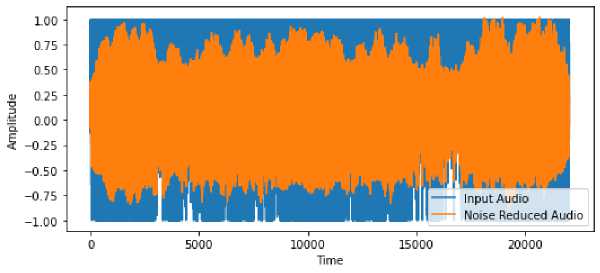
Fig. 3. Enhanced speech and its spectrum.
-
B. Mel-Frequency Cepstral Coefficient Features
Feature extraction plays a critical role in many ML applications, including speech processing and analysis. After the preprocessing, the features of the speech sample are extracted. In this study, MFCC features are preferred due to their promise in terms of discrimination and robustness. In the context of speech, extracting relevant features is essential for capturing the distinctive characteristics of speech signals and enabling effective classification and recognition tasks.
This section provides an overview of the MFCC method, explaining their underlying principles and mathematical foundations. It discusses the steps involved in the feature extraction process, including pre-emphasis, framing, windowing, Fourier analysis, Discrete Cosine Transformation (DCT), Filter bank analysis, and Energy approximation for MFCC computation.
Low-frequency audio signal components constitute the majority of the information used in MFCC, with high-frequency audio signal components receiving less attention. Producing the best approximation features that match the speaker's unique characteristics is the aim of MFCC. Additionally, the short-time spectrum analysis on which MFCC is based is used to compute the MFCC vectors. The Fig.4 depicts the block diagram of MFCC process.
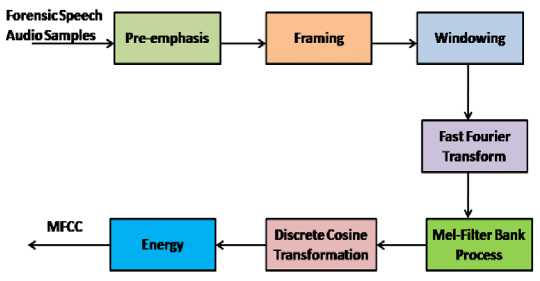
Fig. 4. Block diagram of MFCC Process.
As shown in Fig.4. MFCC consists of seven computational steps. Each step has its significance and mathematical approach as discussed below:
Step 1: Pre-emphasis is a technique used to boost a signal's energy at higher frequencies relative to its energy at lower frequencies in order to increase the overall signal to noise ratio in succeeding components of the system.
Step 2: The pre-emphasized signal is split up into frames during framing so that each frame may be swiftly analyzed instead of the complete signal at once. The typical frame length is 10 to 30 msec, and the majority of the audio stream remains stationary during this time. The frames are also overlapping as a result of windowing, which takes away some of the data from the start and end of each frame. The information is returned to the extracted features through overlapping.
Step 3: To reduce spectral distortion and signal discontinuities, the Hamming window is used. Windowing is the multiplication of the framed signal and the window function at each point. Furthermore, the Hamming window procedure is concisely represented in equation as following Eq.(1):
w [n] = 0.54 - 0.46 ∗ соѕ(2πn/N) (1)
Where w[n] is the number of samples in each frame of the Hamming window and n is the sample index.
The window signal equation is represented as follows in Eq. (2):
Y (n) = X(n) x W(n) (2)
Here, the variables n, W (n), X(n), Y(n) are samples in each frame, Hamming window, input signal and output signal respectively.
Step 4: The windowed signal is then run through a Fast Fourier Transform (FFT) to produce the signal's magnitude spectrum. The FFT transforms a signal from the time domain to the frequency domain.
The equation is given by in (3):
Y (W) = FFT [h (t) ∗ X (t)] = H (w) ∗ X(w) (3)
If X (w), H (w) and Y (W) are the Fourier Transform of X (t), h (t) and Y (t) respectively.
Step 5: The Mel-frequency scale is a perceptually meaningful and non-linear scale is used to represent the frequency range of human speech. It's achieved through a series of Mel-frequency filters, which are designed to replicate the way the human auditory system perceives sound. The Mel-frequency scale is defined by the following Eq. (4):
M (f) = 2595 ∗ lоg 10 (1 + f/700)
Where, f is the frequency in Hz and M (f) is the Mel-frequency.
The Mel-frequency filter bank is a collection of triangle filters that overlap and are positioned along the scale of Mel frequencies. Usually, the filter bank consists of 20–40 filters. The outputs of the filter bank are provided by the Eq. (5):
H_m [k] = ∑_{i = 0}^{N/2 - 1} |X[k]|^2 ∗ H_m (i)
-
• H_m(i) is the i-th point of the m-th Mel filter, and H_m[k] is the output of the m-th filter at frequency index k.
-
• X[k] is the magnitude spectrum of the signal at frequency index k.
-
• N is the length of the FFT.
The dynamic range of the filter output is then compressed by converting the filter-bank's outputs to decibels, represented in Eq. (6):
S_m = 10 ∗ lоg 10 (H_m) (6)
Further the bandwidth is determined by a constant Mel-frequency interval as shown in Fig.5.
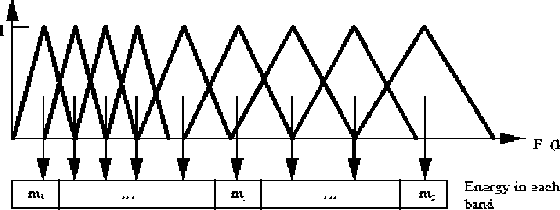
Fig. 5. Mel Scale Filter Bank [19].
Step 6: The log Mel-frequency filter bank is converted to time domain using DCT. The acoustic vector referred as MFCC is the outcome of the conversion.
Step 7: In the audio speech sample and the frames, a formant's slope during its transitions get vary. Therefore, it is necessary to include features that are associated with the evolution of cepstral properties. The above Fig. 5 represents the energy in a frame for a signal x in a window from time sample t1 to time sample t2 represented in Eq. (7):
Energy = Ʃ x2 [t] (7)
Finally, 13 MFCC features were obtained for every frame of single forensic speech audio sample. These were employed to describe and examine each person's distinct vocal pattern.
-
C. Modelling Using Generative Adversarial Network
As shown in Fig.1, the GAN consists of two neural networks, a generator and a discriminator. The GAN is primarily known for generating realistic and high-quality synthetic data. Here, the generator neural network generates the synthetic MFCC features. Thereby it augments the feature set. The process of generation is based on the learning of underlying distribution of the training data. Hence, the generated samples have resemblance to the real MFCC samples. Similarly, the discriminator neural network receives both training and testing MFCC features to distinguish the speech samples as real or fake.
The error function indicates the loss incurred during GAN generation and discrimination process. It is plotted across number of epochs used. The generator and discriminator error functions are shown in Fig.6 and Fig.7 respectively. When generating the synthetic features, the GAN performs the function using a minimum and maximum area approach. It is represented with a notation V. The generator aims minimize and discriminator aims to maximize the area. The below Eq. (8) represents GAN:
minGmaxD [Ex ~ pdata(x)[lоgD(x)] + Ez ~ pz(z)[1 - lоgD(G(z))]]
Where,
-
• G = generator
-
• D = discriminator
-
• P data (x) = real data discriminator
-
• P(z) = generator data discrimination
-
• x = samples from P data (x)
-
• z = sample from P (z)
-
• D (x) = network of discriminator
-
• G (z) = network of generator
Fig. 6. Generator error function.
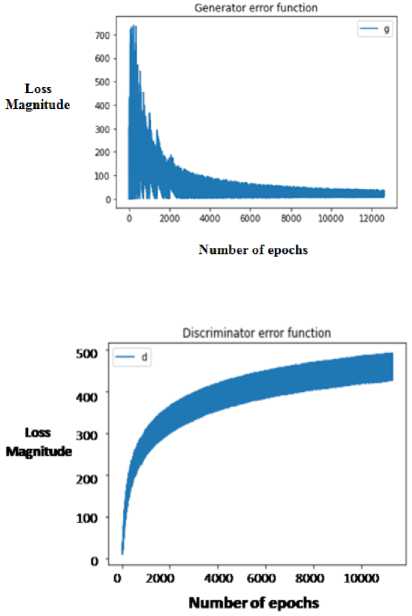
Fig. 7. Discriminator error function.
Further, in order to establish the chance that the synthetic data and real data belong to the same speaker, the classification seeks to compare and contrast them by using LR model through UK framework. The LR model calculates the probability that the sample it got originated from the training data as opposed to the generator during the training phase.
Overall, the application of LR classification method in FVC provides unique values in analyzing and identifying speaker features. This method offers its own strengths and considerations. The LR models the relationship between the input features and the likelihood that an outcome would belong to a specific class. It evaluates the probability using the logistic function, commonly known as the sigmoid function.
LR is a versatile algorithm that handles both linear and nonlinear relationships between the input features and the outcome. It is widely used in various domains, including forensics, for binary classification tasks where interpreting the predicted probabilities is valuable. Finally, the performance analysis of the discriminator using LR and UK framework is portrayed using confusion matrix and its extended evaluations metrics such as accuracy, precision, recall, F1 score and F2 score.
Let us consider a binary classification problem based on the FVC with two classes, 0 (fake) and 1 (real). Logistic regression aims to estimate the probability of the outcome belonging to class 1 given the input features.
The logistic function, represented by σ(z), is defined as Eq. (9):
a (z) = 1 / (1 + e^(-z)) (9)
Where z is the linear combination of the input features and their corresponding weights are shown in Eq.(10):
z = во + в1Х1 + в2Х2 + ... + в Z x [z] (10)
Here, 00,31,02, ..., в 0 are the cepstral coefficients or weights associated with each feature, and Xi, x2, ..., x 0 represent the input feature values. To make predictions using LR, a decision threshold is often applied. If the predicted probability σ (z) is greater than or equal to the decision threshold is 0.5, the predicted class is 1 otherwise, and it is 0. To exploit the advantages of MFCC, GAN, and LR though UK framework, the combined approach is proposed in this research work. The UK framework for FVC involves rigorous validation and standardization. It provides an approach for determining the Likelihood Ratio (LR) from the acoustic evaluation of distinctive voice attribute scores.
5. Results and Discussion
Two experimental modes were adopted for analyzing the performance of the proposed model. In the first mode of experimentation, 10% of 3899 (that is 389) data samples are used. From those 389 samples, for each speech file 22 sub samples of speech are created. So, the experiment uses 8558 total samples. Among those samples 70% is 5990 for training and 30% that is 2567 are used for testing. Similarly, in the second mode of experimentation, 10% of 985 that is 98 amounts of data samples were used. From those 98 samples, for each speech file 22 sub samples of speech are created. So, the experiment uses 2156 total samples. Among those samples 70% is 1509 for training and 30% that is 646 are used for testing. The parameter such as number of epochs, random state, is varied for both experiments uniformly. The variation for number of epoch is 1000-5000. The random state is set to 42.
Table 3.Summary of the performance of the proposed approach.
|
Dataset Name |
Performance Metrics |
Results in % for Experiment Mode 1 |
Results in % for Experiment Mode 2 |
|
Australian English |
Accuracy |
62% |
85% |
|
Precision |
57% |
82% |
|
|
Recall |
54% |
82% |
|
|
F1 Score |
52% |
81% |
|
|
F2 Score |
50% |
80% |
The performance of the proposed approach is represented using confusion matrix and its extended parameters such as Accuracy, Precision, Recall, F1 and F2 scores. The values for all the parameters are tabulated in Table.3 and pictorially represented in Fig.8.
The Table 3 illustrates the performance metrics for both mode1 and mode2 experiments. In mode1, the accuracy achieved is 62%, with a precision of 57%, a recall of 54%, a F1 score of 52%, and a F2 score of 50%. Conversely, mode 2 experiments yielded significantly higher results, with an Accuracy of 85%, a Precision of 82%, a Recall of 82%, a F1 score of 81%, and a F2 score of 80%. Similarly, Fig.8 provides a visual representation of the performance analysis for both experiment modes, showcasing the differences in results between mode1 and mode 2. The system in mode 2 experiments provided better results in comparison with mode1. It is due to the less number of samples. The system captures and remembers unique pattern easily in mode 2.
Mode 2 Experimentation Results
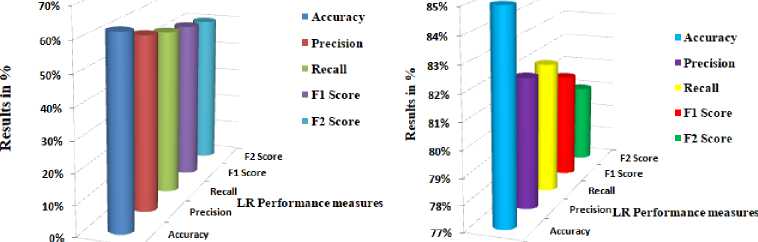
Fig. 8. Pictorial representation of performance analysis.
Mode 1 Experimentation Results
-
A. ROC and AUC Analysis
Furthermore, the performance of classification model is demonstrated using the Receiver Operating Characteristic (ROC) curve. Area under curve (AUC) of the ROC curve, a probability curve, indicates the degree of separability. A graphic depiction known as the ROC-AUC curve demonstrates the performance measures of categorization at various thresholds [12].
AUC values for the best models will be closer to 1, which shows that they have a high level of separability. AUC values close to 0 suggest a poor model, which has the lowest level of separability. If the AUC value is 0.5, the model does not have separability metric. In Fig.9a and Fig. 9b, the ROC-AUC curve is provided based on the performance values obtained from mode1 and mode2 experimentation. The blue color line indicates ROC-AUC curve and pink dotted line indicate average ROC-AUC. As discussed, earlier mode 2 experiment has yielding better results for all parameters.
The AUC is the area enclosed by the function f(x) with two vertical lines and one horizontal axis, and its values are obtained by evaluating the definite integral of the function with respect to vertical bounds. Eq.(11). shows that it measures the full two-dimensional region beneath the complete ROC curve.
AUC= ^f(x)dx = F(b)-F (a) (11)
The higher the ROC-Area better is the classifier performance in recognizing the person accurately. In the proposed approach, the ROC is progressing with higher values and it is approximately close to 1.
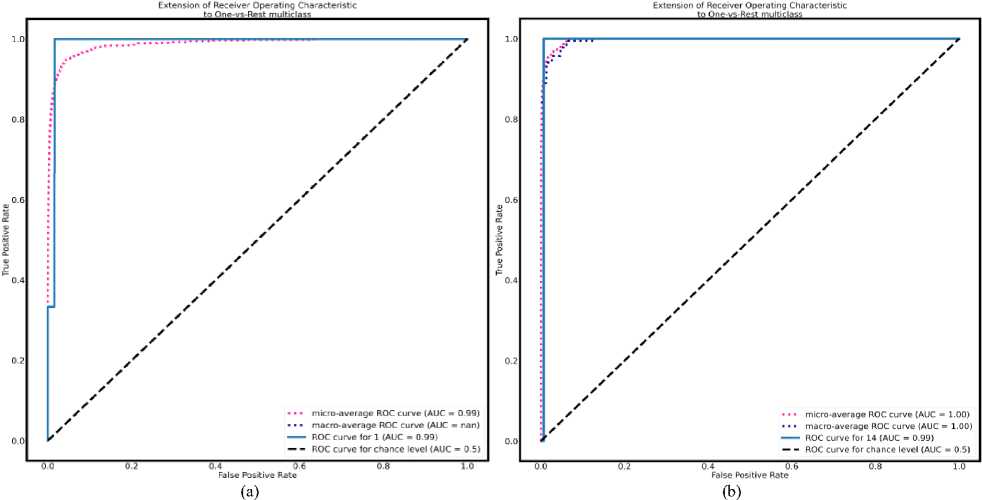
Fig. 9. a. ROC-AUC curve for mode 1. b. ROC-AUC curve for mode 2.
B. Comparative study
The performance of the proposed approach is compared with the significant existing works. The same is tabulated in Table 4. The existing works have adopted Mulitispeech [5], TIMIT-RD [6], and Libri-speech [11] datasets. The existing works by Mehmet Mehdi KARAKOC et al [2017] is 10%, by Phil Rose et al, [2001] [7] is 69%, and Hao Tan et al. [2022] [12] is 70% accuracy achieved respectively. By observation it is visible that the proposed approach provided better results in comparison with existing works.
6. Conclusion
Table 4 . Summary of comparative study
|
Author |
Database |
Method |
Results |
|
|
Mehmet Mehdi KARAKOC et al [2017] [15] |
Multispeech database |
Visual and Auditory, MFCC |
Accuracy=10% |
|
|
Enzinger E and Morrison GS [1] |
Standard southern British English |
Batvox, Imposters improved performance, Filled pauses (FPs) |
EER= 4.08% |
|
|
Phil Rose, et al. [2001] [7] |
Australian English for 23 speakers |
LR, UBM, PLDA |
Accuracy=69% for 23 speaker sample size |
|
|
Hao Tan et al. [2022] [12] |
TIMIT, NTIMIT, Aishell, VCTK, CSTR, YOHO VoxCeleb1& 2, LibriSpeech |
GAN |
Accuracy=70% |
|
|
Proposed Approach |
Mode 1 |
Australian English |
MFCC, GAN, LR, UK framework |
Accuracy=62% |
|
Mode 2 |
Australian English |
Accuracy=85% |
||
In order to facilitate FVC the new approach is proposed based on MFCC features, GAN, LR and UK framework. The performance of the proposed approach is better in comparison with existing works. Here, the research work has attempted to exploit the advantages of human acoustic characteristics, adversarial nature of GAN and prediction ability of the LR model. The proposed approach effectively characterizes and analyzes the unique vocal patterns of different individuals. In future the work can be extended for other acoustic features.
Acknowledgement
We would like to express our sincere gratitude to the Department of Science and Technology in New Delhi, India, for their assistance in sponsoring our research project through WISE Fellowship for Ph.D, Under File No. DST/WISE-PHD/ET/2023/4(G). Furthermore, we sincerely thank Rose P., Zhang C., and Geoffrey Stewart Morrison of the University of New South Wales (UNSW), Sydney, Australia's Forensic Voice Comparison Laboratory for allowing us to use their database for this research.
