Vologda residents’ notions of happiness

Author: Shabunova Aleksandra Anatolyevna, Morev Mikhail Vladimirovich
Journal: Economic and Social Changes: Facts, Trends, Forecast @volnc-esc-en
Section: Social development
Article in issue: 1 (25) т.6, 2013.
Free access
The article evaluates the level of happiness in the Vologda Oblast in comparison with the Russian Federation and the countries of the world. It studies the influence of internal sensation of happiness on the perception of socio-political processes and demographic situation. Furthermore, the article analyzes some of the factors affecting the level of happiness (financial situation, professional activities, interpersonal relations, socio-demographic characteristics).
Happiness index, social characteristics of population, quality of life
Short address: https://sciup.org/147223424
IDR: 147223424 | UDC: 316.658
Text of the scientific article Vologda residents’ notions of happiness
Sources: ISEDT RAS research; data base RPORC (.
According to Russian Public Opinion Research Center’s (RPORC) data, the ratio of “happy” Russians is more than 82% [4], while interpreting the results temporal characteristics of public opinion, such as seasonal factor impact (spring – autumn) on subjective selfconcept should be taken into account. All in all, it can be noted that the vast population majority in the Vologda Oblast and on average in the whole country experiences sensation of happiness.
However, 30% of region’s residents consider that there are more happy people among their acquaintances and relatives (in Russia – 33%), and 13% (24) of residents have the opposite opinion; at the same time 33% (36) of respondents are equally surrounded by happy and unhappy people. Though, a quarter of respondents are undecided, in the whole country the number of those people is considerably less.
Residents of large cities aged 18 – 24 (40%), highly educated people (45%) and representatives of 20% well-off people (30%) state that in their surrounding the number of happy people is prevailing. Country people (20%), people over 45 (16%), low-income residents of the region (24%) are inclined to consider their acquaintances as unhappy.
Defining the notion happiness for themselves, 27% of Vologda residents (in Russia – 28%) marked that it is “family and wellbeing”; 23% (in Russia – 17%) – “own health and health of relatives”; 12% - “children and grandchildren” (tab. 1) . In Russia the third position is taken by “material welfare” – 17%. Region’s residents make fewer associations with happiness regarding stable situation in the country, work, youth, and faith in God. It is noteworthy that almost half of respondents (49%) could not give an answer to that question.
The greater number of respondents (67%) could not answer, where the majority of happy people live. Pondering that question, most Vologda residents mentioned Russia (18%), the USA (12%) and European countries: Germany (7%), Switzerland (5%), France (5%), etc. Among Russian cities, Moscow (8%), St. Petersburg (5%) and Vologda (5%) are mainly named. Other respondents mention Paris (4%), New York (2%), Sochi, Los Angeles, and Venice (1%). Opinions of region’s residents considerably coincide with the data countrywide.
Among the reasons of “happiness” wellbeing in family (41%), communication pleasure with children and grandchildren (25%),
Table 1. What is “happiness” for you? (in % due to the number of respondents, who answered the question: “Are you happy or not?”
In-depth analysis allowed presenting sociodemographic characteristics of “happy” and “feeling less happy” residents of the region. Four blocks of figures were investigated: financial situation; labor activity; interpersonal relations; socio-demographic characteristics (sex, age, education level, place of residence, marital status).
Socio-economic situation
Last investigations in the sphere of income and emotional condition of population proved two regularities [3]:
-
1. Beyond the threshold in annual income equal to 10 000 U.S. dollars at parity of purchasing capacity, happiness is the function of non-material factors.
-
2. Beyond the threshold in income equal to 75 000 U.S. dollars per year full saturation with happiness and reverse process take place: growth in prosperity contributes to growth of unhappiness, stresses, sadness, and suicides.
On this basis, material welfare factor loses its significance due to average monthly income level over 28 thousand rubles. Taking into consideration that according to the data of 2011, average income level in the Vologda Oblast comprises 15 467 rubles [6, p. 85], it is worth speaking about the influence of material wealth on the happiness level of its residents.
The data of our investigation confirms these facts. Among happy people the share of those who refer to 20% of least well-off social groups is two times smaller than among those who consider themselves less happy (15 and 36% respectively; tab. 2 ). Moreover, identical feature is observed in all income groups: happy people have the level of actual income higher than those, who feel less positive.
It is noteworthy that in none of the groups the income level reaches that critical point, when the role of material factor in forming the feeling of happiness loses its importance (28 thousand rubles per month).
So, “happy” people identify themselves with “poor” and “beggar” groups more rarely in comparison with the rest population (33% against 76% respectively); more positively characterize their financial situation (10% against 5% respectively); less alarmed by economic problems; possess higher purchasing capacity of incomes (tab. 3) .
Labor activities
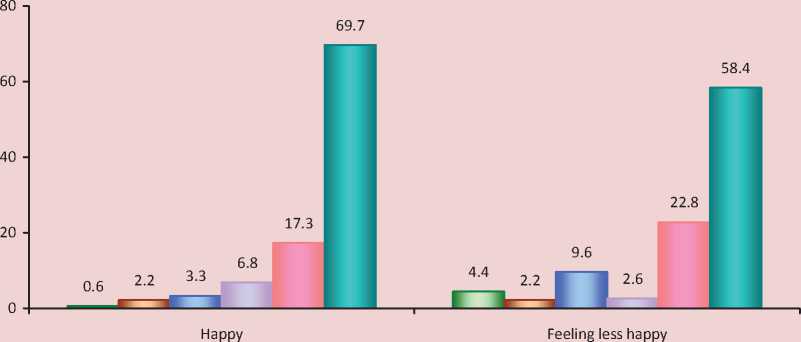
Among people feeling happy in comparison with the other part of population two categories of people are predominant: working-age employed (70% against 58%) and students/ pupils (7% against 3%; fig. 2 ). All the rest categories concerning the character of employment (excepting military men) are mostly represented among of those who do not feel themselves happy.
The reasons of such distribution of employment in groups of “happy” and “unhappy” are explained by their special characteristics. For instance, prevalence of “happy” among students and pupils can be explained by age
Table 2. Distribution regarding subjective feeling of happiness and income level in income groups
|
Decile groups |
Representation among population (in % due to number of responses to the question “Are you happy or not?”) |
Income level, rub. |
||
|
Happy |
Feeling less happy |
Happy |
Feeling less happy |
|
|
20% least well-off |
15.3 |
36.0 |
5042 |
3031 |
|
60% of middle class |
60.5 |
56.2 |
10 306 |
7211 |
|
20% most well-off |
24.2 |
7.9 |
22 596 |
14 510 |
Source: public opinion monitoring of ISEDT RAS.
Table 3. Subjective characteristic of financial situation (in % due to the number of respondents, who answered the question: “Are you happy or not?”)
|
Socio-economic aspects |
Happy |
Feeling less happy |
|
Social self-identity |
||
|
Rich |
0.8 |
0.4 |
|
Middle-class |
56.0 |
17.9 |
|
Poor, beggar |
33.3 |
76.3 |
|
Financial situation |
||
|
Good and very good |
9.5 |
5.1 |
|
Medium |
67.2 |
31.4 |
|
Bad and very bad |
16.9 |
55.1 |
|
Purchasing capacity of incomes |
||
|
Purchasing of various goods does not cause difficulties |
13.2 |
2.6 |
|
The amount of money is enough for buying necessary goods |
62.4 |
37.3 |
|
The amount of money is enough just for food |
24.4 |
60.1 |
|
Source: investigation of ISEDT RAS. |
||
Figure 2. Estimates distribution among “happy” and “feeling less happy” according to occupation (in % due to the number of respondents, who answered the question “Are you happy or no?”)
□ Disabled
□ Military man, public order maintenance agencies’ officer
□ Non-worker, unemployed (officially registered)
□ Student, pupil
■ Pensioner
□ Working-age employees
Source: research by ISEDT RAS.
peculiarities of this group’s representatives. The same factor influence the fact that among “unhappy” the ratio of pensioners is higher, because some of them feel psychological discomfort due to the abrupt stop of professional activities, loss of social contacts, realization of oncoming senility [7, p. 89]. Life dissatisfaction amidst the representatives of the senior age category depends on the stated above aspects, and also concerns about their worsening health, appearance, material supplies shortage, lack of physical and moral support, actual isolation [8].
The large number of disabled among “unhappy” is evidently explained by their health problems.
On the territory of the Vologda Oblast job satisfaction is the more significant factor of happiness than in the whole country. This is evident from the fact that among the region’s residents feeling unhappy, the share of those who are dissatisfied with their profession is considerably higher than national average share (62 and 46% respectively; fig. 3 – 4 ).
However, it should be noted that estimate of working conditions and social position that also mostly depend on the character of employment, in the group of “happy” people is higher than amidst the rest of population (tab. 4). The same can be said about the opportunities of spending free time and regular vacation that plays critical role as mechanism of relaxation and rise of body’s tolerance to physical and mental loads during carrying out professional duties. Therefore, the estimate of professional activities conditions in the group of people feeling happy is higher than among the rest population.
Interpersonal relations
There are a lot of investigations testifying that first of all feeling of happiness depends on quantitative and qualitative characteristics of individual’s social contacts, on his sociability and extravertivity [9, p. 6]. Happy people are luckier in relations with other people, whereas for “unhappy” social relations are often the sources of anxiety, annoyance, and contribute to appearance of such feelings as guilt and restraint.
Psychiatry Professor of the Harvard Medical School George Vaillant, director of studies that started even in 1938 and included tracking life cycle of 286 Harvard graduates, marked that warm and close relations were “the most important prologue to good life” [2].
Figure 3 – 4. The share of satisfied with their jobs among “happy” and “feeling less happy” (in % due to the number of respondents, who answered the question “Are you happy or no?”)
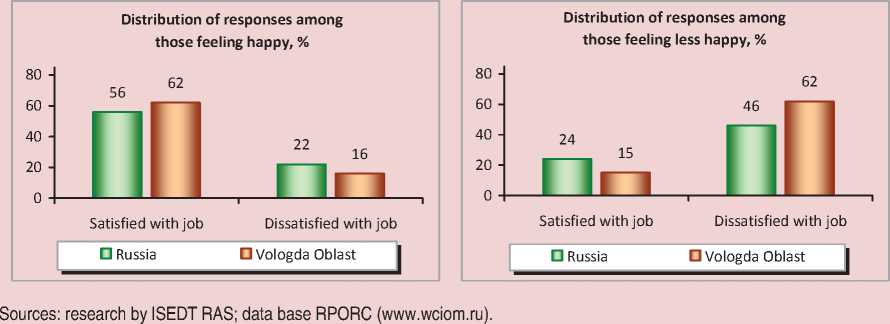
Table 4. Estimation of satisfaction with professional activities conditions (average scores)
|
Working conditions characteristics |
Happy |
Feeling less happy |
|
Labor and job conditions |
3.4 |
2.6 |
|
Social status |
3.5 |
2.8 |
|
Opportunities of spending free time |
3.6 |
2.8 |
|
Opportunities of spending vacation, holidays |
3.4 |
2.6 |
|
Source: research by ISEDT RAS. |
||
Table 5. Distribution of emotional states, caused by relations with relatives and close friends (in % due to the number of respondents, who answered the question “Are you happy or not?”)
Emotions caused by communicating with friends and relatives Happy Feeling less happy Russia Vologda Oblast Russia Vologda Oblast Happiness, satisfaction 92 85 71 41 Unhappiness, dissatisfaction, disappointment 1 6 15 28 Source: research by ISEDT RAS; data base RPORC (.
Judging by the results of our investigation, among “happy” residents of the Vologda Oblast the share of those, who have positive emotions communicating with friends and family members, is two times more than among people feeling less happy (85 and 41% respectively; tab. 5 ). Moreover, such data correlates with the estimates of population countrywide (92 and 71% respectively) [10].
The average value of satisfaction communicating with relatives and close friends among “happy” and “unhappy” residents of the region comprised 4.1 and 3.4 points respectively, satisfaction communicating with surrounding people all in all – 4 and 3.4 points. In addition, “happy” people – every second in the Vologda Oblast (53%) and the Russian Federation (47%) see the reason of their higher emotional state in relations with relatives and close friends3.
Socio-demographic characteristics
Analysis of socio-demographic characteristics showed that most of all the representatives of the following social groups consider themselves happy (tab. 6) :
-
1. People aged 30 – 55 years (44%). However, it is noteworthy that among the residents under 30 the share of those, who feel unhappy, is the lowest (19%) in comparison with the rest age categories.
-
2. Residents of the cities (55%). It can be explained by their higher social position and financial situation, broad opportunities of qualified employment assistance, leisure activities, and also more comfortable living conditions.
-
3. People with complete or incomplete higher education (41%). From our point of view, it is connected with circumstances that accompany higher education: higher social status and income level, quality of living conditions, profession’s prestige, and social environment’s culture level.
-
4. Cohabiting married couples (58%) having one child (25%). Such aspect gives evidence to significance of family relations concerning feeling of happiness formation; and also to the fact that the existence of children is one of the conditions to achieve psychological well-being.
Consequently, urban residents, people aged 30 – 55 years, married with children, people with higher education, work bringing satisfaction, and having income above average in the region consider themselves happier. According to the received data, social status considerably determines subjective feeling of happiness.
A happy person is more open to communication, to new sources of information, has more enthusiasm and creativity to his professional activities, more stable to physical and mental loads, etc. At the same time such a person more positively perceives socioeconomic reforms taking place in the country, estimates his/her future and prospects for country’s and society’s development with optimism.
Table 6. Socio-demographic characteristics of those feeling “happy” and “less happy” (in % of the number of respondents who answered the question “Are you happy or not?”)
|
Socio-demographic characteristics |
Happy |
Feeling less happy |
|
Sex |
||
|
Male |
43.3 |
45.6 |
|
Female |
56.7 |
54.4 |
|
Age |
||
|
Under 30 |
27.2 |
18.6 |
|
30 – 55 years |
44.1 |
48.9 |
|
Over 55 |
28.7 |
32.5 |
|
Territory |
||
|
Vologda |
25.1 |
24.8 |
|
Cherepovets |
29.7 |
15.7 |
|
Districts |
45.3 |
59.5 |
|
Education |
||
|
Secondary and incomplete secondary education |
27.2 |
47.6 |
|
Vocational secondary education |
32.1 |
30.9 |
|
Higher and incomplete higher education |
40.7 |
21.6 |
|
Marital status |
||
|
Married and cohabiting with husband/wife |
58.2 |
50.4 |
|
Married, but not cohabiting with husband/wife |
0.6 |
1.5 |
|
Not married, but cohabiting with a partner |
6.6 |
8.0 |
|
divorced |
6.7 |
12.0 |
|
Unmarried |
20.3 |
16.4 |
|
Widowed |
7.5 |
11.7 |
|
Number of children under 18 |
||
|
No children |
64.5 |
72.6 |
|
1 |
24.7 |
19.3 |
|
2 |
9.5 |
7.7 |
|
3 |
0.8 |
0.0 |
|
More than 3 children |
0.4 |
0.4 |
|
Source: research by ISEDT RAS. |
||
The results of investigation showed that people considering themselves happy in comparison with the rest population more positively estimate economic and political situation in the country (43% against 27% and 49% against 27% respectively). Amidst happy people the level of confidence to acting government authorities and social institutions is higher (tab. 7) .
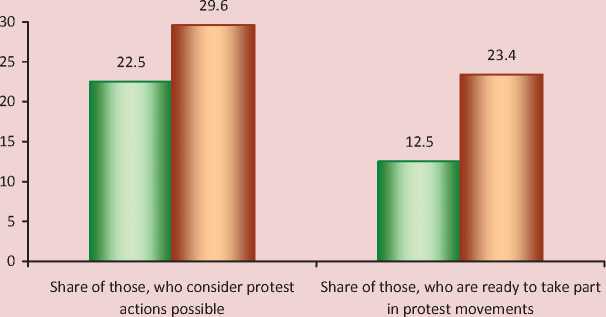
Happy people are not inclined to conflicts, more tolerant to ongoing events than those who are feeling less happy. The negative stock of patience among people feeling unhappy is 3 times more than happy people (36 and 11% respectively). The share of people who consider protest actions at the place of residence possible comprised among “happy” and “unhappy” 23
and 30% respectively (fig. 5) . However, every fourth person among “unhappy” people is ready to take part in protest actions (23%), at the same time among “happy” people the share of those is considerably smaller (13%).
The growing number of scientific data evidencing that happiness contributes to good health preservation is one of the economic reasons why politicians appeal to mental welfare of population. Understanding and taking into account the link between welfare and health presents the important aspect of the World Health Organization’s working process. In particular, it helps to work out a policy on health promotion of aging population, which is at risk of rising chronic disease incidence [2].
Table 7. Level of confidence to government authorities and social institutions (the share of trusting, in % due to the number of respondents, who answered the question “Are you happy or not?”)
|
Government authorities, social institutions |
Happy |
Feeling less happy |
|
President of the Russian Federation |
77.0 |
65.9 |
|
Government of the Russian Federation |
69.3 |
61.5 |
|
Federation Council |
63.8 |
55.5 |
|
State Duma of the Russian Federation |
58.2 |
52.8 |
|
Public chamber of the Russian Federation |
60.1 |
41.4 |
|
Vologda Oblast authorities |
66.2 |
42.0 |
|
Local government |
56.5 |
38.9 |
|
Public Chamber of the Vologda Oblast |
56.7 |
38.8 |
|
Police |
53.9 |
35.4 |
|
The Federal Security Service |
662 |
46.8 |
|
Court |
67.2 |
40.7 |
|
Public prosecution office |
64.1 |
36.9 |
|
Army |
59.7 |
43.3 |
|
Trade unions |
52.8 |
47.3 |
|
Church |
78.1 |
68.7 |
|
Public organizations |
55.4 |
44.7 |
|
Political parties and movements |
42.5 |
29.5 |
|
Mass media |
54.2 |
43.6 |
|
Directors and heads of enterprises |
52.5 |
32.4 |
|
Banking and business circles |
45.6 |
26.2 |
|
Source: research by ISEDT RAS. |
||
Figure 5. Protest moods level among happy and feeling less happy (in % due to the number of respondents, who answered the question “Are you happy or not?”)
□ Happy □ Feeling less happy
Source: investigation of ISEDT RAS.
According to the results of the survey (10 thousand people) conducted by the Institute of fiscal investigations relative to London University’s College, conclusions about dependence of happiness level on such serious factors of life expectancy as ischemic heart disease and disablement, were drawn [3]. If middle-aged people show life dissatisfaction, then the possibility of the fact that they will live long is very low. People who are fully satisfied with their lives, in comparison with others live 9 – 10 years longer. At the same time in the group of people dissatisfied with their lives, death comes 3 times oftener [11].
According to Ed Diener, Psychology Professor of the Illinois University (USA), who studied the phenomenon of happiness for 30 years, “there are many types of data, pointing at the fact that happiness leads to health and sustains life, of course, besides many other factors. Subjective welfare can sustain people’s lives in healthy population, whereas a happy life in comparison with an unhappy one can mean five additional years of life, although it depends on many things, as well as smoking issue” [2].
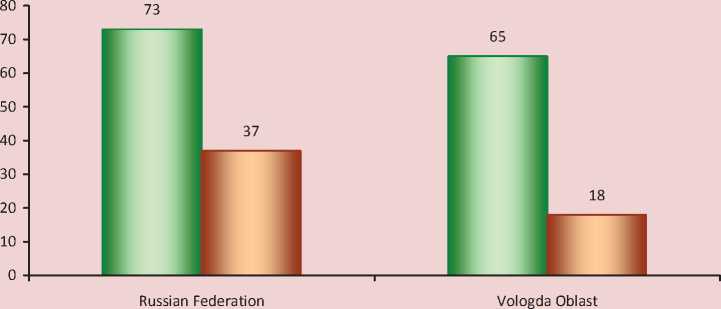
According to Russian Public Opinion Research Center’s data, among happy Russians 73% are satisfied with their health and health of their relatives and friends, among unhappy – 37% [10]. The same results were received during the research conducted by ISEDT RAS. Happy people are satisfied with their health more than the rest people (average estimate of health satisfaction is 3.4 and 2.5 points respectively); they mark that they are satisfied with health of their family, relatives and their own one 4 times oftener (65 and 18% respectively; fig. 6 ).
Happy people characterize different aspects of their personal life and the situation in the society more positively. Therefore, studying of happiness level and consequences determining it, has not only research, but practical character, because support level of political and economic line of policy followed by governmental authorities; character of psychological climate in society, the consequences of which can be such problems as high crime rate, alcoholism, drug addiction, suicidal behavior, etc.; the level of disease incidence and mortality, influencing life expectancy, and other figures of
Figure 6. The share of people satisfied with health of their family, relatives and their own one (in % due to the number of respondents, who answered the question “Are you happy or no?”)
□ Happy □ Feeling less happy
Sources: research by ISEDT RAS; data base RPORC (.
demographic situation depend on the share of positively-spirited people in the society.
As the investigation showed, more than half of the residents in the Vologda Oblast, as well as Russians all in all, consider themselves happy. Science has research data regarding interrelation between subjective well-being and such categories as income (material welfare level), employment, education, marriage and family, behavior and lifestyle, sex, biological factors, personal characteristics, and subjective satisfaction with some living conditions. However, none of the enumerated figures do not determine the whole level of subjective well-being, but contribute to it [12].
Judging by the results of the conducted investigation, subjective feeling of happiness is determined by the set of conditions: material welfare level, family relations character, satisfaction with professional occupation, etc.
All in all, such indicators characterize individual’s social status, determining his level of aspiration, achieving which reflects emotional well-being and subjective environmental perception. Hence, it is necessary to create conditions for vertical mobility and selfactualization of population for maintaining high happiness level in society.
The fact that the majority of residents both in the Vologda Oblast and the Russian Federation link their depressed mood mainly with socio-economic problems, provides evidence of necessity in taking steps for improvement life quality of people at large (primarily vulnerable social groups), and for the decrease of negative effects of those socio-economic determinants (first of all unemployment and wealth gap) that have negative impact on subjective person’s perception of his/ her own emotional state.
References Vologda residents’ notions of happiness
- Sorokin P.A. Human. Civilization. Society. Ed. by A.U. Sogomonov: translation from English. Moscow: Politizdat, 1992.
- Happiness effect. Bulletin of the World Health Organization, 2011. Available at: http://www.who.int/bulletin/volumes/89/4/11-020411/ru/
- Rodionov-Zrazhevsky A.G. Core factor of human potential. Eurasian international scientific-analytical edition “Problems of modern economics”. 2012. No. 2 (42). Available at: http://www.m-economy.ru/art.php?nArtId=4144
- Lein R. Loss of happiness in terms of market democracy, 2010. Site of Sevastopol city organization Party of Regions. Available at: http://sevreg.com.ua/2010/11/nasha-zhizn-uskoryaetsya-s-kazhdym-dnem.html
- Happiness is not in money: analytical materials. Research holding “Romir”. Available at: http://www.romir.ru/studies/305_1328212800/
- Statistical yearbook of the Vologda Oblast 2011: statistical abstract. Vologdastat. Vologda, 2012.
- Morev M.V., Shabunova A.A., Gulin K.A. Socio-economic and demographic aspects of suicidal behavior: monograph. Vologda: ISEDT RAS, 2010.
- Kagermazova L. Ts. Developmental psychology: electronic tutorial. International institute of group psychotherapy. Available at: http://www.group-analysis.ru/library/
- Argail M. Psychology of happiness. St. Petersburg, 2003.
- What is the reason of happiness?: Press-edition of RPORC. No. 2019. Available at: http://wciom.ru/index. php?id=459&uid=112766
- Life expectancy depends on the feeling of happiness: online-journal “Ecobyt”. Available at: http://www.ecobyt.ru/news/1513/
- Kostenko K.V. Subjective picture of life journey and life satisfaction in later years (on the material of living in the boarding schools): Ph.D. in pedagogical sciences thesis. Krasnodar, 2005. Available at: http://www.dissercat. com
- More money, less happiness: analytical materials. RPORC. Available at: http://wciom.ru/index. php?id=269&uid=13996
- Regions of Russia. Socio-economic figures: statistical abstract. Moscow, 2010.
