Voltage quality evaluation of distribution network based on probabilistic load flow

Author: Guowei Dong, Hengrui Ma
Journal: International Journal of Modern Education and Computer Science @ijmecs
Article in issue: 8 vol.10, 2018.
Free access
Voltage quality for residents of 10kV and below is affected by some factors: voltages of substation 10kV buses, power supply topologies, line types, and power supply distances of 10kV lines, reactive power compensation and loads of distribution transformers. As loads of distribution transformers vary randomly in space and time, voltages of distribution transformers fluctuate randomly as well as distribution network power flows, even network structures and parameters are invariable when voltages of 10kV buses. According to the definition of voltage eligibility rate, a random fluctuation model of distribution transformer loads was built through long term statistical analysis of distribution transformer loads on actual distribution network. By calculating the probabilistic load flows and considering correlation of random fluctuations, static voltages of distribution transformers were analyzed with probability method and power supply voltage eligibility rates of all 10kV lines could be calculated. The simulations show that the power supply voltage eligibility rates can be analyzed and evaluated more comprehensively by probabilistic load flow calculation, such a calculation provides the theoretical calculation basis for both reasonably controlling the bus voltages and improving the power supply voltage eligibility rates.
The load fluctuation, probabilistic load flow, monte-carlo simulation, The qualified rate of the voltage
Short address: https://sciup.org/15016789
IDR: 15016789 | DOI: 10.5815/ijmecs.2018.08.06
Text of the scientific article Voltage quality evaluation of distribution network based on probabilistic load flow
Published Online August 2018 in MECS DOI: 10.5815/ijmecs.2018.08.06
With the improvement of living standard, people have put forward increasingly strict requirements on the quality of power supply. At the same time, voltage quality, as an important assessment index of high-quality service for power supply enterprises, has been widely concerned by the whole society and severely supervised by government departments. Complaints about voltage quality have seriously impacted the reputation of the power supply companies.
The Voltage qualification rate is an important indicator to evaluate whether the voltage quality is qualified or not.
It is based on whether the average voltage in the minute is within the normal fluctuation range and has a statistical characteristic through long-time monitoring of the static voltage at the voltage monitoring point. When the structure of 10kv distribution line is definite, the low-side voltage of each distribution transformer will be affected by line load, both 10kv bus voltage and distribution transformer gear usually show random variations in time. Especially in the absence of on-load tap changer and long-term fixed gear of no-load tap changer at present, the random fluctuation of the load will cause the low-side voltage of the distribution transformer change randomly in case that the bus voltage is constant. The bigger probability that the voltage is within the normal fluctuation range, the higher qualified rate of the voltage is obtained. quality of the voltage is better accordingly, and vice versa. At present, a lot of literatures have studied the analysis and prediction [1-4] of power supply voltage quality and improvement measures, such as the optimal allocation and control of reactive power compensation, the reconfiguration of distribution network and so on, but most of them are based on the deterministic power flow calculation. It is the lack of a wide coverage and reliable monitoring method at present, it is difficult to accurately evaluate and analyze the quality of power supply voltage by deterministic calculation and analysis [1], thus, it makes valuable to propose voltage adjustment measures through quantitative analysis.
All input variables for probabilistic power flow calculation are random variables, such as load power, line fault and so on, which can comprehensively analyze the operating state of the system and evaluate the distribution characteristics of the node voltage and the line flow, and it therefore has been widely used in the system operation analysis and evaluation [5-10].
According to the statistical characteristics of the qualified rate of the power supply voltage, probability power flow calculation introduced in this paper is based on Monte-Carlo model which analyze and calculate the power supply voltage quality of overall distribution lines. Based on the historical time series data of active and reactive load collected from distribution transformers, the stochastic fluctuation rules and their correlations [11]
with each other are analyzed statistically. According to the stochastic model, digital characteristics and correlation of the load, a random sampling technique is adopted to generate multidimensional independent random samples, and then corresponding linear transformation is carried out on the random samples according to the digital statistical characteristics of the load of each node in order to finally obtain multidimensional random samples which have the same stochastic fluctuation rule as the actual load, it therefore is able to accurately and conveniently simulate the influence of the stochastic fluctuation of the actual load on the qualified probability distribution of the node voltage.
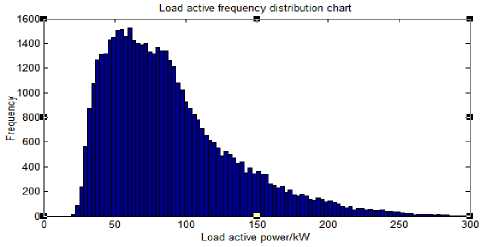
(a) Frequency distribution of active power
-
II. Stochastic Load Fluctuation Model
-
A. Analysis of Historical Load Power Data
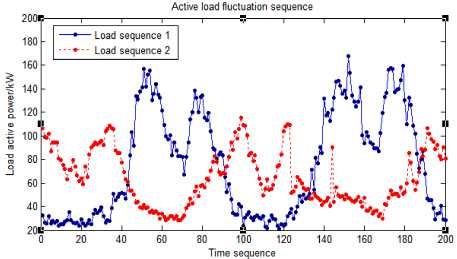
Through the statistical analysis of a large number of historical measured load data in the actual distribution network, the general fluctuation rule can be obtained. Figure 1 below shows the power fluctuation curves of active and reactive loads on the low voltage side of a distribution transformer.
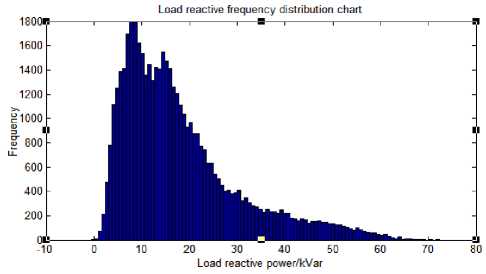
(b) Frequency distribution of reactive power
Fig.2. Frequency distribution of active power and reactive power
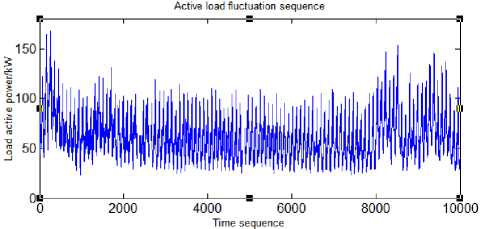
(a) Active power fluctuation sequence
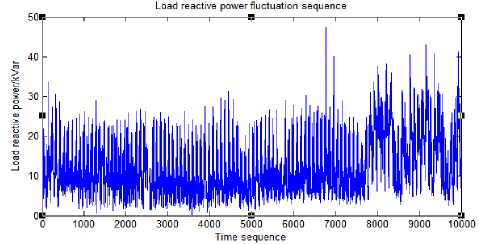
(b) Reactive power fluctuation sequence
Fig.1. Active power and Reactive power sequence
The frequency chart is used to analyse a large amount of historical data of the above load for a long time, and the approximate frequency distribution chart is shown in figure 2.
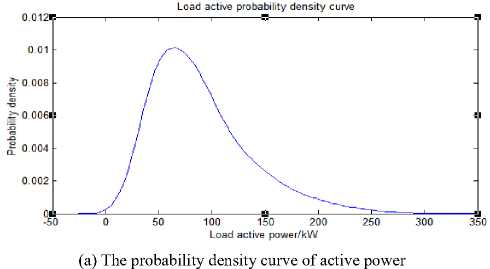
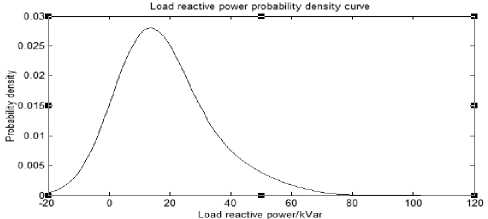
The shape of the outer profile will be closer to its probability density distribution function when the interval between frequency distribution maps becomes smaller. Thus, the probability fluctuation model of load power can be judged by the shape of the outer profile. Figure 3 shows the load active and reactive power probability density curves obtained through data fitting.
(b) The probability density curve of active power
Fig.3. The probability density curve of active power and reactive power
-
B. Analysis of Load Power Correlation of Each Node
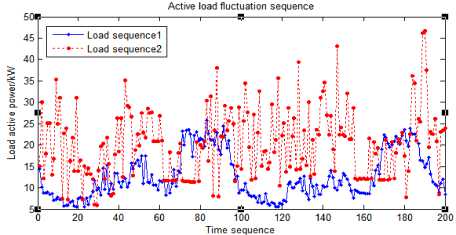
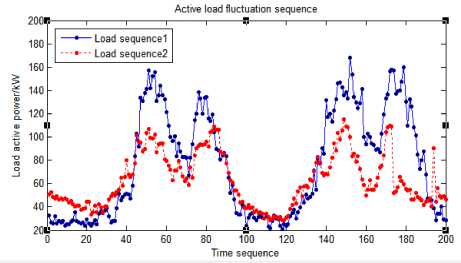
There is also a certain degree of correlation between them which will lead to a certain change in the fluctuation rule of line power flow and node voltage when the load of each node conforms a certain random fluctuation rule. Therefore, the correlation between node loads must be analyzed at the same time before the probability power flow is calculated, so as to evaluate the probability distribution of line power flow and node voltage accurately. Figure 4 shows the data curves of two groups of load active power sequence.
(a) Weak correlation
(b) Strong positive correlation
(c) Strong negative correlation
Fig.4. Active power and Reactive power sequence of different correlation
Figure 4 (a)-(c) indicate weak correlation, strong positive correlation and strong negative correlation between two node loads respectively.
-
III. Probabilistic Power Flow Calculation Model
There are two types of probabilistic power flow calculation in power system [12]. Monte-Carlo simulation method combined with random sampling is the most common mathematical method for analyzing probabilistic statistical problems [13-16]. Its calculation results are accurate and comprehensive, but the calculation is time consuming and the computation is more complexity. Besides, the calculation sample requires high requirements. In this paper, the probabilistic power flow is used to evaluate the voltage quality of each node of 10kv power supply line, the calculation speed is not required high. Therefore, Monte-Carlo simulation method is chosen to carry out analysis and calculation so as to obtain more accurate results.
-
A. Probabilistic Load Flow Model Based on MonteCarlo Simulation
The probabilistic load flow calculation model based on Monte-Carlo simulation is shown as below:
W = f ( X ) (1)
In the formula(1), x=[x1,x2,...,x n ] is the system state variable, including node voltage amplitude and phase angle .w=[w1,w2,...,wn] is the power injection volume of each node of the system, including the injected active power and reactive power of each node, and f is the system node power flow equations. When the load power of each node is a stochastic variable, that is, w is uncertain.
Suppose the probability distribution function of node i injecting power w i is:
Y i = F , ( w ) i = 1,2,- n (2)
Based on the probability distribution function of injection power of each node shown in formula (2),the injected power vectors of m row node satisfying this distribution are randomly generated on the computer, and the sample matrix of the system nodal injection power with a scale of m is obtained:
w 1 1 , w 1 2 , w 1 n
22 2
w1,w2,wn w1m ,w2m ,wnm
For the first row elements [w1l,w2l,..., wnl] of the node injection power sample matrix shown in formula (3), the corresponding system state vectors [x1l,x2l,..., xnl] are obtained by using the power flow calculation of formula
(1).Therefore, the corresponding system state matrix obtained by calculating the row vectors in the nodal injection power sample matrix is:
|
Г? P ... x 1, x 2, |
• xn |
|
|
22 X1 , x 2<- |
2 x n |
(4) |
|
m m . X i , x 2 , |
m x n _ |
The probability distribution curve and digital characteristics can be obtained by carrying out both digital statistics on each column of elements of the system state matrix and the branch power flow matrix. When the sample size m becomes bigger, the fitting accuracy will be higher, but the calculation amount becomes larger and the time consumed more accordingly at the same time.
-
B. Random Sample Simulation of Node Load Power
Historical data of the load power of each node can be acquired through the power consumption information acquisition system. However, the number of load samples of each node is not equal because the integrity of the collected data of each node load is inconsistent. The consistency of the load sample size of each node must be ensured at first when probabilistic load flow is used to evaluate and analyse the node voltage quality. Therefore, a random sampling method introduced in this paper takes into account the correlation of node load power to generate samples that satisfy the random variation law of actual load.
Through the analysis in section 2 of this article, it reveals that the actual active and reactive power of the distribution node load has random fluctuation. For the statistical analysis of a large number of historical data, the normal distribution can be used to approximately describe the probability distribution law of the load power. The general multidimensional normal distribution shown in formula (5) can be used to simulate [17]:
X ~ N ( ц , S ) (5)
In equation (5), X represents the random variable vector of all node loads. μ is the expectation vector of node load power. ∑ is the covariance matrix of node load power, its diagonal element is the self-variance of the corresponding node power and the non-diagonal element is the covariance of the corresponding two node power. The formula (5) is transformed as follows:
X = ц + LX (6)
Then the new multidimensional random variable X 1 will satisfy:
X ~ N ( ц + L ^ , L S L T ) (7)
Thus, after the statistical characteristic values ц and Z of the load power of all nodes is obtained through statistical analysis, as long as a standard normal distribution X~ N(0,I) of the corresponding dimension is generated, and then make Xx = ц + LX ,in which L is the result of Cholesky decomposition of Z ,namely Z =LLT. Then the multidimensional normal distribution taking into account the load power correlation can be obtained.
-
C. Load Power Sampling
It can be seen from section 3.2, for each distribution load with known load power correlation, m sample data with corresponding dimensions conforming the N (0, I) distribution are generated by random sampling at first and then the sample data is linearly transformed as described above according to the digital characteristics and correlation of each distribution load power, so as to obtain multidimensional random samples with known digital characteristics and correlation. The following is the normal sampling algorithm flow for distribution transformer load power data:
-
(1) Calculate the covariance of load power of each distribution transformer.
-
(2) According to the known variance of each distribution transformer load power, the covariance matrix C=(cij) of each distribution transformer load power is obtained on the basis of step 1.
-
(3) According to the covariance matrix C, a lower triangular matrix of the linear transformation matrix A is constructed, and the element a ij in the matrix a is obtained by the following formula:
a i 1 c i 1 / d^n
a ii =

i - 1

Z a-p
p = 1
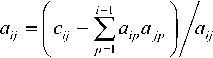
(1 < i < N)
(1 < i < N)
(1 < j < i < N)
-
(4) Form samples with known load power digital characteristics and correlations, the steps are:
-
1) Generate the initial sample data which is M in size and equal in dimension to the number of distribution transformer nodes and conforms N(0, I) distribution through independent sampling.
-
2) Based on the linear transformation matrix A and according to the expected value vector of each distribution transformer load power, each distribution transformer load power sample with known distribution load digital characteristics and correlation is formed.
The probabilistic power flow can be calculated by substituting all the distribution transformer load samples generated from the above random sampling into the formula (1).
-
IV. Simulation Analysis Example
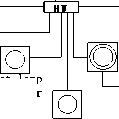
The above probabilistic load flow calculation taking into account the load power correlation is used to evaluate the power supply voltage quality of the10k V E Hong I distribution line in Zhuzhou city, Hunan province. The line structure is shown in figure 5.The distribution transformers include common distribution transformers and special distribution transformers. Due to the fact that the distribution transformer mostly adopts the no-load voltage regulation distribution transformer at present, the common distribution transformer gear is usually in the middle gear, i.e. the change ratio is 10kv/400 v. According to the requirements of national grid standards for power supply voltage deviation, the normal fluctuation range of 220V single-phase power supply voltage is 198-235.4v, and the normal fluctuation range of 10kV power supply voltage is 9.3~ 10.7kv. For the special transformer of 10kV, the low voltage side voltage is self-regulated by users.
HongQi gas station

Jia xing real Jia xing real
estate 2
Lantian industry
Steam tooth matching

Tapping box
Lanma company
estate 1

Mobile

Central area of steam teeth

# ring
7 # ring network cabinet
8 # ring network cabinet
4 # ring network cabinet
6 # ring network cabinet network cabinet
3 # ring network cabinet
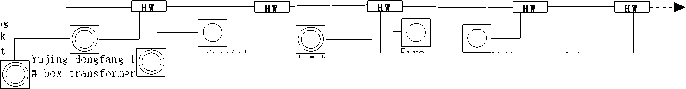
road tianping station area
Revitalizatio n of property
Yujing dongfang 2 # box transformer
Fire detachment
2 # box transformer in tianping road
Special transformer for yujing dongfang
Yujing dongfang 3
# box transformer
Building materials market in hetang district
1 # box transformer in
Special transformer for Huayuan real estate


Hongqi road police station area


3# box transforme r in auto city

Box-type transformer of Jinyun hotel
1 # ring network cabinet


Provincial fire brigade
3# box transformer in cuidi bay


Street lamp transformer
2# box transformer in cuidi bay
2 # ring network cabinet transforme r in auto city
Tapping box
1# box transformer
2# box transformer in auto city
E Hong I
4# box


Drainage company

Hualong eal estate
E Hong substation
in cuidi bay Zhongjizhou waterlogging transformer
drainage station
in auto city
5# box transformer in auto city
Fig.5. E Hong I of Zhuzhou city 10kV distribution line
The qualified control range of 10kv bus voltage in transformer substation is 10 ~ 10.7kv, in which 0.1kv is the interval. Under the condition that the 10kv bus voltage is within the qualified range, we can calculate the probability distribution of the voltage on the low voltage side of each common distribution transformer within the qualified range. The average value of the sum of the probabilities that voltages on the low voltage side of all the common distribution transformer are within the acceptable range is taken as the comprehensive probability that the low voltage side voltages of the common distribution transformer are within the qualified range. Since the voltage qualification rate is a long-term statistic on the slowly changing static voltage, the longer the statistical time is, the more consistent it should be with the voltage probability distribution, that is, the longterm voltage qualification rate should be equal to the probability that the voltage is within the qualified range. Figure 6 shows the comprehensive probability that the voltage on the low voltage side of the common distribution transformer is within the qualified range under different bus voltages. As can be seen from the curve in figure 6, when the 10kv bus voltage is between 10kv and 10.2kv, the voltage on the common distribution transformer low voltage side of the line is basically within the qualified range. When the bus voltage increased from 10.2kv to 10.4kv, the probability of the voltage within the qualified range dropped rapidly to nearly zero.
Considering the pressure drop factor of 400V low voltage line and the requirement of reducing network active power loss, the voltage should be as close as possible to the upper limit on the premise of meeting the qualification rate of voltage. The average value of the sum of the expected values of all common distribution transformers low-voltage side voltages is taken as the comprehensive expected value of the common distribution transformers low-voltage side voltages, and its value changes with the 10kv bus voltage as shown in figure 7.
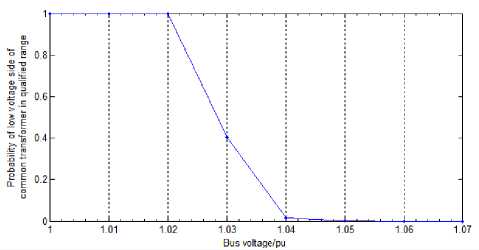
Fig.6. The probability of distribution transformer low voltage side voltage in qualified range with different bus voltage
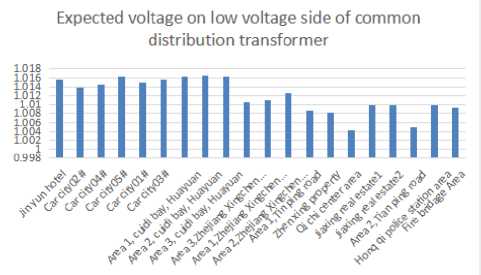
Fig.9. Expected value of distribution transformer low voltage side voltage when bus voltage is 10.22kV
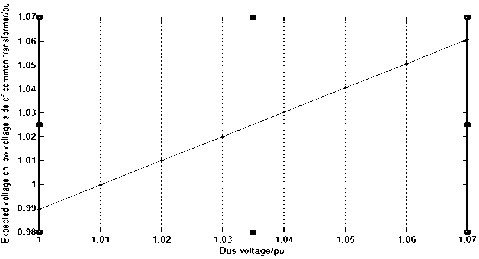
Fig.7. Expected value of distribution transformer low voltage side voltage with different bus voltage
Figure 7 shows that when the 10kv bus voltage is controlled within the qualified range, the comprehensive expected value of the common distribution transformer low voltage side voltage is also close to 0.99 at least, and is basically linearly increasing with the bus voltage.
Combined with fig. 6 and fig. 7, the 10kv bus voltage should be as stable as possible at about 10.2kv, so as to ensure that the qualified rate of the voltage on the low voltage side of the common distribution transformer and the expected value of the comprehensive voltage can meet the requirements at the same time. Further calculation and analysis show that when the 10kv bus voltage is stable at 10.22kv, the qualified rate of the low voltage side voltage of the common distribution transformer is 97.31% at least and the lowest expected value is 1.004pu. At this time, the qualified rate and expected value of voltage on the low voltage side of each common distribution transformer are shown in figure 8 and 9.
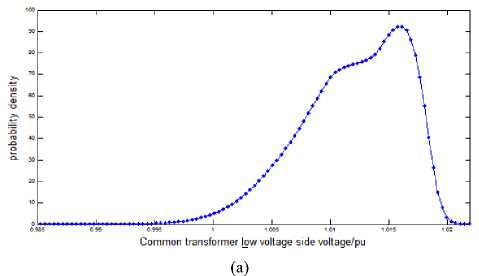
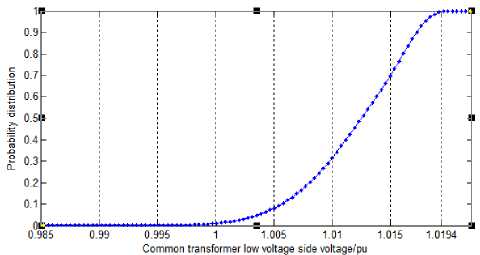
Figure 10 is the probability density curve and probability distribution curve of all common distribution transformer low-voltage side voltages at this time. It can be clearly seen from the curve that all common distribution transformer low-voltage side voltages are basically between 1 and 1.02, and the qualified probability reaches 0.9951.
(b)
Probability of voltage on low voltage side of common distribution transformer within qualified range
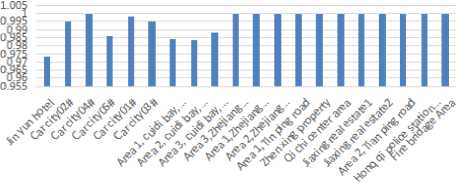
Fig.8. The probability of distribution transformer low voltage side voltage in qualified range when bus voltage is 10.22kV
Fig.10. The Probability Density and cumulative probability curve of distribution transformer low voltage side voltage
From the above calculation results and analysis, it can be seen that the overall voltage quality of the common distribution transformer low voltage side of the 10kv line is determined by the bus voltage when the common distribution transformer gear is in the middle position and there is no adjustment and the random fluctuation characteristics of each distribution transformer load are known at the same time. If the probability of 10kv bus voltage above 10.3kv is high, the overall voltage qualification rate of the common transformer low-voltage side will be lower. Therefore, in order to ensure that the qualification rate of the voltage on the low voltage side of common distribution transformer meets the requirements, it is necessary to strictly control the voltage level of 10kv bus or readjust the distribution transformer gear.
-
V. Conclusion
The qualified rate of power supply voltage [18] is an important evaluation indicator to measure the quality of power supply voltage. As a commitment to users, it must meet certain indexes. The distribution network covers a wide area and has a large number of distribution transformers. At present, it is unlikely to fully monitor the voltage quality on the low voltage side of the distribution transformer. According to the consistency between the statistical characteristics of the voltage qualification rate for a long time and the probability that the voltage is within the qualified range, based on the analysis of the random fluctuation model of distribution transformer load, the probability that the voltage of the common distribution transformer low voltage side of 10kv distribution lines is within the qualified range and the influence of 10kv bus voltage on the voltage qualification rate of the common distribution transformer low voltage side are analysed through probability power flow. The analysis results show that under the circumstance that the random fluctuation model of distribution transformer load is known, bus voltage controlled within a reasonable range can significantly improve the qualification rate of voltage on the low voltage side of the common distribution transformer. However, the actual 10kv bus voltage is also changed randomly due to changes in power flow in the main network. Therefore, in order to maintain the qualified rate of the distribution transformer low voltage side voltage of the line to meet the requirements, it is necessary to adjust the distribution transformer gear reasonably.
References Voltage quality evaluation of distribution network based on probabilistic load flow
- Zhang Yong,Bai Xianhong,Zhang Yongjun,Kuang Cuizhe. The Prediction Method of Voltage Qualification Rate Based on AHP-GCA and Multiple Linear Regression [J].Electric Power Science and Engineering, 2014, 30(5):1-5.
- Rubino, Mazza M, Andrei, et al. Ranking the Radial Configurations for Minimum Losses Distribution System Reconfiguration. Part 2: Intra-Day Domain Assessment [J]. Theentific Bulletin of Electrical Engineering Faculty, 2014, year 14:23-28.
- Turitsyn K, Sulc P, Backhaus S, et al. Options for Control of Reactive Power by Distributed Photovoltaic Generators [J]. Proceedings of the IEEE, 2011, 99(6):1063-1073.
- Bryantsev AM, Bazylev BI, Lur’E AI, et al. Compensators of reactive power for controlling and stabilizing the voltage of a high-voltage electrical network [J]. Russian Electrical Engineering, 2013, 84(2):57-64.
- Fazio A R D, Russo M. Wind farm modelling for reliability assessment [J]. Iet Renewable Power Generation, 2008, 2(4):239-248.
- Mahmoud K, Yorino N. Optimal Siting and Sizing of Distributed Generators [M]// Electric Distribution Network, Planning. 2018.
- Zio E, Delfanti M, Giorgi L, et al. Monte Carlo simulation-based probabilistic assessment of DG penetration in medium voltage distribution networks [J]. International Journal of Electrical Power & Energy Systems, 2015, 64:852-860.
- Hu Zechun,Wang Xifan,Zhang Xian,et al.Probabilistic load flow method considering branch outages [J].Proceedings of the CSEE,2005,25(24):26-33.
- Hajizadeh A, Golkar M A. Power Flow Control of Grid-Connected Fuel Cell Distributed Generation Systems[J]. Journal of Electrical Engineering & Technology, 2008, 3(2):143-151.
- Vrakopoulou M, Chatzivasileiadis S, Iggland E, et al. A unified analysis of security-constrained OPF formulations considering un-certainty, risk, and controllability in single and multi-area systems[C]// Bulk Power System Dynamics & Control-ix Optimization, Security & Control of the Emerging Power Grid, Irep Symposium. IEEE, 2013:1-19.
- Owen A B.Controlling correlations in Latin hypercube samples[J]. Journal of the American Statistical Association, 1994,89(428):1517-1522
- Schilling M Th,Leite da Silva A M,Billinton R,et al. Bibliography on power system probabilistic analysis.IEEE Transactions on Power Systems,1990,5(1):1-11.
- Bakkiyaraj R A, Kumarappan N. Reliability Evaluation of Composite Electric Power System Based On Latin Hypercube Sampling [J]. Waset Org.
- Cui Y, Bie Z, Wang X. Study on probabilistic models and algorithms of available transfer capability [J]. Automation of Electric Power Systems, 2003.
- Bie Z, Wang X. The application of Monte Carlo method to reliability evaluation of power systems [J]. Dianli Xitong Zidong-hue/automation of Electric Power Systems, 1997.
- Siano P, Sarno D. Assessing the benefits of residential demand response in a real time distribution energy market [J]. Applied Energy, 2016, 161(7):533-551.
- DENG Wei, LI Xinran, XU Zhenhua, et al. Calculation of Probabilistic Load Flow Considering Wind Speed Correlation and Analysis on Influence of Wind Speed Correlation [J].Powet System Technology, 2012,36(4):44-50.
- Yao Jiangang, Liu Qi, Chen Huihua, et al. Analysis of security and stability level of Hunan power grid [J]. Hunan power, 2003, 23 (4): 1 - 4.
