Volunteerism in Russia: Trends, regional differences and the impact of sociodemographic factors

Author: Dolbik-Vorobey T.A.
Journal: Economic and Social Changes: Facts, Trends, Forecast @volnc-esc-en
Section: Social and economic development
Article in issue: 4 т.18, 2025.
Free access
The article presents the results of a study of volunteering in the Russian Federation from a regional perspective for the period 2022–2024 according to the following indicators: level of volunteerism, median age of volunteers, number of female volunteers per 1,000 male volunteers, number of rural volunteers per 1,000 urban volunteers, proportion of working-age volunteers in the total number of volunteers. The analysis is based on official data from Rosstat – a sample survey of volunteering workforce for 2022–2024. The study shows that the median age of Russians engaged in volunteering is increasing. As a rule, there are more women than men among the volunteers. The ratio of rural to urban volunteers is growing. The share of working-age volunteers in the total number of volunteers in Russia as a whole is quite stable and ranges from 73–74%. In the course of the study, we calculate the following labor market indicators: volunteers’ labor force participation rate, volunteers’ employment rate, volunteers’ unemployment rate (or the proportion of volunteers who are currently unemployed), ratio of the number of volunteers who are unemployed to the number of volunteers who are employed (per 1,000 employed volunteers). The relationship between the level of volunteerism and other indicators was determined based on the use of paired (linear) Pearson correlation coefficients and paired Spearman’s rank correlation coefficients. In addition, we conduct a statistical analysis of individual regional quintile groups formed on the basis of the values of the level of volunteerism in the regions. The article will be of interest to economists, sociologists, political scientists, and others interested in research on volunteerism in Russia.
Volunteerism, volunteering, level of volunteerism, analysis of volunteer activity
Short address: https://sciup.org/147251838
IDR: 147251838 | UDC: 311:311.1 | DOI: 10.15838/esc.2025.4.100.12
Text of the scientific article Volunteerism in Russia: Trends, regional differences and the impact of sociodemographic factors
Volunteering is a type of socio-economic activity of the population, as a result of which some kind of service or help is provided without being paid for it, aimed at supporting individuals, organizations or institutions in need, as well as unpaid activities of individuals or organizations to eliminate the consequences of natural disasters, catastrophes, etc. It is often indispensable in organizing assistance to refugees and internally displaced persons1. It can be regular or occasional, related to certain events. An example of occasional volunteering is the dissemination of information and merch during public events (for example, services provided by volunteers during the 2013 Summer Universiade in Kazan, the 2014 Olympic Games in Sochi, etc.). Volunteer organizations are often established spontaneously, as soon as there is a problem that requires expeditious solutions. In this regard, we can note humanitarian aid collected in cathedrals, in other specially designated places. In the future, a volunteer organization can grow, develop and turn into an independent unit aimed at regularly giving support to the population. Also, volunteers can work as monitors and their activity can even have an unofficial character (relic hunters of various interests engaged in the search and illegal appropriation of historical artifacts, weapons, treasures, etc.).
The aim of the study is to analyze volunteering in Russian regions in 2022–2024. Accordingly, the following tasks were set and solved:
– to analyze the specifics of volunteering in Russian regions using descriptive statistics such as average, median values, coefficients of variation of the level of volunteering, median age of volunteers, the ratio of female volunteers to male volunteers, the ratio of rural volunteers to urban volunteers;
– to identify the correlations between the considered indicators and, if there are any, create regression models describing them;
– to calculate and analyze labor market indicators for the population group engaged in volunteering;
– to provide an analysis of volunteering by Russian regions’ quintile groups, ranked by the level of volunteering, to identify the presence of correlations between indicators within these quintile groups;
– to test the hypothesis of the correlation between the level of volunteering in the region and median age of volunteers, the proportion of women and rural population engaged in volunteering, the unemployment and employment rates of volunteers.
The scientific and practical significance of the conducted research primarily lies in the lack of such works in domestic statistical and economic practices, since the topic of volunteering is quite new to Russia and does not have a fixed research methodology. Meanwhile, the analysis of volunteering is very important for formulating the government socio-economic policy (both generally for Russia and for the regions).
The scientific novelty of the work is determined, in addition to the identified lacuna in domestic statistical research, by the possibility of using the findings in the process of developing socioeconomic policy by regional authorities.
Literature review
The issues of the formation and development of volunteering in Russia and across the globe are mainly addressed by sociologists and psychologists, to a lesser extent by economists and statisticians. For example, an article by American scientists examines the quality of life of both retired and working volunteers (Kim et al., 2025). Scientists from the UK have recently noted a decline in formal volunteering due to the trend away from collective to individual social activity (Nichols, 2024). English experts have identified the positive impact of volunteering on social engagement and health (Matthews, Nazroo, 2021). The assessment of age and cohort trends in volunteering is provided in the joint work of demographers from the USA and Taiwan (Peng et al., 2023). In 2017, a collaborative work by scholars from institutes of India and Canada was published, which revealed a positive relationship between engagement in volunteering and such socio-psychological characteristics as social responsibility, developed leadership skills, reduced engagement in corruption, etc. (Desai et al., 2017). A study by scientists from the USA (Cruz, Meisenbach, 2018) is devoted to assessing the communicative management of combining volunteering with work and home demands. Based on a survey, Chinese scientists have identified a close relationship between the will of the youth to engage in volunteering and supply of voluntary service, depending on the bureaucratization of the community committee (Zhang et al., 2018).
The joint work of scientists from Serbia and Russia (Tolvaisis, Filipova, 2020) is devoted to the analysis of personal development and the promotion of active citizenship among adolescents and youth as a result of participation in volunteering. C. Vallejo Rubinstein (Vallejo Rubinstein, 2020), C. Dawson (Dawson et al., 2019), and others wrote that cultural and social skills developed in childhood affect a person’s engagement in volunteering.
The satisfaction of volunteers with the results of their activities was investigated in the work by M. Fysentzidis and co-authors (Fysentzidis et al., 2024), who identified factors influencing satisfaction with the volunteer experience of respondents and noted the necessity of regular comprehensive analyses. The impact of volunteering on the development of a social educator was considered by scientists from Kazakhstan (Azimbek, Slambekova,
2024). The state of the world’s volunteerism has been consistently highlighted in UN reports since 20112.
Russian researchers are also dealing with this question. The stages of the formation of volunteering in Russia in comparison with foreign experience are considered in the works (Kudrin-skaya, 2006; Khvorostianov, 2017; Nevskii, 2020; Zadorozhnaya et al., 2021). The socio-cultural portrait of a Russian volunteer in the context of the constitutional and legal provisions is described by S.V. Petrova and colleagues (Petrova et al., 2020), R.R. Shayakhmetova (Shayakhmetova, 2022), A.M. Kushkhova, A.A. Kubova (Kushkhova, Kubova, 2023). The ways of improving the volunteering system in Russia are highlighted in the article by V.V. Grushina (Grushina, 2024). The issue of students’ readiness to volunteer and actual engagement, as the future intellectual basis of Russian human capital, was studied by A.S. Zemlyanskaya (Zemlyanskaya, 2022), O.I. Ilyina and co-authors (Ilyina et al., 2023). A historical overview of the development and formation of volunteering in Russia and, most importantly, the evidence of existing potential and methods of its achievement in modern conditions, are presented in the works by N.I. Gorlova (Gorlova, 2019) and M.A. Bochanov (Bochanov, 2024).
The analysis of Russian volunteering based on statistical methods was first conducted in 2020 using data for 2016–2019. The findings included the trend in the number of volunteers, their age and gender structure, place of residence and types of activities3. Despite this, there are practically no papers using multidimensional statistical analysis methods.
Scientists mainly rely on sociological surveys (sample surveys, interviews, etc.), which provides only a general picture of volunteering, from the narrow perspective of certain aspects. A similar situation is observed when using content analysis methods, as well as findings based on regulatory data (for example, the State of the World’s Volunteerism Report is based on this kind of data4). Thus, there is a certain scientific gap in statistical research on volunteerism in Russia.
Data and methods
The information base consisted of data from a sample survey of labor force for 2022–20245 (with no data on the Donetsk and Lugansk people’s republics, Zaporozhye and Kherson regions), which were analyzed using the following statistical methods: descriptive statistics (average, median values, coefficients of variation), correlation analysis (paired (linear) Pearson correlation coefficients; paired Spearman’s rank correlation coefficients; regression analysis – one-factor and two-factor linear regression models; time series indicators – growth and accession rates, absolute accession).
Based on the methodological base of the labor market and relative indicators, developed and recommended for implementation into statistical practice by the 19th International Conference of Labour Statisticians, including volunteers’ labor force participation rate and the proportion of working-age volunteers to the total number of volunteers, we developed formulas for calculating the key indicators of volunteering:
– proportion of volunteers to the population
(C^ S ,%):
_ YES™1
= YES™1 + NO™1 100 ,
where:
YES™1 is the number of volunteers in the subsample i (considering gender, place of residence, or age);
NO™1 is the number of non-volunteers in the subsample i (considering gender, place of residence, or age);
— volunteers’ employment rate (C™1 , % ):
F o°l
^- = TJJf^ 100 , (2)
where:
E™1 is the number of the employed among volunteers in the subsample i (considering gender, place of residence, or age);
– volunteers’ unemployment rate (or the proportion of the unemployed to volunteers; C ^e1 ,%):
UE^1
C™1 =--- l—r 100,
UE YES?01 ,
where:
UE™1 is the number of the unemployed among volunteers in the subsample i (considering gender, place of residence, or age);
– coefficient of the economic activity of volunteers (C™ t , %o):
. UE?01
c£= EjO-r 1000.
The analysis was carried out using the Excel and STATISTICA software packages.
Findings
The key statistical indicator characterizing engagement in volunteering is the proportion of volunteers to the population, or the level of volunteering. Basing on the ILO methodology, we consider the population aged 15 and older.
When conducting a primary analysis of all Russian regions (85 constituent entities) for 2022– 2024, the following results were obtained. In 2022, the national average level of volunteering (Cvol, %) was 2.64%, with significant variation among regions: from the Chukotka Autonomous Area, where volunteering was not recorded at all, to the Republic of Tyva with a value of 13.5%. A high level of volunteering was also observed in the Kurgan Region (11.5%)6. In the next two years (2023 and 2024), the level of volunteering increased by 0.78% and 1.25%, respectively (Tab. 1). While in 2022 it did not exceed 2.15% in 50% of Russian regions, in 2023 it increased to almost 3%, and in 2024 – to 3.3%.
The calculated coefficients of variation of the level of volunteering revealed significant heterogeneity of Russian regions in this indicator. In 2022, the coefficient of variation was 85%, which is much higher than the threshold of 33%, at which the population is considered heterogeneous, in 2023 it was 75%, in 2024 – 74%. This means that when forecasting the level of volunteering, as well as when making recommendations for managing volunteering, all the regions should be divided into homogeneous groups and each group should be considered separately.
In the course of the study, additional indicators were calculated that characterize volunteering in the regions: the median age of a volunteer (Mevol, age), the number of female volunteers per 1000 male pVOl volunteers ( , %); the number of rural volunteers
- Mml 7 Rvol per 1000 urban volunteers (-^oy, %o) and the proportion of working-age volunteers to the total number of volunteers (d^, %; see Tab. 1).
Table 1. The main statistical characteristics of the indicators of volunteering in Russia for 2022–2024
|
Indicator |
Average value |
Median value |
Variation range |
Coefficient of variation, % |
|
2022 |
||||
|
Gol ,% |
2.64 |
2.15 |
13.52 |
85.36 |
|
Mevo i ,age |
41.42 |
40.81 |
59.10 |
21.50 |
|
pvol ,%° |
2040 |
1883 |
5771 |
45.01 |
|
flvo l -^\ ,%0 |
818 |
490 |
12858 |
179.41 |
|
d±% |
73.48 |
75.36 |
100.00 |
20.29 |
|
2023 |
||||
|
Gol ,% |
3.42 |
2.99 |
12.70 |
75.13 |
|
Me v O i ,age |
42.84 |
43.61 |
45.56 |
17.27 |
|
pvol ,%° |
1975 |
1815 |
5865 |
45.66 |
|
Rvo l ^i ,%0 |
801 |
585 |
4255 |
101.01 |
|
d^,% |
74.47 |
75.44 |
100.00 |
17.02 |
|
2024 |
||||
|
Gol ,% |
3.89 |
3.34 |
18.60 |
74.07 |
|
Me v O i ,age |
43.72 |
43.83 |
40.60 |
14.49 |
|
pvol ,%° |
2182 |
1930 |
11313 |
65.09 |
|
Rvo l -^oi ,%0 |
1057 |
467 |
23724 |
257.79 |
|
d^,% |
74.25 |
74.84 |
64.10 |
13.62 |
Calculated based on: Results of the sample survey of labor force. Available at: document/13265
The study showed that the median age of Russians engaged in volunteering is increasing (in 2022 it was 42.8 years, in 2024 – 43.7 years). The regions are homogeneous in this indicator for the entire period from 2022 to 2024 (the variation coefficient in 2022 was 21.5% (which is below 33%), then it decreased to 14.5% in 2024).
Women predominate among volunteers. In 2022, there were 2,040 women per 1,000 men, in 2023 their number dropped slightly to 1975 and increased again to 2,182 in 2024. There are regions in Russia where women make up more than 80% of all volunteers. For instance, in 2022, in the Kirov Region their proportion was 82.8%, in the city of Sevastopol – 84.7%, in the Ivanovo Region – 85.2%. In 2023, in the city of Saint Petersburg their share was 85.1%, in the Kirov Region – 85.4%. In 2024, in the city of Saint Petersburg their proportion was 84.7%, in the Vologda Region – 84.4%, in the Kirov Region – 86.9%, in the Kaliningrad Region – 92.2%.
The calculated coefficients of variation showed that Russian regions are heterogeneous in gender of volunteers. Management bodies should take it into account when regulating volunteer work.
The calculated ratios of rural volunteers to urban volunteers show the predominance of city dwellers in 2022–2023. However, in 2024, there were 1,057 rural volunteers per 1,000 urban volunteers (in Russia in total). Moreover, there are regions where the majority of the population lives in rural areas, and there has traditionally been a predominance of rural volunteers over urban volunteers throughout the period under review. These include the Lipetsk Region (in three years the indicator increased from 2257 to 4178‰), the Republic of Altai (from 3133 to 7038‰, respectively), as well as the Chechen Republic, but its values fluctuated (2022 – 3069‰, 2023 – 1019‰, and 2024 – 3855‰).
The coefficients of variation of the ratio of rural volunteers to urban volunteers are higher than 33%. Therefore, according to this indicator, Russian regions are generally not homogeneous.
The proportion of working-age volunteers to the total number of volunteers in Russia is quite stable within 73–74%. The coefficients of variation are below 33%, which indicates the general homogeneity of Russian regions in this parameter. At the same time, from 2022 to 2024, in the Republic of Ingushetia the proportion of working-age volunteers was consistently 100%. In 2022 and 2023 the minimum value of the indicator was 0% (respectively, the Chukotka Autonomous Area and the Ivanovo Region), in 2024 the minimum value of the indicator was observed in the Kirov Region (35.9%).
Table 2 shows how the median values of the considered indicators changed.
Table 2. Changes in the median values of volunteering in Russia in 2022–2024
|
Indicator |
Increase (decrease), % |
||
|
in 2023 compared to 2022 |
in 2024 compared to 2023 |
in 2024 compared to 2022 |
|
|
Proportion of volunteers to the population for 12 months |
39.1 |
11.7 |
55.3 |
|
Median age of volunteers |
6.9 |
0.5 |
7.4 |
|
Number of female volunteers per 1000 male volunteers |
-3.6 |
6.3 |
2.5 |
|
Number of rural volunteers per 1000 urban volunteers |
19.4 |
-20.2 |
-4.7 |
|
Proportion of working-age volunteers to the total number of volunteers |
0.1 |
-0.8 |
-0.7 |
Calculated based on: Results of the sample survey of labor force. Available at:
According to calculations, the proportion of volunteers to the population rose by 55.3% from 2022 to 2024, with the most rapid increase being observed in 2023 compared to 2022 – by more than 39%. The median age of volunteers in 2022–2024 rose by 7.4%, the largest increase was in 2023 – by 6.9%. Also, in 2023, the ratio of women to men engaged in volunteering changed most intensively (increased by 6.3%), as well as the ratio of rural volunteers to urban volunteers (decreased by more than 20%). The proportion of working-age volunteers remained stable (changes within 1%).
Labor market indicators of volunteering in Russia For an in-depth analysis of the volunteer work, the main indicators of the labor market were additionally calculated: volunteers’ labor force participation rate (the level of volunteering), volunteers’ employment rate, volunteers’ unemployment rate (or the proportion of currently unemployed volunteers), the proportion of the number of unemployed volunteers to the number of employed volunteers (per 1000 employed volunteers). The calculations are based on the primary data from Rosstat7 (see formulae 1–4).
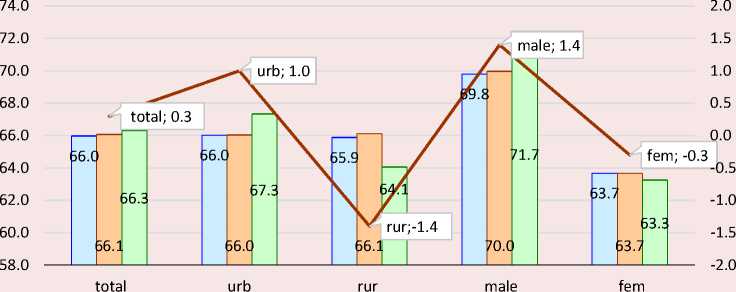
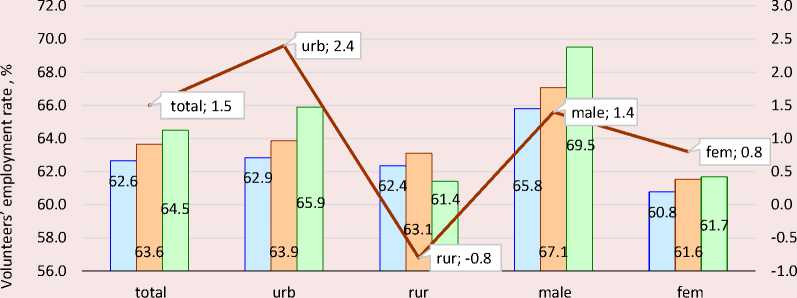
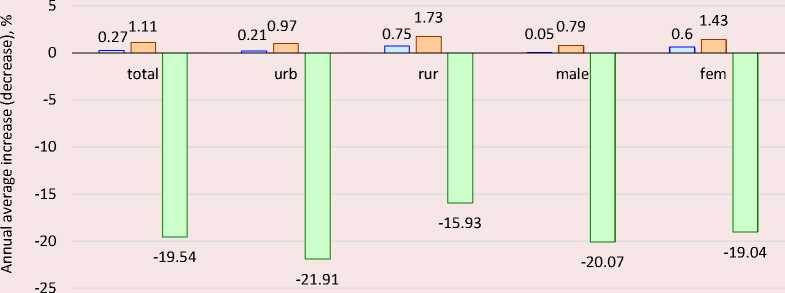
Thus, from 2022 to 2024, there was a growth in the volunteers’ labor force participation rate among the male population and urban residents, while the average participation of rural residents and the female population, on the contrary, declined. According to the calculated volunteers’ employment rate, an increase was observed among the urban and male population. Similar indicators for rural and female volunteers showed a negative trend, with a decrease by 1.4% and 0.3%, respectively ( Fig. 1a, 1b ).
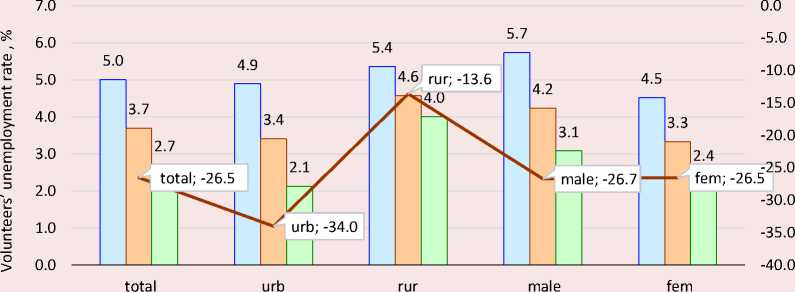
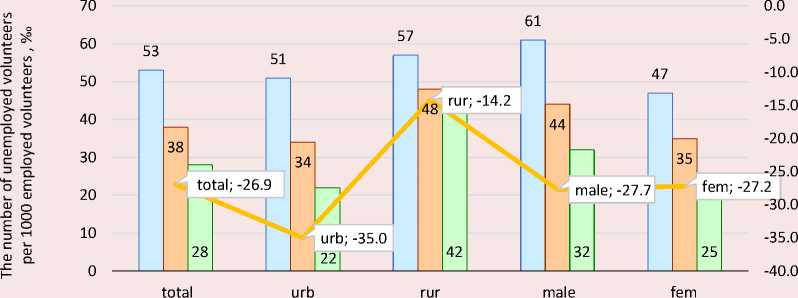
In addition, there has been an active decrease in unemployment among all the volunteers aged 15 and older. Particularly, the most significant decrease is among urban residents – by 34% annually (Fig. 1c). The dynamics of the economic activity coefficient is similar (Fig. 1d).
An analysis of changes in the volunteers’ labor force participation rate, employment and unemployment rates for the population aged 15 and older (considering the place of residence and gender) showed that it is similar to the calculations presented above for volunteers. This fact indicates the similarity of the processes in the labor market,
Figure 1. Dynamics of the main labor market indicators among volunteers in Russia in 2022–2024
2023 2024 Annual average increase (decrease), %
-
a) The volunteers’ labor force participation rate and its dynamics in total, by gender and place of residence
2022 2023 2024 ^^^^^^^^м Annual average increase (decrease), %
-
b) Volunteers’ employment rate and its dynamics in total, by gender and place of residence
2022 2023 2024 ^^^^^^^^^ Annual average increase (decrease), %
-
c) Volunteers’ unemployment rate and its dynamics in total, by gender and place of residence
2022 2023 2024 ^^^^мAnnual average increase (decrease), %
-
d) Economic activity of volunteers and its dynamics in total, by gender and place of residence
Labor force participation rate Employment rate Unemployment rate
-
e) Dynamics of the main labor market indicators among the population aged 15 and older in Russia in 2022–2024
Calculated based on: Results of the sample survey of labor force. Available at: document/13265
both among volunteers and the population in general (Fig. 1e).
To identify the relationship between the level of volunteering and other indicators (median age of volunteers, the ratio of female volunteers to male volunteers, the ratio of rural volunteers to urban volunteers, the proportion of working-age volunteers), paired (linear) Pearson correlation coefficients and paired Spearman’s rank correlation coefficients were calculated. The Pearson coefficients show only the degree of linear correlation. Therefore, in addition to them, the Spearman’s coefficients were determined, which characterize the degree of both linear and nonlinear correlations, but in terms of linear correlation they are less sensitive than the Pearson coefficients ( Tab. 3 ).
For 2022 and 2023, the correlation coefficients indicated the presence of a positive linear relationship (moderate degree) between the median age and the ratio of female volunteers to male volunteers, which means that with an increase in the median age of volunteers, the number of female volunteers per 1000 male volunteers also growths. Since the previously discussed dynamics of these
indicators has been positive over time, we should expect a general increase in the number of female volunteers in Russia and all its regions.
A negative relationship for the entire period of 2022–2024 is observed between the median age of volunteers and the proportion of working-age volunteers: with increasing age, the proportion of working-age volunteers decreases (in 2022– 2023 the relationship was non-linear, in 2023 it was linear). The revealed dependence allows forecasting a decrease in the proportion of workingage volunteers, since the median age of volunteers increases over time.
For 2023–2024, a moderate negative nonlinear relationship was found between the proportion of working-age volunteers and the ratio of rural volunteers to urban volunteers. Thus, an increase in the percentage of rural volunteers in total leads to a decrease in the proportion of working-age volunteers.
Due to the fact that Russia is regionally heterogeneous in most socio-demographic indicators, we conducted a statistical analysis of individual regional groups. To do this, Russian
Table 3. Pearson and Spearman correlation coefficients*
Variable Cvol,% MevOl,age pvol M^,% Rvol ^ог ,% dvol % dwa, % 2022 Cvol,% 1.000 0.221 -0.184 0.178 0.105 Mevoi,age 0.328 1.000 0.428 0.040 -0.293 pvol M^ ,%0 -0.122 0.341 1.000 -0.267 -0.283 Rvol uVrt ,%0 0.261 -0.029 -0.377 1.000 0.084 d^,% -0.038 -0.689 -0.305 0.114 1.000 2023 Cvol,% 1.000 0.020 -0.127 0.086 0.174 MevOi,age -0.022 1.000 0.511 0.049 -0.299 pvol M^i ,%0 -0.065 0.498 1.000 -0.297 -0.311 Rvol ^0г,% 0.044 0.036 -0.302 1.000 0.165 d±% 0.071 -0.740 -0.512 0.119 1.000 2024 Cvol,% 1.000 0.034 -0.143 -0.026 0.045 MevOi,age -0.001 1.000 0.464 -0.032 -0.817 pvol M^,% -0.201 0.456 1.000 -0.138 -0.601 Rvol ^vor,% 0.101 -0.104 -0.292 1.000 0.161 d±% -0.017 -0.792 -0.615 0.167 1.000 *According to Student’s t-test, significant coefficients below the threshold of 0.05 are highlighted in red; paired (linear) Pearson correlation coefficients are above the main diagonal of the matrix, paired Spearman’s rank correlation coefficients are below it. Calculated based on: Results of the sample survey of labor force. Available at: 11110/document/13265
Table 4. Dynamics of the main descriptive statistics for indicators of volunteering in Russia in 2022–2024
Indicator Characteristics of descriptive statistics Average value Median value Coefficient of variation, % 2022 2023 2024 2022 2023 2024 2022 2023 2024 First group Cvol,% 0.54 0.64 0.94 0.59 0.73 0.80 64.7 58.7 50.3 Mevoi, age 36.96 41.02 43.29 36.37 43.86 44.20 38.4 28.5 22.6 fvoi M^ ,% 2316 1959 2108 1983 1583 1669 61.9 68.8 52.6 Rvoi ^vor ,%0 566 1041 2082 417 737 397 95.3 86.2 271.6 d^,% 68.57 70.92 75.53 72.10 74.74 77.35 36.8 31.4 17.4 Second group Cvol,% 1.45 1.87 2.25 1.40 1.63 2.26 16.5 24.4 10.4 Mevoi, age 39.58 43.80 45.37 39.49 44.38 43.72 20.1 15.0 13.0 pvoi M^ ,%0 2166 2194 2913 1871 2078 2066 45.6 49.7 88.7 Rvoi ^voi,% 587 636 697 511 431 434 84.4 95.9 132.8 d^,% 77.23 75.00 71.09 78.97 75.72 72.70 14.0 12.9 17.4 Third group Cvol,% 2.15 2.95 3.31 2.15 2.99 3.34 9.4 8.3 11.8 Mevoi, age 42.21 42.67 42.44 40.70 42.01 42.42 9.8 10.1 8.2 pvol M^,% 1863 2042 2104 1852 1867 2063 25.6 27.0 23.2 Rvoi ^voi,% 611 545 379 363 405 305 122.3 99.3 81.5 d^,% 76.73 76.40 74.58 77.80 75.50 74.35 10.1 10.7 6.0 Fourth group Cvol,% 3.02 4.11 4.76 2.80 4.12 4.84 13.6 13.8 9.9 MeVoi, age 43.16 44.28 42.67 41.12 45.34 43.84 13.9 13.4 16.2 pvol M^,% 1980 1904 1795 1910 1850 1850 27.6 29.4 37.0 Rvoi ^vor,% 644 778 925 425 471 755 92.8 134.8 104.1 d^,% 72.21 72.53 75.32 74.16 74.71 73.59 14.7 11.6 13.4 Fifth group Cvoi,% 6.04 7.54 8.18 4.65 7.51 7.39 45.0 27.8 38.8 Mevoi, age 45.17 42.43 44.80 44.39 41.55 43.97 16.4 16.0 8.3 pvoi M^,% 1874 1778 1989 1572 1557 1614 44.8 41.5 55.7 Rvoi ^voi,% 1681 1005 1200 748 665 489 177.1 80.9 152.2 d^,% 72.64 77.50 74.74 75.36 76.94 76.48 18.8 12.0 11.4 Calculated based on: Results of the sample survey of labor force. Available at: regions were ranked by the growth of volunteering, and then divided into quintile groups (20% of the total). Further analysis was carried out in groups (Tab. 4).
The first quintile group included 17 regions (city of Saint Petersburg, Republic of Ingushetia, Astrakhan, Ivanovo, Penza regions, republics of Kalmykia, Crimea, Bashkortostan, Ulyanovsk Region, Republic of Mordovia, Smolensk Region, Perm Territory, Khanty-Mansi Autonomous Area, Chechen Republic, Vladimir Region, city of Sevastopol, Volgograd Region), their population was practically not engaged in volunteering (C vol , %) varied from 0.28 to 1.89%). However, the study showed that even there volunteering is
becoming more and more popular. Thus, in 2024, compared with 2022, there was a 1.7-fold increase in the average level of volunteering in the group. At the same time, the median age of volunteers is growing. In half of the group’s regions, it was less than 36.4 years in 2022, 43.9 years in 2023, and 44.2 years in 2024. So, volunteers in the first quintile group tend to age. Also, in this group of regions, the number of female volunteers is twice or more as much as the number of male volunteers. At the same time, while in 2022 city dwellers were more engaged in volunteering, in 2023–2024, according to this indicator, the rural population prevails. In the first quintile group, in 2022, the minimum (zero) level of volunteering was recorded in the
Chukotka Autonomous Area, the maximum level was in the Ulyanovsk Region (0.96%); in 2023, the minimum was in the Ivanovo Region (0.00%), the maximum was in the Orel Region (0.22%); in 2024, respectively, in the city of Saint Petersburg (0.28%) and the Volgograd Region (1.89%).
The composition of the second, third and fourth quintile groups changed every year, sometimes significantly, so the interpretation of the average values is quite difficult and we can only analyze the permanent members of the groups. For example, the Nizhny Novgorod Region was constantly present in the second group, and its level of volunteering was growing steadily (from 1.19% in 2022 to 2.26% in 2024). The third group’s permanent members were the Sverdlovsk Region (the indicator rose steadily from 1.94 to 3.56%), the Rostov Region (from 2.15 to 3.62%), the Chelyabinsk Region (from 2.15 to 3.42%) and the Republic of Sakha (from 2.22 to 3.51%). For the entire period from 2022 to 2024 the fourth quintile group included the Amur Region with a level of volunteering of 2.78–4.01%, the Republic of Mari El (3.17–5.04%) and the Samara Region (3.72–4.88%). They have a steady upward trend in the level of volunteering.
The fifth quintile group included 17 Russian regions with the highest level of volunteering (Primorye Territory, Komi Republic, Bryansk Region, Karachayevo-Circassian Republic, Pskov Region, Republic of Buryatia, Vologda Region, Republic of Khakassia, Altai Territory, Belgorod, Voronezh, Tver regions, Kabardino-Balkarian Republic, Kostroma Region, Kamchatka Territory, Republic of Altai, Kurgan Region). The average level of volunteering in this group was 6.04% in 2022, 7.5% in 2023 and reached 8.2% in 2024 (in 2024, it ranged from 5.71% in the Primorye Territory to 18.88% in the Kurgan Region). The median age of the volunteers for the period of 2022–2024 was 42–45 years. There is a significant predominance of female volunteers over male volunteers in this group: 1.9-fold in 2022, 1.8-fold in 2023, and almost 2-fold in 2024. At the same time, the average number of rural volunteers per 1000 urban volunteers decreased from 1681 to 1200, with a drop to 1005 in 2023. The average proportion of working-age volunteers was in the range of 72–77%. From 2022 to 2024, in nine of the seventeen regions volunteers were consistently active – Kostroma, Pskov, Bryansk, Tver, Vologda and Kurgan regions, republics of Buryatia, Altai and Kabardino-Balkarian Republic.
To assess the relationships for each quintile group using the 2024 data, paired (linear) Pearson correlation coefficients and Spearman’s rank correlation coefficients were calculated ( Tab. 5 ). According to calculations, in these groups, as well as in general, there is no relationship between the level of volunteering and age, gender, or place of residence, except for the third group with a noticeable negative relationship with the gender ratio of volunteers (the Pearson and Spearman coefficients were approximately -0.7).
In the groups, there is a linear correlation between the proportion of working-age volunteers and the median age of volunteers (in all the groups, the negative linear relationship is very high (0.8), except for the third group with a moderate degree of correlation). Also, in some of the groups, a negative relationship was found between the proportion of working-age volunteers and the ratio of female volunteers to male volunteers: in the first group, there was a moderate degree of linear relationship, in the second and fourth – a high degree of linear relationship, in the fifth group – a very high nonlinear relationship. In the fourth group, a moderate degree of negative linear correlation was recorded between the number of women per 1000 men and the ratio of rural volunteers to urban volunteers, which means that an increase in the proportion of women in the total number of volunteers occurs mainly in regions with a high proportion of urban volunteers. There is also a positive correlation between the median age of volunteers and the ratio of women to men (linear in the second and fourth groups and nonlinear in the fifth group). Thus, an increase in the proportion of women among volunteers leads to an increase in the median age.
Table 5. Pearson and Spearman correlation coefficients based on 2024 data*
Variable Cvol,% Mevoi, age pvol ^,%° flvoi yvoi ’%0 dvoi % dwa, % First group Cvol,% 1.000 0.215 -0.156 -0.119 -0.323 Mevoi,age -0.039 1.000 0.460 -0.009 -0.806 pvol ^,%° 0.074 0.475 1.000 -0.177 -0.557 flvol yvo ,%0 -0.244 -0.273 -0.419 1.000 0.187 d™a, % -0.115 -0.701 -0.728 0.408 1.000 Second group Cvol,% 1.000 -0.239 -0.120 -0.258 0.338 MeTOi,age -0.142 1.000 0.761 -0.125 -0.923 pvol ^,%° -0.108 0.529 1.000 -0.230 -0.767 flvol yvo ,%0 0.005 -0.044 -0.319 1.000 0.073 d^,% 0.282 -0.713 -0.583 0.213 1.000 Third group Cvol,% 1.000 -0.233 -0.674 -0.256 0.149 Mevoi,age -0.292 1.000 0.141 -0.022 -0.485 pvol ^,%° -0.679 0.174 1.000 0.238 -0.330 flvol yvo ,%0 -0.147 -0.005 0.147 1.000 -0.203 d^,% 0.147 -0.500 -0.240 -0.238 1.000 Fourth group Cvol,% 1.000 0.280 -0.030 0.150 -0.146 Mevoi,age 0.159 1.000 0.549 -0.038 -0.851 pvol ,%° -0.022 0.645 1.000 -0.487 -0.724 /?vol yvo ,%0 -0.015 0.022 -0.267 1.000 0.258 d^,% -0.069 -0.919 -0.743 0.115 1.000 Fifth group Cvol,% 1.000 -0.104 -0.157 0.153 0.141 Mevoi,age -0.336 1.000 0.240 -0.238 -0.930 pvol ,%° -0.343 0.488 1.000 -0.289 -0.415 /?vol yvoi ,%0 0.145 -0.331 -0.265 1.000 0.256 d^,% 0.289 -0.919 -0.669 0.211 1.000 *Paired (linear) Pearson correlation coefficients are above the main diagonal of the matrix, paired Spearman’s rank correlation coefficients are below it. According to Student’s t-test, significant coefficients below the threshold of 0.05 are highlighted in red. Calculated based on: Results of the sample survey of labor force. Available at: 11110/document/13265
Table 6. The results of regression analysis by quintile groups
Regression model Statistical characteristics of the model and the result First group d^ = 122.62 - 1.09Meagei R2=0.650 R2adj = 0.627 F (1, 15) = 27.9; t0 = 13.44; t1 = —5.28 with 15 degrees of freedom With an increase in the median age of volunteers by 1 year, the proportion of working-age volunteers will decrease by 1.09% Second group № = 159.32 — 1.94Me2flEi R2=0.853 Rhj = 0.843 F (1, 15) = 86.8; t0 = 9.55; t1 = 0.21 with 15 degrees of freedom With an increase in the median age of volunteers by 1 year, the proportion of working-age volunteers will decrease by 1.94% Fourth group d™J = 126.02 — 0.95Me2BBi - 0.01 ^ R2=0.819 R2adj = 0.794 F (2, 14) = 31.8; t0 = 7.256; t1 = 0.199; t2 = 0.002 with 14 degrees of freedom With an increase in the median age of volunteers by 1 year, the proportion of working-age volunteers will decrease by 0.95%, and with an increase in the number of female volunteers per 1000 male volunteers, the proportion of working-age volunteers will decrease by 0.01% Fifth group d^ = 170.83 - 2.15Me2Bei R2=0.864 Rldj = 0.855 F (1, 15) = 95.5; t0 = 17.31; t1 = —9.77 with 15 degrees of freedom With an increase in the median age of volunteers by 1 year, the proportion of working-age volunteers will decrease by 2.15% Notes: R2 — coefficient of determination; R2dj — adjusted coefficient of determination; F — Fisher’s test (at the significance level of 0.05); t0, t1, t2 — regression coefficients based on Student’s t-test (at the significance level of 0.05). The analysis of regression residuals in each group showed their normality (based on the Shapiro – Wilk test) and homoscedasticity (Goldfeld – Quandt test). Calculated based on: Results of the sample survey of labor force. Available at: 11110/document/13265
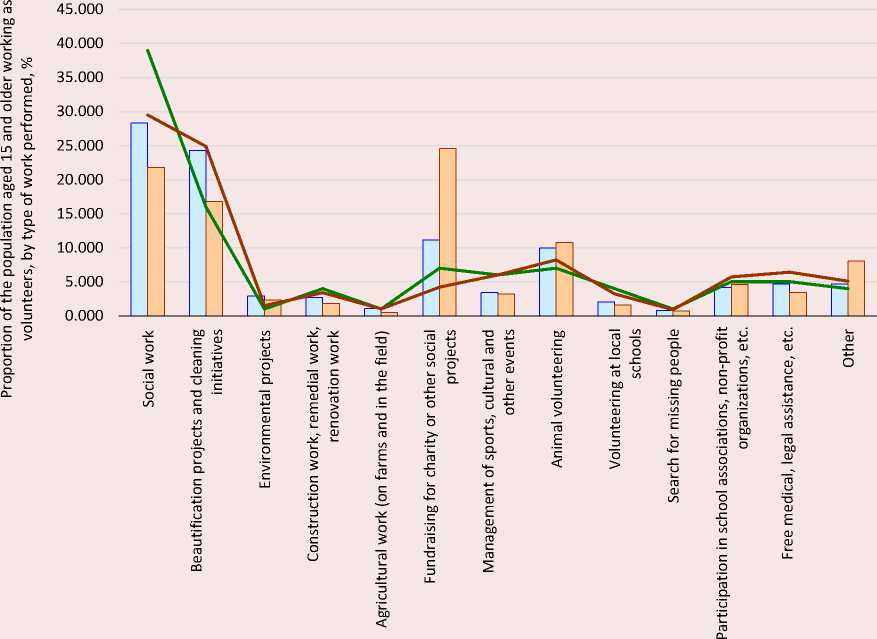
Figure 2. The structure of Russian volunteering by type of work for 2016, 2019, 2022, 2024
2022 2024 2016 2019
Calculated based on: Results of the sample survey of labor force. Available at: document/13265
Regression analysis allowed us to quantify the relationship between the indicators. Table 6 shows significant regression models of the correlation between the proportion of working-age volunteers and the median age of volunteers for the first, second, and fifth quintile groups (one-factor models), as well as a model of the correlation between the proportion of working-age volunteers and both the median age of volunteers and the number of female volunteers per 1,000 male volunteers for the fourth group (two-factor model).
A review of the volunteering structure by type of work showed the following. In 2022, the top priority was social work, its share was 28.3%, while in 2024 it accounted for only 21.8% of the total performance, and the direction “Fundraising for charity or other social projects” was given priority (in three years its share increased almost 2.2-fold and reached 24.5%). Such types of activity as “Beautification projects and cleaning initiatives” (2022 – 24.3%, 2024 – 16.8%) and “Animal volunteering” (2022 – 9.9%, 2024 – 10.7%)
were also dominant in 2022–2024. To determine the statistical significance of these structural differences, the V.M. Ryabtsev index was calculated. Its value was 0.216 and it is within the range of 0.151–0.300 which indicates a “significant level of structural differences”. So, over the past three years, the types of volunteer work have changed dramatically. Similar calculations were carried out by statisticians in 20208. The composition of the top-priority and dominant groups have not changed much, but their proportions differ significantly. The Ryabtsev coefficient (2019/2016) was 0.159, which also indicated significant structural differences (Fig. 2).
Conclusion
Based on the conducted research on volunteering in Russia and its regions in 2022–2024, the following conclusions can be drawn:
– as a rule, people of working age (41–44 years old) who have a full-time job, i.e. are employed in the economy, are engaged in volunteering in Russia;
-
– there is a positive trend in the number of unemployed volunteers, especially among unemployed men living in cities and small towns;
-
– both in Russia in general and in the regions, the proportion of female volunteers is increasing;
-
– volunteers’ labor force participation and employment rates are increasing during the period of 2022–2024;
-
– in Russia in general, there is no correlation between the level of volunteering and volunteer’s gender, place of residence, or age;
-
– in 2024, the influence of the median age of volunteers on the ratio of women to men among volunteers becomes noticeable;
-
– in 2024, there is a negative relationship between the number of working-age volunteers (relative) and their median age in the first, second and fifth quintile groups, and there is a negative relationship between the proportion of working-age
volunteers and both the median age of volunteers and the ratio of women to men in the fourth quintile group.
Thus, the hypothesis put forward at the beginning of the study that there is a relationship between the level of volunteering in Russia and a number of demographic indicators (the median age of volunteers, the ratio of female volunteers to male volunteers, the ratio of rural volunteers to urban volunteers, the proportion of working-age volunteers) is rejected.
The volunteer work is undoubtedly very important for Russia, and it is going from strength to strength. In this regard, the surveys conducted by Rosstat on the activities of volunteers should be appreciated. However, the data provided by the state statistical authorities are clearly insufficient for a thorough and comprehensive analysis of volunteering. The program of sampling inquiries about volunteering requires development in many aspects of volunteer work, so we can recommend that Rosstat include the following criteria in the inquiries: education, marital status, primary employment, income of the volunteer; reasons for choosing this type of volunteer work; person’s motivation to engage in volunteering.
