Water strategy of the Russian Federation and problems of water industry in the North-West federal district regions

Author: Kumzerov Valery Mikhailovich
Journal: Economic and Social Changes: Facts, Trends, Forecast @volnc-esc-en
Section: Environmental economics
Article in issue: 4 (8) т.2, 2009.
Free access
The article deals with the problem of water economy subjects of the North-West federal district. Water economy problems of the Vologda region are considered in relation to the challenges of the Water Strategy of the Russian Federation for water resource supply of the country’s socio-economic development for the period till 2020. Based on the analysis of water supply (water use and sanitation) in the North-West region the priority areas of work to achieve the target indicators of the Water Strategy, established in 2020 are justified. While developing regions’ water programs for the period till 2020 it is suggested to take into account the trends to improve the structures of water management, to motivate users to the introduction of modern water-saving technologies.
Water economy, water strategy, water consumption, water recycling, manufactured products water consumption, waste-water basin district, the scheme of complex use and protection of water bodies
Short address: https://sciup.org/147223162
IDR: 147223162 | UDC: 338.3(470.2)
Text of the scientific article Water strategy of the Russian Federation and problems of water industry in the North-West federal district regions
Ph.D. in Economics, Head of the laboratory of natural resources efficiency problems Institute of Territories' Socio-Economic Development of RAS
Russia possesses more than 20% of global freshwater resources (excluding glaciers and underground water). Among the countries of the world Russia ranks second in water reserves after Brazil and third in water availability per capita after Brazil and Canada. In calculating the volume of fresh water per capita in Russia there is about 30 thous. cu. m of river runoff a year. That is about 5.5 times higher than the average world level.
The main objective of the country’s water economy is ensuring all sectors of economic activity with water in the required quantity and quality. The solution to this multipurpose problem is impossible without coordination and alignment with national development strategy.
In August 2009 Water strategy of the Russian Federation until 2020 (the Strategy) was adopted by the Government order. The strategy defines the main directions of water industry development in Russia, and most importantly, provides water resource to ensure implementation of the Concept of the country’s long-term socio-economic development until 2020, adopted in November 2008.
The Strategy assesses the current state of the country’s water industry, public monitoring system and managing the consumption and protection of water bodies, scientific-technical support and staffing of the water complex.
A total water withdrawal from surface water bodies in Russia is 62.5 cu. km a year. Waste discharge into water bodies is 52 cu. km a year1. Water consumption in gross domestic product is 2.4 cu. m/thous. rub. The volume of water losses during transportation in 2007 reached 8 cu. km a year. About 11 million tons of pollutants annually come into surface water bodies together with the wastewater.
On the basis of the executed analysis the strategic objectives and priorities for development, activities and mechanisms of the Strategy’s implementation are identified. The target forecast indicators of the Strategy are calculated as key expected results which should be and can be obtained on the assumption of the implementation of planned activities.
Target indicators also serve as control tasks in the development of water policies and programs in the regions of the Russian Federation (tabl. 1) .
The strategy is implemented in two phases.
In the first phase (2009 – 2012) conditions for sustainable development of water industry are created, the normative legal framework and the management of water economic system is improved, innovative technologies are adopted, protection is enhanced and water quality in water bodies is improved.
In the second phase (2013 – 2020) an extensive modernization of water industry development on scientific-technical and technological base is carried out. The task of practical implementation of competitive advantages of Russia's water resource potential in foreign markets is set for the first time.
It is provided that the total amount of resource support to the activities of the Strategy will amount to 662.4 billion rub., including the budgets of federal entities and local budgets – 114,6 billion rub., extra-budgetary sources – 66.9 billion rub.
Despite the fact that the majority of spending is due to the federal budget, measures to improve the performance of public authorities of RF subjects of authority to manage water resources transferred from the federal level are taken.
According to the Ministry of Natural Resources and Environment the realization of the Water Strategy will reduce morbidity and increase life expectancy by 2 – 3 years by improving the ecological environment and quality of water sources, it will balance development of territories and sectors of national economy, prevent probable damage, estimated at 989.3 billion rub., reduce energy intensity by 20 billion rub. annually.
The programs should include the reduction of negative impacts on water bodies, restoration and environmental rehabilitation of water facilities, including small rivers, construction of sanitary protection zones, the development of a monitoring system, measures to ensure the operational reliability and safety of hydraulic structures, public education and informing.
Targets for water use and restoration of water quality, which should obtained by water industry in Russia by 2020 will require sciencebased approach to regional water policies and programs development, integration of the efforts of federal, state and municipal authorities and private businesses at the regional level. The development of regional programs on the use and protection of water bodies should begin as early as 2009.
Of course, the programmed portion of the work should be based on fairly detailed analytical foundation. Moreover, it is not possible to do the analysis in a particular subject of the federation without consideration of the water
Table 1. Target forecast indicators of Water Strategy (expected results)
|
Indicators |
Indicators’ value in 2007 |
Indicators’ value in 2020 |
By the level of 2007 |
|
GDP water consumption cu. m7thaus. rub. |
2.4 |
1.4 |
Decrease by 42% |
|
The volume of water losses during transportation, cu. km/year |
8.0 |
4.0 |
Decrease in 2 times |
|
The proportion of contaminated* waste water in the total amount allocated sewage, % |
89.0 |
36.0 |
Decrease in 2.5 times |
|
Mass of pollutants flowing into water bodies from wastewater, million tons/year |
11.0 |
6.6 |
Decrease in 1.7 times |
|
*Contaminated wastewater is industrial and domestic (municipal) waste water discharged into surface water bodies without treatment (or after inadequate treatment) and contains contaminants in amounts exceeding the approved maximum allowable discharges. This does not include drainage of water allocated to irrigated land after watering. |
|||
resources balance in river basins and reservoirs located, as a rule, on the territory of several subjects of the federation.
Facilities of the North-West federal district water complex in entering the targets of the Strategy for some reasons are more preferable in comparison with other subjects of Russia.
First, the economy of the North-West is not experiencing a chronic shortage of water resources.
Despite the high level of water supply in Russia as a whole because of the uneven distribution of surface and groundwater in the territorial aspect a lot of region suffer from their deficiency. About 90% of river discharge occurs in basins of the Arctic and Pacific Oceans. Main hydrotechnical load and water intake fall on the Volga River, where 70% of economic potential and 40% of the population are concentrated.
If in Russia as a whole the total intake of fresh water from water sources is about 3% of total water resources, in a number of river basins it is only 50% or more. The possibilities of non-repayable water withdrawals in the basins of the Kuban, Don, Terek, and Ural are almost exhausted. In 2007, as compared with 2005 in most subjects of the federation it is noted a slight increase in the use of fresh water (the national average growth is 0.6%), but in the North-West federal district water consumption increased by 3.6% and is 11.77 billion cu.m, 19% of the total water consumption in Russia.
Sufficiency of water supply for population and industries of North-West is not limited because of low water availability in rivers, lakes and reservoirs, with rare exception when in dry years, for example, in 2005, the restriction of water use was introduced for a number of water bodies. At the same time in the republics and regions of North-West there are regional limitations due to topography, hydrology, the presence of reservoirs, the annual climatic anomalies.
Take, for example, the Vologda region. It would seem that there are no problems in the field of water resources in the region, water consumption is only 1.8% from emerging in the region water resources, about 3% in the years of 95% provision. Nevertheless, problems with water supply in dry years occur. The fact is that the location of the Vologda region on the main watershed of the White Sea, Caspian and Baltic Sea basins within the Andoma, Kirillov, Vologda and Severnye Uvaly uplands causes outflow of water from the region within 51.6 cu. km per year, with 11.2 cu. km inflows from neighboring regions. All the major rivers of the region except the Mologa and Luza Rivers are presented as the heads and the upper reaches, and carry their waters away in the White Sea – 29.3 cu. km, the Baltic – 2.9 and the Caspian Sea – 19.4 cu. km.
Adverse hydrological factor – extremely low water content in the Vologda region was already observed twice in 21 century, in winter 2002 – 2003 and in the autumn-winter period in 2005 – 2006. The lowest levels were recorded in the river Sukhona in winter 2003, which has affected water supply to residents and industrial enterprises of the town of Sokol.
Deficit rainfall in 2005 led to the depletion of water resources again. The hydrologic regime of the region’s rivers in November – December 2005 was similar to the condition of water facilities in late 2002. However, changes in the hydrological regime are not persistent and do not have serious consequences, they can be overcome in the course of preventive measures.
Secondly, since 2000 the enterprises of the North-West have been implementing circulating and sequential water use at rapid pace, exceeding the average indicators for Russia more than half 2. Therefore, the district’s enterprises have more opportunities for entering the controlling indicator of the Strategy for water consumption in gross regional product by 2020, as the Ministry of Natural Resources do not consider in calculating the specific water consumption. It is characteristic that in the country as a whole, circulating and sequential water use has decreased almost everywhere in recent years.
In the most amount the volume of recycled and reverse water consumption in 2007 compared with 1990 has decreased in the Far East federal district (more than one-third), the least – in the North-West district at 12% (tabl. 2) .
In most federal districts the value of recycled and reverse water consumption (hereinafter “recycled water consumption”) exceeds the direct flow of water. The exception is water use in South and North-West federal district.
The lag on this indicator can also be seen as a fallback position for the exit on the indicators of the Strategy in a number of the North-West federation subjects.
Volumes of recycled water in the North West are growing since 2001. In the republics of Karelia and Komi, the Murmansk and Arkhangelsk regions they are growing since 2000. In the Vologda region volumes of recycled water supply began being restored in 1995 and grew at 19.3% by 2007 from 1990. In all other regions of the district they have not reached the level of adjustment.
If in the district in general recycled water consumption does not exceed the amounts of once-through, in the Novgorod and Vologda regions recycled water consumption exceeds the direct withdrawal of water from water bodies more than 5 times.
More than a third of the total recycled water in the district is accounted for the Vologda region. Little attention is paid to the introduction of recycled water consumption in the Pskov and Leningrad regions (tabl. 3) .
Information on the once-through and recycled water consumption permits to carry out calculation of water consumption of their products on their basis.
Water consumption of the gross regional product is a generalized indicator of water use efficiency; comparison of the amount spent the water spent with the results of economic activity shows how much water resources are expended for the regional product units. According to the dynamics of this indicator one can judge about trends in the use of water resources. Unfortunately, environmental authorities do not analyze or take into account this indicator in practice in the preparation of management decisions, however, as well as in most water consuming enterprises.
Table 2. Dynamics of basic indicators of water use in Russia and the North-West federal district, million cu. m
|
Years |
Use of fresh water. Direct flow water consumption |
The volume of recycled and reverse water |
Wastewater discharge into natural surface water bodies |
|
The Russian Federation |
|||
|
1990 |
96,152 |
170,563 |
27,798 |
|
1995 |
75,780 |
137,820 |
24,478 |
|
2000 |
66,924 |
133,482 |
20,291 |
|
2006 |
62,153 |
142,596 |
17,489 |
|
2007 |
62,506 |
144,386 |
17,176 |
|
2007 in % to 1990 |
65 |
85 |
62 |
|
Including North-West |
|||
|
1990 |
14,538 |
12,531 |
4,358 |
|
1995 |
11,753 |
9,893 |
3,692 |
|
2000 |
11,342 |
9,728 |
3,579 |
|
2006 |
11,641 |
10,847 |
3,092 |
|
2007 |
11,774 |
10,972 |
3,101 |
|
2000 to 1990 |
81 |
87.6 |
71.2 |
Table 3. Once-through and recycled water consumption ratio in the subjects of the federation in the North-West Russia in 2007 (million cu. m)
|
Territories |
Once-through water consumption |
Recycled water consumption |
Recycled and once-through water consumption ratio |
|
North-West federal district |
11,774 |
10,972 |
92.7% |
|
Republic of Karelia |
226 |
1,056 |
4.67 times |
|
Komi |
543 |
1,441 |
2.65 times |
|
Arkhangelsk region |
693 |
855 |
1.23 times |
|
Vologda region |
728 |
3,721 |
5.1 times |
|
Kaliningrad region |
146 |
255 |
1.75 times |
|
Leningrad region |
6,255 |
1,353 |
21.6% |
|
Murmansk region |
1,605 |
1,018 |
63.4% |
|
Novgorod region |
107 |
582 |
5.4 times |
|
Pskov region |
292 |
8 |
2.7% |
|
St. Petersburg |
1,179 |
684 |
58.01% |
In our view, the calculation of gross water consumption of the product without taking into account the volume of recycled and reverse water consumption (so the figure is calculated in the Strategy) is only important for the comparative analysis of regions of Russia and as a monitoring indicator. True situation of water consumption, waste and savings, and the ways of water conservation can be shown by a more complete analysis and calculation of water consumption for all types of water supply.
Water consumption of the gross regional product for the subjects of the Federal District can be calculated by the formulas (tabl. 4) :
W = R + R W = RL
W1 V and 2 V where:
W 1 – water consumption of the gross regional product of the total, once-through and recycled water consumption;
W 2 – the same for once-through water consumption;
R 1 – the annual fresh water consumption;
R 2 – the annual volume of recycled water consumption;
V – gross regional product.
At first sight the conclusion that the water consumption of the gross regional product (W1) of the Leningrad and Vologda regions, calculated on the total once-through and recycled water consumption is extremely high and indicates the low efficiency of water use is simply false. GRP water consumption depends primarily on the structure of the economy (the share of water-intensive industries) as water consumption for each product is determined by the applicable technology and, of course, by the quality of labor and management. Many products cannot be produced without significant cost of water that is why water-intensive productions are located in the regions not affected by its deficiency. Thus, in the Vologda region water consumption calculated from the total water consumption is one of the highest in the district and above the regional average.
When calculating the indicator of water consumption of once-through water consumption, that is, without working water consumption for water-intensive enterprises of metallurgy, chemistry, and pulp and paper industry, whose share in the structure of GRP by economic activity is 45.8%, the water consumption decreased by 6 times.
At the same time it must be admitted that the proportion of recycled water consumption at the enterprises in the Leningrad region is small, about 18%, as confirmed by the calculation of water consumption by using once-through fresh water that at the enterprises of the Leningrad region is 8 times higher than federal, and 5 times than the average for the district.
Given that the Strategy is predicting the access to water consumption in the economy of 1.4 cu. m per thous. rubles of GDP (see tabl. 2), problems with the protection of limits
Table 4. Water consumption of the gross regional product for the subjects of the Federation of North-West federal district in 2007
|
Annual fresh and recycled water consumption million cu. m R1+ R2 |
Annual fresh water consumption million cu. m R 1 |
Gross regional product million rub. V |
Water consumption of the gross regional product of the total, once-through and recycled water consumption cu. m/th. rub. W 1 |
Water consumption of the gross regional product of once-through water consumption cu. m/th. rub. W 2 |
|
North-West federal district |
||||
|
22,746 |
11,774 |
2788330.6 |
8.1 |
4.2 |
|
Republic of Karelia |
||||
|
1,282 |
226 |
104622.9 |
12.3 |
2.1 |
|
Republic of Komi |
||||
|
1,984 |
543 |
242430.9 |
8.2 |
2.2 |
|
Arkhangelsk region |
||||
|
1,548 |
693 |
286861.9 |
5.4 |
2.4 |
|
Vologda region |
||||
|
4,449 |
728 |
243947.6 |
18.2 |
3.0 |
|
Kaliningrad region |
||||
|
401 |
146 |
145920.6 |
2.7 |
1.0 |
|
Leningrad region |
||||
|
7,608 |
6,255 |
312405.0 |
24.4 |
20.0 |
|
Murmansk region |
||||
|
2,623 |
1,605 |
192176.6 |
13.6 |
8.4 |
|
Novgorod region |
||||
|
689 |
107 |
87560.0 |
7.9 |
1.2 |
|
Pskov region |
||||
|
300 |
292 |
63107.7 |
4.8 |
4.6 |
|
St. Petersburg |
||||
|
1,863 |
1,179 |
1109297. 4 |
1.7 |
1.1 |
on water use in the future, which for the subjects of the Federation are established by the Federal Agency for Water Resources, will arise in the Leningrad region, Murmansk, and possibly in the Pskov region.
However, in our opinion, the regions of North-West will be harder to solve another problem of the Strategy, i. e. to reduce the proportion of contaminated wastewater in 2.5 times.
The problem of contaminated wastewater is rather acute in the federal district.
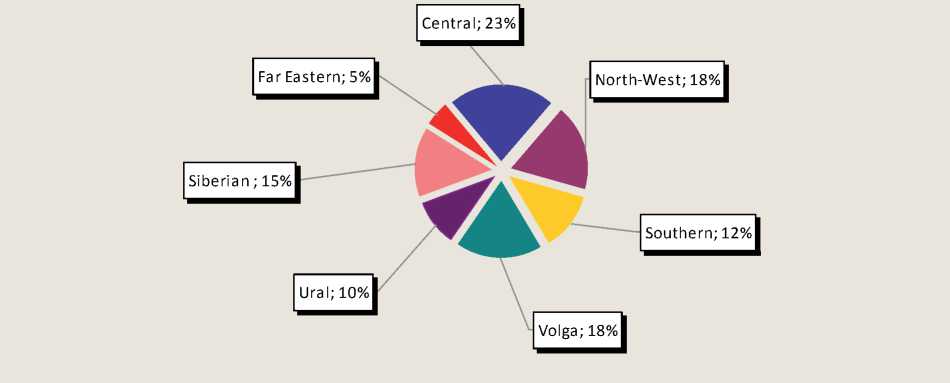
The share of polluted waste water in the Districts in the total amount of allocated waste was 18% in 2007. Larger volume of wastewater is discharged only in the Central federal district (fig. 1) .
If in the whole of Russia the volume of polluted water in 1991 – 2007 decreased by 38%, and the water consuming enterprises of the Southern federal district this reduction was 55%, Siberian – 50% and the Volga – 43%, in the North-West federal district, this volume decreased at 28.8%.
Sewage discharge decreased by 1.8% in 2007 compared with 2006 in the whole country. In the objects of the North-West federal district in 2007 compared to 2006 the growth of wastewater discharge by 0.3% is marked.
The growth of wastewater discharge occurs not only with growth in output, but also with the deterioration of the treatment quality at the outdated sewage treatment plants that do not meet the volume of wastewater discharge in their capacity.
The outdated treatment plants which do not correspond to modern requirements for the degree of effluent are found in all subjects of the federal district.
Figure 1. Distribution of surface water bodies sewage discharge in federal districts in 2007
One of the reasons for poor water purification is an old “classic” technology of wastewater disinfection with chlorine. In addition to difficulties with transport, storage and dosing of chlorine, its main drawback is the ineffectiveness of chlorine against viruses. Methods of disinfection of sewage by ultraviolet irradiation have been used in the Komi Republic, the Vologda, Kalinigrad, and Novgorod regions and in St. Petersburg in recent years. Ozonation of wastewater is carried out in Cherepovetz.
Along with general characteristic features of water consumption in the North-West in general, water economy in each subject of the federation has its own characteristics, features, problems, and that is of interest to study in terms of reaching the target indicators of the Water Strategy.
On the basis of the Water Strategy of the country the control indicators should be calculated in the subjects of the federation for the development of regional water programs. An example of such a calculation for the Vologda region is shown below (tabl. 5) .
In our opinion, for water users and the environmental authorities of the Vologda region of the most problematic is the achievement of control indicators for the Strategy of the regional product’s water consumption and cleaning up polluted wastewater.
Water consumption. The main water consuming companies mostly completed the transition to recycled and reverse water consumption.
In the Vologda region the amount of recycled and reverse water used are the highest in the enterprises of the city of Cherepovetz.
Particularly significant increase in recycled and reverse water consumption in 2007 was also carried by water users in Cherepovetz:
JSC “Severstal”
JSC “Cherepovetzky Azot”
JSC “Ammofos”
JSC “Sokolsky PPM”
38,2 million m3
26,2 million m3
7,4 million m3
2,0 million m3
JSC “WGC-6” HPP of Cherepovetz 0,4 million m3
Water savings coefficient through the use of water recycling is: in JSC Severstal 97.5%, “Ammofos” and “Azot” more than 95%. This is the limit.
At a number of Vologda and Sokol enterprises saving water factor is 50 – 30% due to the use of water recycling.
Further reduction in water use by businesses with small amounts of water use is difficult because of low economic effect. Return on investment in these enterprises is, as a rule, within a reasonable time. Administrative methods used by environmental authorities as well as small businesses have little effect.
Table 5. Target forecast indicators of the Water Strategy for Russia and indicators of water consumption in the Vologda region
|
Indicators |
Indicators 2007 |
Projected reduction of indicators by 2020 (RF Strategy) |
Estimated indicators quantity in accordance with the Strategy |
|
GDP water consumption, cu. m/th.rub. |
3 |
by 42% |
1.74 |
|
The volume of water loss during transport, million cu. m |
12.3 |
2 times |
6.15 |
|
The share of polluted wastewater in the total amount of water drain, in% |
72 (174 million tons) |
2.5 times |
28.8 (69,6 million tons) |
|
Mass of pollutants flowing into water bodies from wastewater |
70.1 thous. tons |
1.7 times |
41.2 thousand tons |
Table 6. Dynamics of water use in the Vologda region, million cu. m
|
Years |
The direct flow water volume |
The volume of recycled and consistently used water |
Contaminated waste water into natural surface water bodies |
|
1990 |
900 |
3,118 |
272 |
|
1995 |
666 |
3,405 |
268 |
|
2000 |
771 |
3,655 |
241 |
|
2005 |
630 |
З,614 |
172 |
|
2006 |
710 |
3,641 |
167 |
|
2007 |
728 |
3,721 |
156 |
|
2007 to 1990 , in % |
80.9 |
19.3 |
57.4 |
Wastewater treatment. Currently, the balance of organizations and enterprises of different ownership forms has 282 sewage treatment plants operating with varying degrees of effectiveness.
In a survey of treatment facilities and the quality of effluent treatment conducted by the Department of Natural Resources and Environment in 2002 – 2003 it was found that only 30% of plants are operating with sufficient effectiveness. Recovery of treatment facilities and introduction of modern treatment technologies require significant investment.
In 2000 – 2007, the implementation of water conservation measures, which allowed leaving the intensive uses of water, and significantly reducing the human impact on water bodies, was successfully implemented in the region (tabl. 6) .
Analysis only of three water indicators suggests an extremely complex and dynamic changes in the water economy of the region over the past 18 years. The volume of recycled water has increased by 603 million cu. m which is comparable with the annual volume of fresh water. Wastewater discharge is reduced by 116 million cu. m, which is more than half.
The volume of contaminated waste water decreased by 2.9 million cu. m in 2007 compared with 2006 and amounted to 174 million cu. m, which again is associated with increased use of water in recycling and consistent reverse systems (80.3 million cu. m) and reduced water use by large enterprises of housing and communal services (6.53 million cu. m). Major investment programs are implemented at the Cherepovetz and Vologda water utilities.
Nevertheless, 70.1 tons of pollutants were dropped with sewage in the water system in 2007 that is at 5.3 tons more than in 2006, which confirms the need for increased investment in the implementation of advanced treatment technologies.
The discharge mass of pollutants by enterprises and water consumers of the region are allocated as follows:
-
- JSC Severstal – 25%;
-
- MUE “Vodokanal” of Cherepovetz – 23.6%;
-
- MUE “Vodokanal” of Vologda – 11.6%;
-
- MUE “UK Sokolpromvodoochistka” – 11%;
-
- JSC “Ammofos” – 4.8%;
-
- JSC “Cherepovetzky “Azot” – 3.7%;
-
- Other regional enterprises – 20.3%.
Major water consumers are 6 enterprises of the region which account for almost 80% of the discharged pollutants mass will not be able to reduce the volume of discharges by mass of 2.5 times. At the same time, small enterprises will have to reduce discharges by 50 percent or more to enter the Strategy’s tasks. And that is not realistic.
Consequently, when developing the regional water program until 2020 it is necessary to provide for the introduction of the best modern technology of cleaning and disinfection of sewage, to offer non-standard organizational and regulatory methods to improve the efficiency of water consumption.
In addition, the regional program should solve the problem of conservation and renewal of water quality in small rivers where the principal amount of sewage treatment facilities of housing and communal services are located.
Hydrological monitoring on the rivers of the region is being hold at 67 hydrological posts, hydrochemical – on 29 rivers, Rybinsk and Sheksninskoe Reservoir and Lake Kubenskoye at 48 monitoring posts.
Over the past 15 – 20 years pollution in water bodies of the region is not getting worse. Moreover, the joint efforts of regulatory authorities and water consuming enterprises mitigated the adverse impact on the rivers which are the main sewage drains: Koshta, Yagorba, Pelshma, Sukhona, Vologda. Index of water pollution, for example, in the river Pelshma, the dirtiest river of the region in 2000 stood at 80.18 and decreased in 2007 to 7,54 (fig. 2) .
As a result of the program for the reconstruction of water supply and sanitation in MUE “Vodokanal” of Cherepovetz dump waste from sewage treatment plants water treatment plant is classified in the category of normative-treated sewage. The water in the downstream of the Yagorba River became clearer than in the upper reaches.
Significant improvement in water quality is achieved in the Toshnya River due to the reconstruction in 2005 – 2008 of treatment facilities of the sanatorium “Noviy Istochnik”, settlements Fedotovo and Lomtevo with the introduction of innovative technologies disinfecting wastewater in plants combining the use of ultraviolet radiation and ultrasound.
Management decisions on water conservation and preservation of water quality of rivers,
Figure 2. Water quality of the Pelshma River according to specific combinatorial index of water pollution SCIWP 2001 – 2007 *
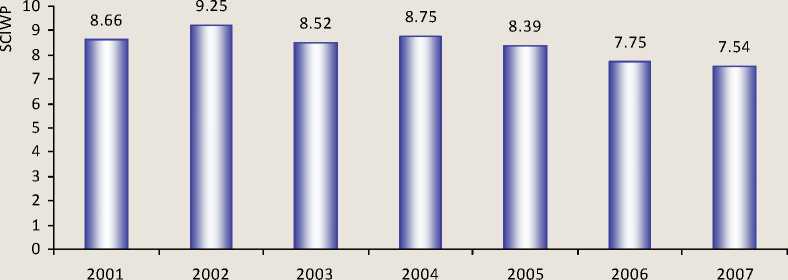
* SCIWP value can vary in different degrees of water pollution from 1 to 16. The highest index evaluation corresponds to the worst water quality in the various cross-sections of thewater body.
lakes and reservoirs, as outlined in the Strategy should be evaluated in terms of sustainable development.
Water consumers are interested in water conservation to the extent to which it is profitable for an enterprise in the existing natural and economic environment. Water-saving technologies require significant one-time costs, but since they are energy-efficient, the cost recovery occurs fairly quickly. The less there is water, the less energy for its submission to the entire technological chain is required, etc. The company, subject to its economic interests, takes the transition from extensive to intensive methods of water consumption, in particular, introduces a system of recycled water consumption.
However, with the lapse of time the situation is changing. With a constant increase in water consumption each following event on water conservation costs the company more expensive, and in some stage the water consumer is aware that a cheaper option is increasing volumes of water from water bodies, rather than the introduction of water saving technologies.
In economics, these processes are described as economies of scale and the law of diminishing effectiveness.
State authorities, for their part, managing the entire system of water consumption, improve regulation of water consumption, introducing the contractual relationship and governing the water tax rates.
However, market impact practices on the market of natural resources are not decisive, since it does not supply and demand which determines the water shortage, but environmental factors. The quality of the environment is not for sale on the market and it is not directly measured. Environmental and social problems of water relations require direct government regulation. Nevertheless, the economic development priorities take precedence over environmental for political reasons, defense, etc. Environmentalists have their own problems. Environmentally safe removal of water from the water body and the volume of wastewater are often not defined with the necessary preci- sion, so the natural restrictions are often not perceived as tough. Besides, the principle of no impunity for violations of environmental laws, for reasons both objective and subjective (the consequences of violating environmental constraints are sometimes affected by a certain time and away from the unfair water consumers), small size of penalties is not an obstacle to the above-limit dirt dumping and water intake.
It is obvious that the role of various management tools depends on the specific circumstances and prospects of situation’s development. The problem of correlation of economic and environmental development is relevant. People and businesses should not rely solely on economic rationality; they should pay more attention to common good, the use of which causes external effects.
Natural resources can not be assessed only in the interests of economy sectors and one cannot but take into account their role in preserving the regenerative forces of nature itself.
It appears that the regions’ water programs for the period to 2020 will be effective and real if they are based on the following:
-
1. The subordination of the individual water consumers’ interests to national interests. The following is consistent with this principle’s adherence:
-
1.1. Management decisions based on the Scheme of complex use and water bodies’ protection (SCUWBP). In 2009 the development of SCUWBP will be largely finalized for the Northern Dvina River. Plans must include systematic studies and the design on the state of water resources and their promising use on the basis of new approaches to the regulation of water usconsumption in the present conditions:
-
-
- minimize the impact on the water system in economic activities in order to maximize its preservation in its natural state;
-
- to ensure maximum regeneration or restoration to a natural state of contaminated depleted water bodies.
-
1.2. Compliance with the principles of river basin water management. On the territory of the Vologda region there are 4 river basin dis-
tricts: Dvina-Pechora, the Upper Volga, Baltic and Barents-White Sea. (River Basin District is the basic unit of governance in the use and protection of water bodies which consists of river basins and ground waters and seas associated with them. Basin Districts in Russia appeared in 2006 in connection with the adoption of the new Water Code. In accordance with Article 28 of Water Code there are twenty basin districts established in Russia.)
-
2. Use the best, least water consuming technologies in production processes, eliminating multiple losses of water in all phases of its use and waste of water consumption in household use, where the absence of water meters and low water tariffs for the population do not stimulate its economical consumption.
-
3. Establishing the limits of water consumption and definition of predictive indicators (volume of water consumption and water-drain) for enterprises with an orientation towards technical and economic parameters of production capacity and actual production, as well as on specific environmental indicators. As the standards for determining the limits of water use may be:
-
- water consumption of the gross regional product calculated by the volume of total water intake (water removal) and taking into account water losses;
-
- water consumption calculated as the ratio of recycled and reverse water consumption to the cost of GRP;
-
- drainage coefficient (the ratio of the wastewater volume to the cost of GRP).
-
4. Recovering of environment status of water bodies with the help of not only water conservation (water conservation and waterpurifying) technologies in enterprises, but also with the regional environmental protection technologies of various kinds: nature conservative, landscape, nature restoring.
-
5. The transition to the development of water quality standards for surface waters in certain groups of water bodies.
-
6. The introduction of innovative treatment technologies and disinfection of wastewater.
The article raised only a few problems of water industry. To develop specific regional water strategies and programs for their implementation a deeper and more extensive analysis of water consumption across industries is required.
References Water strategy of the Russian Federation and problems of water industry in the North-West federal district regions
- Data of the central statistical database of the Federal State Statistics Service . -Mode of access: http://www.gks.ru
- Natural resources and environment of the Vologda region. 1996 -2006: reference book. -Vologda, 2006. -40 p.
- On the status and use of water resources of Russia in 2007: State report -Moscow: NIA-Priroda, 2008. -408 p.
- Regions of Russia. Social and economic indicators: coll. of stat./Rosstat. -M., 2008. -435 p.
- Regions of the North-West federal district. Social and economic indicators: coll. of stat./Rosstat. -Vologda, 2008. -380 p.
- Report on the state and environmental protection of the Vologda region in 2007/The Government of the Vologda region, Vologda Department of Natural Resources and Environment. -Vologda, 2008. -234 p.
- Saveliev, V.Yu. Environmental Management/V.Yu. Saveliev. -M.: Logos, 2001. -265 p.
- Sorokin, N.D. Environmental protection at the enterprise/N.D. Sorokin. -St. Petersburg: Form T, 2004. -663 p.
- Water Code of the Russian Federation. RF Law № 74-FZ. With changes amended by Federal Law № 209 24.07.2009.
- Water strategy of the Russian Federation for the period until 2020. RF Government Order, August 27, 2009, № 1235-p.
