Web-enabled Simulated and Remote Control Virtual Laboratory of Transducer

Author: Vaibhav Gautam, Roop Pahuja
Journal: International Journal of Modern Education and Computer Science (IJMECS) @ijmecs
Article in issue: 4 vol.7, 2015.
Free access
In the era of Information and Communication Technology (ICT), virtual laboratories in the field of engineering and sciences have gained popularity, as a smart way of imparting practical and theoretical education. This paper discusses the realization of web-enabled simulated and remote control virtual laboratory of transducer based on one of the modular transducer kit/trainer commonly used in conducting experiments in Instrumentation and Control Engineering curriculum or related fields. Using component-based modeling methods, apparatus/devices used in a particular transducer experiment been have accurately modeled and assembled virtually. The virtual experiment panel mimics the functionality and physical appearance of the actual experimental set up. It provides various options to study and simulate the experiment by varying the input signal or device parameters. The remote control lab facility is also provided that enables the user to remotely perform the experiment on the kit. The experiment is interfaced to PC using suitable data acquisition system. Interactive virtual panel with web-cam connectivity is implemented and published on the web. It allows the user to control the set up and perform the experiment interactively; acquire and analyze real-time data and capture online view of the physical experimental setup remotely. The outcome of this work is the virtualization of transducer based experiments and development of integrated educational tool with high level of pedagogical effectiveness and technical support.
E-learning, Modeling and simulation Remote Labs, Transducer Labs, Virtualization of experiments, Virtual Labs
Short address: https://sciup.org/15014745
IDR: 15014745
Text of the scientific article Web-enabled Simulated and Remote Control Virtual Laboratory of Transducer
Published Online April 2015 in MECS DOI: 10.5815/ijmecs.2015.04.02
Laboratory courses with real experiments are the integral part of engineering curricula. It is necessary not only to develop skills but to attain in-depth practical comprehension of theoretical aspects. The use of Information and Communication Technology (ICT) with components such as PC, labtop, mobile phone, PC based data acquisition, web-enabled application software etc.
provide means to extend these experiences beyond the traditional classroom teaching and lab experimentation to distance-learning students. It enhances the conventional educational methods of blackboard teaching by the use of interactive e-learning tools and optimizes the use of resources. ICT in education has been established for improving memory retention, increasing motivation and deepens understanding [1].
Development of so called ‘virtual laboratory’ on PC is a as a smart way of imparting practical and theoretical education. A virtual lab is a virtual replication of the different experiments that provides a “feel” of performing the real experiment on a PC. Virtual experiment is designed and sequenced in such a manner as to give a real-feel of performing the actual experiment. The performer in this case doesn’t handle the actual experimental apparatus but its software imitation. An interactive graphical interface with the adequate pedagogical components [2] and a scientific approach create suitable virtual environments for performing experiment efficiently.
The concept of virtual lab arises as a result of several limitations of the conventional pattern of practical education in engineering. Traditional real labs in many of the technical institutes suffer from limitations such as:
-
(a) Low availability of resources in the labs.
-
(b) Lack of qualified faculty and other staff.
-
(c) Inefficient learning as most of the students don’t get to perform the experiment individually.
-
(d) Less flexibility due to laboratory schedule limitations.
But, with computer simulation and virtualization of labs, many of these limitations [3] can easily be covered up. Broadly speaking there are two types of virtual labs:
-
(a) Model-based simulated virtual lab: The
experiment of virtual lab is appropriately modeled using component based system modeling concept [4], programmed and simulated on PC. The model is designed to replicate the functionality and appearance of the experiment in real sense and is also made interactive for ease of user access.
-
(b) Remote control based virtual lab: Instead of simulation of experiment model, the user remotely performs the experiment on the kit through the virtual experiment panel available on the web on client PC. The server PC is interfaced to the experiment set up and the virtual panel that is designed to mimic the real system with all the functions to start and perform the experiment methodically, following the step by step procedure.
Both the labs are complementary to each other and offer unique advantages. As compared to simulated lab, remote control lab is difficult to be implemented and at times fully remote control lab could be costly development due to computer interfacing and manipulation of experimental setup [3]. Also, there is limitation of time sharing of the experimental equipment among multiple users. But, it provides advantage and versatility to the user to work on the actual apparatus and analyze the real time experimental results instead of simulated results. In some cases, because of the difficulty in replicating the complex and specific tasks with software simulation tools, it is useful and easy to develop remote control lab. In many scenarios, simulating the experiment is the first hand requirement as it allows the user to acquire the necessary skills that will then allow him/her to control the remote equipment in a safer way. Sometimes, combined use of remote control of real equipment with simulation models, a technique named as mixed-reality, is preferred to develop virtual labs [3].
The work in this paper discusses the development of web-enabled unique virtual laboratory of transducer based upon on of the commonly used transducer kit (DYNA-1750) from Dynalog (India) Ltd. Transducer lab is one of the important lab of Instrumentation and Control Engineering and related streams. It provides hands-on experience and practical knowledge to the use and study of different transducers available on experimental kits, its calibration, signal processing methods and sources of errors etc., for the reliable measurement of non-electrical real time signals. The transducer I/P-O/P experimental data as obtained from the apparatus is characterized and analyzed.
The virtual transducer lab, implemented on the platform of LabVIEW, provides access to both types of virtual experiments methods: simulated lab as well as remote control lab through virtual instruments that mimic the physical instrument or device. The simulated lab is based upon the mathematical models of physical components of the devices. It allows the user to perform experiment on different transducers under different conditions. In remote control lab, the experiment is done remotely in real-time on the experimental kit, interfaced to the PC-based data acquisition system (NI PCI 6221) and the user controls real apparatus through soft (virtual) panel published on the web.
Presently, in the first phase of development, this lab provides access to conduct experiments on five different transducers such as Photovoltaic cell, Photoconductive cell, LVDT, Slotted Opto transducer and Reflective Opto transducer on the web-enabled interface. The menu driven virtual instrument of the experiment allows the user to access the learning components: to know and understand the theory behind the experiment, apparatus and its specification, physical connection diagram, set various parameters and perform the experiment following step by step procedure. Results in different formats are indicated. Further, a provision is provided to log and analyze the results and draw the conclusion. Also, interactive dialog boxes and help documentation, guide the user to conduct the experiment successfully.
The virtual lab provides an insight and knowledge to the user on how the transducers work, their signal conditioning requirements, nature of characteristics and use of different methods (simulated or remote control) to perform experiments in virtual environments.
The rest of the paper is organized as follows: section II discusses the related work, section III discusses mathematical modeling of the experiment for simulation, section IV explains remote control of the experiment, section V explains the implementation of integrated software tool for virtual lab of transducer, section VI discusses the use of tool to perform experiments and results and the last section draws conclusion and highlights future scope.
-
II. Related Work
Advances in networking technologies and development of measurement hardware and software have turned PCs with internet capability, into a platform for continuous remote access and monitoring for virtual labs [8]. Looking into the pedagogical effectiveness of remote labs for distance education there is a need to develop full-fledged remote laboratory experiments and integrating these directly into engineering curricula. To design and develop such labs a step by step procedural mechanism should be followed with emphasis to include learning components, imitation of actual experiment apparatus, incorporation of easy navigation, testing of effectiveness of learning, and development of useful feedback mechanisms [2]. The concept of virtual instrumentation has been used to create virtual experimentation set ups [9] [10] that allow creation of interactive GUI, the ease of use for students, and the capability to add new measurements that were otherwise unaffordable.
Over the decade or so, many experimental simulation works focusing on discipline specific topics have appeared. Authors in [11] discussed the ability to control and monitor process from remote locations using PC based data acquisition systems. In reference [12] authors implemented virtual experiments in electronics using LabVIEW. The circuit under test was implemented on breadboard whereas signals applied to the circuit were generated through the program and measurement was made through data acquisition, analysis, presentation functions as performed by virtual instrument panel. Also, LabVIEW based virtual experimental platform of signal analysis and processing was designed with extensive set of functions to meet the needs of universities and research laboratories [13].
In reference [14] authors described a remote accessible lab infrastructure that enabled the users to conduct real experiments with an important and widely used transducer in industrial automation, named Linear Variable Differential Transformer (LVDT). In the reference [15] authors successfully illustrated and demonstrated a virtual laboratory featuring experiments on vibration. The response of an aluminum cantilever beam under harmonic excitation is simultaneously measured using different transducers: a strain gage, a linear variable differential transformer and an accelerometer, and compared with the real time theoretical response. All data acquisition and analysis was done using a custom built LabVIEW virtual instrument. This allowed the users to acquire, and analyze the seismographic vibration signals accurately and obtain a better perception of seismographic observation.
Authors in [16] realized virtual remote laboratory (LabWeb1451) for developing and testing electronic datasheets (TEDS.4) compliant with the standard IEEE1451.4 for plug and play sensors. It consisted of a set of software components implemented to support the development of a TEDS.4 database for resistive sensors and to experiment with new generation of sensors compliant with IEEE1451.4 standard. In reference [17] authors presented the pedagogical and technical challenges faced in developing a distributed laboratory for the execution of virtual scientific experiments (VSEs) superimposed on a grid infrastructure for a course on sensor networks. In one of the recent works [18], fluidics inspired model of virtual transducer was developed to enhance remote environment perception in telerobotic systems by adding proximity feel in pre-contact phase during remote manipulation tasks.
Also, in references [19] [20] authors discussed the use of recent information technologies web 3.0 and cloud system respectively, that would greatly enhance the development of online e-learning courses and virtual labs. These would help in making passive learner into active learner in the virtual learning process and would lower the cost of ownership and maintenance for the host organization.
-
III. Experiment Modeling
The virtual transducer lab experiments on transducer trainer (DYNA-1750) were designed by creating the soft-panel for each experimental setup based upon the component models. In this case, the experimental set up or physical connection diagram was implemented by connecting the virtual devices, presented as graphical icons, through wires. The underlying functionality of the virtual device was defined by the appropriate mathematical model that also allowed the user to set or define some of the parameters of the devices. The experiment was modeled using practical and theoretical modeling methods. The practical model is based upon the black-box modeling methods that best fit the relationship between the experimentally collected input and output data of the device/s, to a suitable curve under predefined parameters. The model is realistic in nature as it captures the real-time effects, errors, inaccuracies of the components etc. to define the output in terms of the input. On the other hand, in the case of theoretical model, each component is defined by the approximate output-input relationship based upon assumptions and known parameters. The experiment model was thus obtained by combining the models of all components. Starting from input to output, models of different components were integrated to present the processed output of the experiment in terms of the input and know parameters of the devices.
As an illustrative example, mathematical modeling of photoconductive cell experiment is explained in this section. The objective of the experiment is to draw the output voltage across LDR (light dependent resistor)/ photoconductive cell as a function as lamp filament voltage or power input of the device. LDR is a resistor, made of semiconductor material whose resistance depends on the intensity of the incident light and decreases non-linearly when the incident light is increased. Under no light conditions it has very high resistance known as dark resistance and as light intensity increases the resistance of the device decreases .
Fig. 1(a) shows the circuit diagram of LDR experiment on the DYNA kit. The experimental setup consists of LDR having cell resistance of 1MΩ (dark resistance), 400Ω (ambient light) and cell spectral peak response at 530 nm, a potential divide arrangement with 3KΩ fixed resistor connected in series with the LDR, DC power supplies of 12, 5V, a 10KΩ variable resistor potentiometer calibrated into ten divisions, a power amplifier to boost the current to drive the lamp, a 2W lamp whose light intensity depends upon the input power (or voltage) [21] [22]. LDR and lamp are placed in small glass housing on the kit and electrical connections for the same are placed outside. The experiment works on the principle that as the input excitation voltage is increased in steps, the power amplifier amplifies the input current and power input to filament lamp. This varies the intensity of the filament lamp in steps. The light intensity falls on LDR. As the input light intensity increases the resistance of LDR decreases and hence the output voltage [21][22].
The practical black-box model was obtained after performing the experiment on the kit. At the input, potentiometer setting was varied in steps that varied output voltage across LDR. The experiment data: input DC excitation voltage and output voltage across LDR were measured by multimeter connected at the input and output terminals on the circuit. Data was recorded and plotted. As shown in the graph Fig. 1(b), output voltage across LDR varied inversely and nonlinearly with the increase in input voltage to the filament. Further the data was curved fitted and approximate piece-wise polynomial model was obtained with accuracy within -4%, given by equation (1). This defines the relationship between the output voltage across LDR (VLDR in volts) and input excitation voltage to the filament lamp (in volts) for the given parameters.
simplified by substituting the values ^dark = 106 Ω and d=1cm [21] and is given by the equation (5).
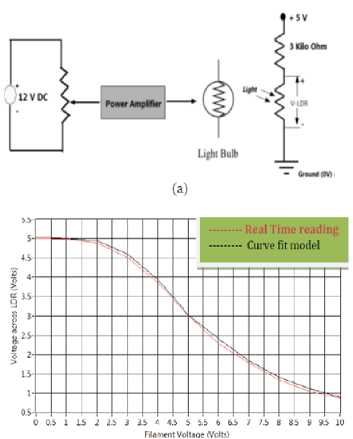
Fig.1. LDR-based experiment (a) Experimental set-up (b) O/P- I/P characteristic with curve fitted graph
p = ( ^Pjn ) -b
KLDR = ( )
V LDR = 5V for x <0.5 V
=5 . 1957 - (519.3741 × 10"3) X + (512.5188 ×
10~3)X2 - (206.3342 × 10-3)X3 + (26.028 ×
10"3)X4 - (333.7123 × 10 -6 )X5 - (144.0315 ×
10 -6 )X6+(7.3124×10 -6 )X7 for 0.5< x < 9.9
= 0.91V for x > 9 (1)
Rldr ( к Ω ) = 1000(8753.52187 Pin ) -b (5)
The theoretical model of the experiment was obtained by individually considering the models of each component and integrating them. Based upon physical laws that explain the working of the components, the output-input relationship of the component is approximated using linear /nonlinear equations. In the case of LDR [23], the effect of light intensity is seen as resistance variation in LDR, given by equation (2).
Pldr = (2)
The value of b (= 0.8) was calculated experimentally by measuring power input to filament in terms of filament voltage (V filament ) and current (I filament ) given by equation (6) and resistance of LDR in terms of voltage across LDR, given by equation (7).
Pin = Vfilament
Ifilament
Pldr
svldr
5- VLDR
Finally, output voltage across LDR (VLDR) in terms of input power to the filament is given as equation (8).
^ — 12 ∗ 1000 ( 8753 . 52187Pin ) -b
V LDR = (8753.52187Pin)-й +10
where,
RLDR=LDR resistance
R dark = Dark resistance of LDR
L = Light intensity at the surface of the LDR in Lux
B = a constant depending upon the material
L is calculated as the light intensity (in lumen) at a point assuming the light source is at the centre of a hypothetical sphere and the point is at its surface where ‘d’ is the radius of sphere and is given by the eq. (3).
where, P in is calculated in terms of output voltage of potentiometer (or input voltage to lamp filament) and amplified current output of power amplifier flowing through the filament, given by the equation (9). Output voltage of potentiometer depends upon output resistance of potentiometer that varies in step size of 1K Ω as potentiometer knob setting (z) in steps of one, varying in the range 1to10.
Light produced tn lumens 4nd2
p = in
12∗ ∗1∗ lump 10
As, 2W filament lamp emits 11 lumens per watt, the light emitted at a power Pin watt is 11Pin. Now, resistance of LDR in terms of Pin, given by the equation (4) is further where, Iamp (mA) is the current output of the amplifier and is related to current input to the amplifier y (µA) given by the curve-fit model, equation (10).
Iamp = 0.6 + 9.4819 у - (742.1273 × 10~3)у2 + (35.4844 × 10"3)у3 - (967.4139 × 10 -6 )у4 + (15.5559 × 10 -6 )у5 - (146.0132 × 10⁻⁹)у6 +
(739.1391 × 10 -12 )у7 - (1.5572 X 10 -12 )у8 (10)
Equation (8) is effectively used to graph LDR characteristics, output voltage Vs filament excitation voltage or power input. The model was validated by comparing the result with the experimental results. Based upon the models, computer simulation program with a user interface was implemented and discussed in section V.
-
IV. Remote Control Experiment
Remote control lab facility allows the user to perform the experiment remotely in real-time. Fig. 2 shows the schematics of remote control transducer lab. The experimental transducer setup was interfaced to server/ PC using PCI based multifunctional data acquisition system (NI 6221). Virtual lab program running on server provided an excellent facility of controlling the hardware and acquiring the data online [24].Web-cam was also interfaced to the server that provided the view the actual experiment setup and lab environment [25]. Further, virtual lab panel on server was web-enabled and embedded as web-page for remote access by client PC through internet [26]. This allowed the remote user to perform the experiment online.
As an illustrative example, implementation of remote control of LDR experiment is explained in this section. Fig.3 (a) shows the schematics of remote control of LDR experiment. Input excitation variable voltage and output voltage across LDR in the experiment were interfaced to analog output and input channels of NI PCI-6221 DAQ card respectively [24]. The virtual experiment panel was implemented (Fig. 3(b)) that allowed the user to switch ON/OFF the apparatus and perform the experiment. I/P excitation signal to the power amplifier was varied in steps of one volt through the soft dial knob. The generated voltage at the analog output port of the DAQ system, connected to the input of the power amplifier on the DYNA trainer, provided the variable input power to the lamp filament. This varied the intensity of light falling on LDR. As the light intensity varied, the resistance of LDR varied and hence the LDR output voltage changed in steps. The output voltage of LDR, interfaced to analog input channel was acquired through DAQ and read on the panel. Also, the graph between the input excitation voltage to filament and output voltage of LDR was indicated as soon as the data was acquired. The course of the experiment was made visible to the user through a USB web-cam that indicated the connections of the experiment on the transducer trainer. The remote control experiment procedure was validated by comparing the results obtained with manual readings on the kit and was found satisfactory.
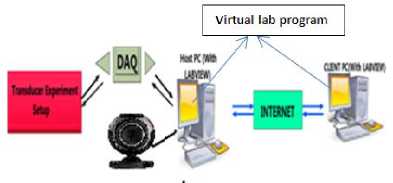
Fig.2. Schematics of remote control Transducer Lab
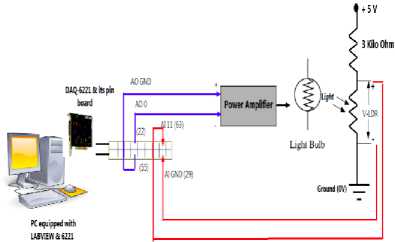
Fig.3(a). Schematics of remote control LDR experiment
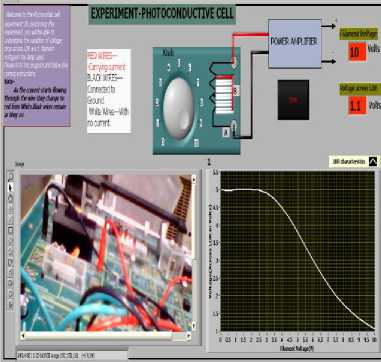
Fig.3(b). Virtual Front Panel of remote Control LDR experiment
-
V. Tool Implementation
The integrated software tool for virtual laboratory of transducer was implemented on platform of graphical system design environment of NI-LabVIEW. LabVIEW program is popularly known as virtual instrument (VI) [26]. It has two windows: front panel and block diagram. Front panel is the user interface of the program that allows the user to feed data inputs through variety of controls and visualize the results or output on simple or graphical indicators. Block diagram window contains the program code. It is logically assembled by linking the various input functional blocks to execute the algorithm that defines the functionality of the program. A VI, in general, is designed and customized as per the user needs and application requirements.
Hierarchical and modular in design, the tool provides options to conduct different transducer experiments under simulation or in real-time with remote control facility. The VI (virtual instrument) tool is embedded as web page and is accessed through the URL by client PC equipped with reliable internet connection, web browser application and compatible LABVIEW runtime engine.
Fig. 4 shows the main panel of the virtual lab of transducer that is remotely opened on the web-browser using the associated address. It provides the user the option to select: Virtual (simulated) Lab or Remote Control Lab. At the click of the particular button associated with the lab, corresponding lab panel, Fig. 5 (a) or Fig. 5(b) opens that allows the user to select the transducer based experiments. Each experiment is implemented as a virtual instrument with intuitive-interactive graphical user interface and block diagram code. The virtual instrument panel allows the user to conduct the experiment. It has a tabbed menu that provides information with well documented help on different phases of conducting the experiment. It provides options to see and study description of the transducer, view experiment procedure, see experiment setup, simulate the experiment using theoretical or practical models, obtain results and data analysis.
-
VI. Results
The virtual transducer lab tool was used to perform the transducer experiments. This section discusses the virtual experiment panel and results of some of the simulated and remote control transducer experiments. Experiment corresponding to particular transducer was selected through the main panel (Fig. 5) by clicking on the associated ‘Go for it’ button. As soon as the transducer button was clicked, corresponding virtual experiment panel opened that allowed the user to perform the experiment interactively.
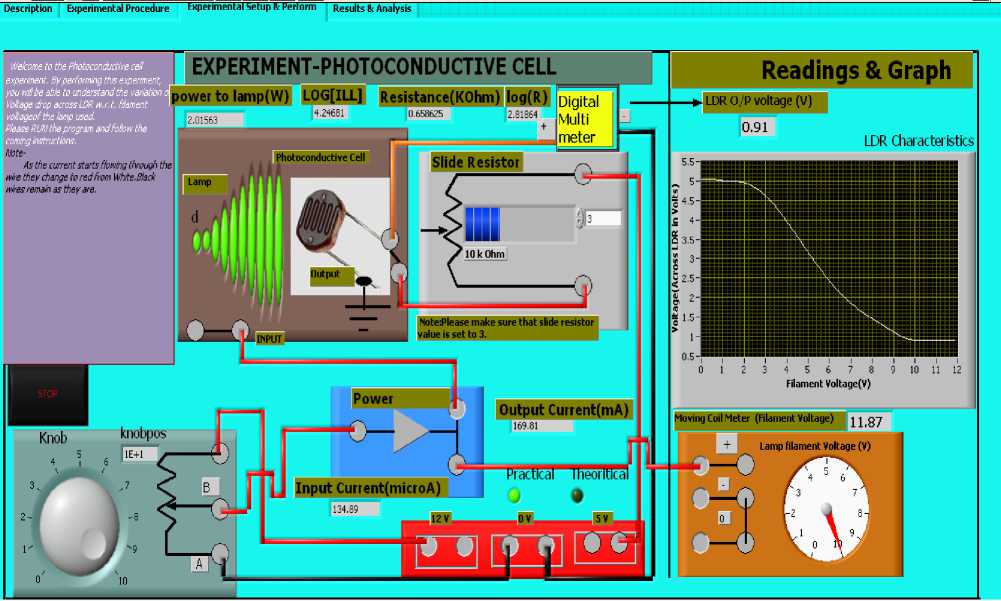
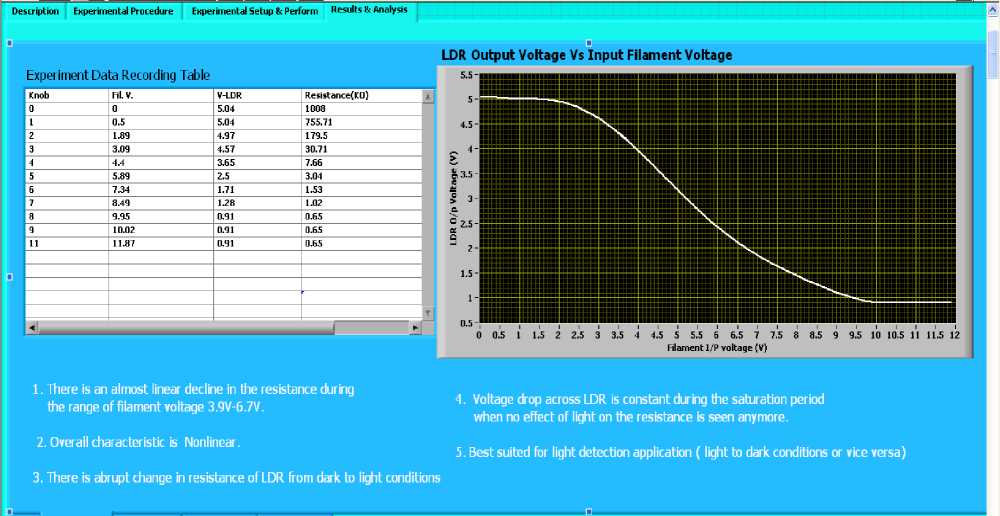
Fig. 6(a) shows GUI of the experimental set up of LDR experiment that allowed the user to simulate and perform the experiment on the panel. The aim of the experiment was to vary the resistance of LDR and hence the output voltage by varying the intensity of the light falling on it, and draw O/P-I/P characteristics of LDR. Based upon the actual experimental set up on transducer kit (Fig. 1 (a)) and model as explained in section III, the virtual experiment panel was implemented. It mimics the panel of the actual experimental setup with the same set of apparatus, control and indicators. The whole procedure of performing the experiment was made interactive that provided the good learning experience. At the start, as soon as the panel was opened, dialog boxes appeared that guided the user how to do initial settings and perform the experiment. Also, in the end the message about the status of the experiment (whether the experiment was successfully done or not) was also highlighted. The experiment was conducted by varying the input potentiometer knob setting by the step size of 1. This varied the input voltage to the power amplifier that amplified the current and hence varied the power input to filament of the lamp, acting as the light source. As soon as the power input to the lamp filament varied, the light intensity also varied. The variation in the light intensity falling on LDR varied its resistance nonlinearly. Since the
LDR was a part of potential divider circuit, the output voltage across LDR varied. As the experiment was performed, output and input data to various functional blocks were updated on the respective meters. At the end of the experiment the state of the panel indicated the last value of the data. Potentiometer knob was at the last setting (10). Corresponding to the potentiometer setting, the filament voltage indicated on the gauge was 11.87V and output voltage of LDR was 0.91V. At the end of the experiment, the graph of LDR characteristics in terms of output voltage Vs input filament voltage was plotted. Further, tabulation chart, graph and analysis of results were indicated on ‘result and analysis’ panel selected through tab menu (Fig. 6(b)).
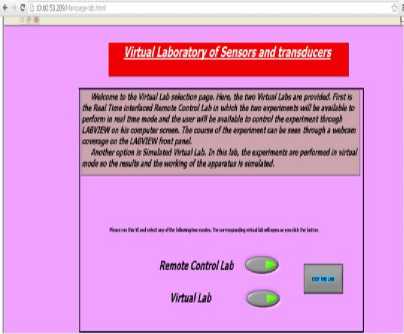
Fig.4. Main panel of Virtual Lab of Transducers opened in the Google Chrome browser
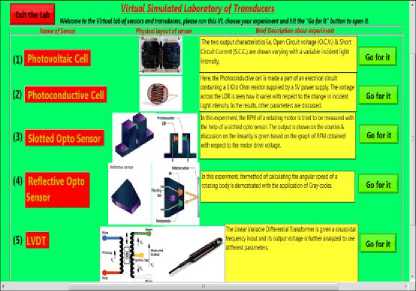
Fig.5(a). Main panel of Virtual Simulated Lab with options to select a particular transducer experiment
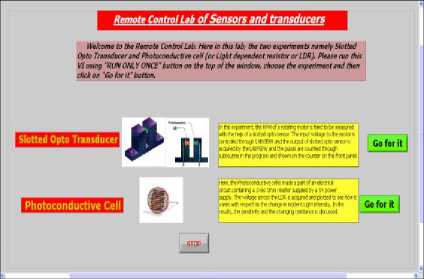
Fig.5(b). Main panel of Remote Control Transducer Lab with options to select a particular transducer experiment
(a)
(b)
Fig. 6 (a) Virtual experiment panel to simulate the characteristic of LDR (b) Panel showing results and analysis
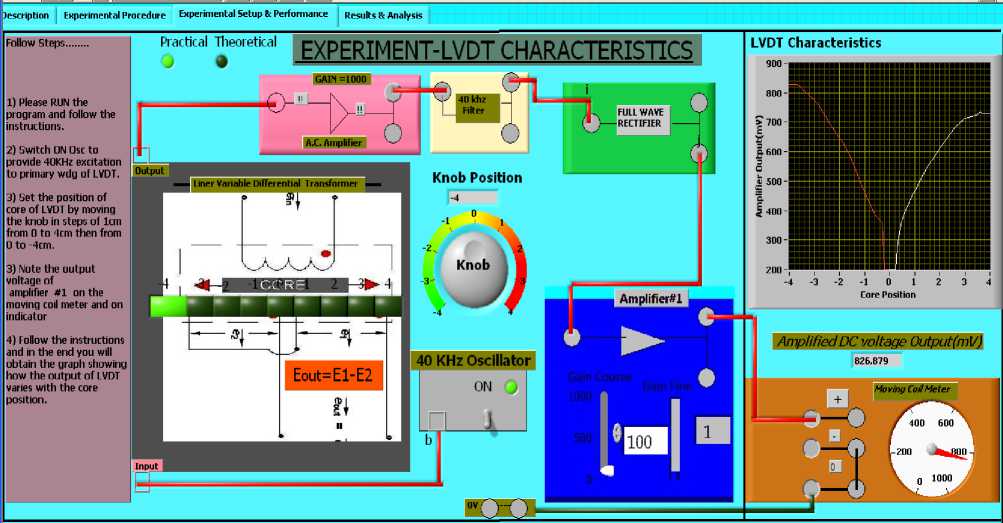
Fig. 7(a) shows GUI of the experimental set up of LVDT to measure linear displacement and draw the characteristic between input displacement and DC output voltage. It has various tab control to study the experiment details such as theoretical description about the working of the experiment and procedure to conduct the experiment. The virtual experiment panel was implemented based upon the models of various components used on transducer kit [21] [22]. The virtual experiment panel replicates the actual physical set up. It consists of LVDT, the primary winding is excited by 40 kHz sinusoidal signal from oscillator and two secondary windings are connected in series opposition. The core of LVDT is given linear displacement in both the direction. Based upon the position of the core, due to the flux linkages between primary and two secondary windings (transformer action) of LVDT, the net emf at the output is generated. When the core is at the center and symmetrically placed wrt the secondary windings then output voltage is ideally zero. With the displacement of the core, the output voltage changes. The frequency of the output voltage is same as input excitation but amplitude varies in accordance with the displacement of the core, hence the output is LVDT is amplitude modulated (AM) signal. The AC voltage is amplified by AC amplifier, and demodulated using low pass filter at 40 kHz and full wave rectifier. The DC voltage of LVDT is amplified using amplifier with gain of 100. The amplified output voltage is read on the meter [22].
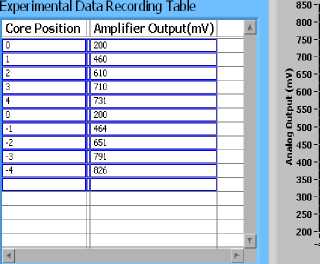
The experiment was conducted following the instructions highlighted on the panel. The LVDT core was moved in both the directions from 0 to 4cm and then from -0 to 4cm by moving the control knob in steps of 1cm. At each increment of input displacement, the amplified output voltage was read on the moving coil meter. As soon as the experiment was completed the message indicating the status of conducting the experiment was prompted. Thereafter, the graph of the LVDT core displacement Vs output DC voltage was indicated. Also, the results obtained were tabulated and analyzed graphically (Fig.7 (b)) to conclude about the salient performance specifications such as sensitivity, range, nonlinearity error.
(a)
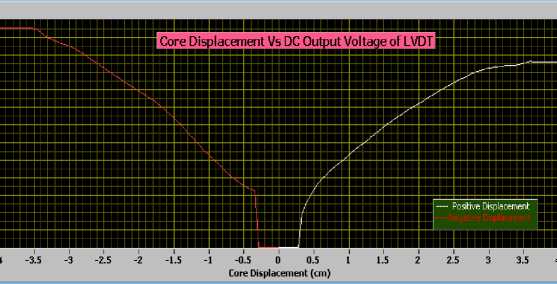
As evident from the graph, the O/P-I/P relationship deviates from ideal linear relationship during the core displacement over the entirerange (-4 to 4cm)
Sensitivity is 13.5mV/mm during the linear range (l-2cm).
The NULL Voltage is 15mV
Based on the Least Square method, the deviation from linearity is found to be 13mV.
(b)
Fig.7 (a) Virtual experimental setup to simulate the characteristic of LVDT (b) Panel showing results and analysis
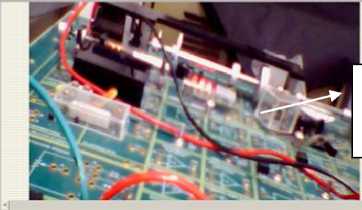
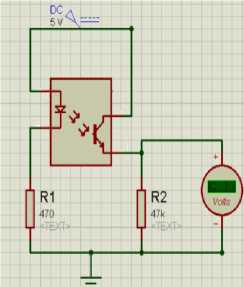
Fig.8 (a) shows the remote panel of the experiment on slotted-opto sensor for angular speed measurement. The aim of the experiment is to measure the angular speed of motor shaft using slotted opto sensor with the pair to infrared LED – silicon phototransistor. The experimental set up on the transducer trainer consists of the motor shaft assembly connected to a disc with a slot that moves within the gap of infrared LED and phototransistor (slotted opto sensor) [21]. The motor is given variable DC voltage (0-10V) through potentiometer and power amplifier that varies its speed. As the motor shaft rotates, the slot moves with the same speed. When the slot comes in between the light beam and sensor, light beam is admitted to phototransistor, it conducts and collector current rises. This increases the voltage across the resistor of the emitter circuit of phototransistor. Fig.8 (b) shows the biasing circuit of LED and phototransistor [22].On the other hand, when the opaque section of the disc comes within the slot, the infrared light beam falling on phototransistor is broken and output voltage decreases to zero. Hence, a series of positive pulses are generated by phototransistor when the disc moves. The frequency of the output pulses generated is the function of speed of motor. The pulses are counted in the time interval by the counter that is calibrated to display speed of motor in rpm.
For remote control operation, the experimental set up on the transducer trainer was interfaced to NI-6221 DAQ board in the similar way as described in section IV along with the web-cam. The voltage available at the analog output channel of the NI-6221 DAQ [24] was connected to power amplifier that drives the motor. The output voltage of the phototransistor was connected to the input channel to read and count the pulses to display speed in rpm. The virtual panel of the experiment was implemented that provided the functions to remotely control and perform the experiment on the kit.
To perform the experiment on the remote panel, the instruction highlighted on the panel were followed. The excitation voltage to power amplifier was slowly varied in steps through the knob. This varied the speed of the motor and hence the frequency of output voltage pulses of the sensor. At each setting, the excitation voltage was kept constant for 60s during the time the clock was ticking. The instantaneous output voltage of slotted opto sensor was acquired and displayed. The voltage pulses (> 4.0V) obtained during 60s (or 1min) were counted and displayed as speed in rpm. Hence, corresponding to the excitation voltage value the speed of motor was indicated. Information on the panel depicted the state of the motor at that time instant. As indicated, motor, excited with DC voltage of 5V, was revolving with speed of 55rpm. Webcam projected the online view of the experiment capturing the movement of the disc continuously.

Experiment: Slotted Opto Transducer (Remote Control)
Voltage to the Power Amplifier (Volts)
tote: When the dart п tihiq.pbwdont tit thrill» button « change the aotor Awe output wit ay at the meaiuremwit of 4**d И be done tor corMp 60 won* at
Start at End at
Counts 55
CLOCK
0.012
12:32:00 PM
Note: ftyti et wet «d fwv pier denote won* and thru# M hirdwh «id thoia«wh pUe denote *XX«. ftf St#twv« 2245 w«» ■ •• 22
Instataneous Output Voltage of Slotted Opto Transducer
Motor disc moving within slotted opto sensor on the kit
(a)
Fig. 8 (a) Remote control panel for measuring speed of motor using slotted opto sensor (b) Circuit schematics of slotted opto sensor
Ж the 5ГОР button ehm the exptrwnt n ro**!» Motor Input Voltdge(V)
(b)
-
VII. Conclusion
Virtual laboratories are the modern tools of teaching in engineering field. They provide an added and unmatchable advantage of being remotely accessible through internet. With improved design and simulation, they can always be made better and better. The presented work has proposed efficient approach of creating remotely accessible virtual lab of transducers so that transducers concepts can easily to studied and learnt along with experimentation.
The developed virtual transducer lab provides access to five simulated and remote control experiments through interactive user interfaces covering all aspects of experimentation namely theory, procedure, imitation of experiment apparatus and setup, performing experiment online display of results and analysis. The lab works satisfactorily well producing justified results of experiments. The remote control experiments perform well through the discussed methodology. The online visual monitoring facility based upon virtual instrumentation has turned out to be a key feature of this lab as it provides an easy medium to the user to perform experiment in real-time remotely. It allows the user to vary the input of the experimental set up through remote PC, acquire the result in real-time and view the apparatus where the experiment is being performed through the web-cam.
To conclude in short, this lab tool was implemented on platform of LabVIEW keeping in view the high level of technical support and pedagogical effectiveness. The tool is easy to learn, use, informative and reliable. It is an effort towards the virtualization of real experiments on transducer kits and simulating them effectively using suitable component models or conducting them remotely. Also, with internet connectivity, the tool is easily reachable to a majority of aspirants of learning transducers’ concepts, especially the students registered in the course.
Based upon the work that presents a proof of concept of creating a unique virtual lab of transducer, it is ascertained that on similar lines more experiments on different transducers under simulation and remote control can be added in the tool to improve its utility and versatility. In the case of simulation, many other features may be added such as actual sound of devices (like motor), virtual light and motion effects and voice instructions messages so that the GUI can become more realistic, attractive and interactive. Also, to increase the effectiveness and efficiency of the tool, automatic evaluated quiz tests, short answer questions and feedback mechanism can be made part of the tool. This will help the user to test his knowledge and suggest ways to improve the tool.
References Web-enabled Simulated and Remote Control Virtual Laboratory of Transducer
- P. Forcheri and M.T. Molfino, ICT as a tool for learning to learn. In Watson, D. M. and Downes, T. (Eds.) Cmmunications and Networking in Education. Boston, MA: Kluwer Academic. pp 175-184, 2000.
- Gadzhanov, S. & Nafalski, A. "Pedagogical effectiveness of remote laboratories for measurement and control", World Transactions on Engineering and Technology Education, vol 8, no.2, 162-167, 2010.
- R. Tiwari and K. Singh, "Virtualization of engineering discipline experiments for an internet-based remote laboratory", Australian Journal of Education Technology, vol. 27, No. 4, pp. 671-692, 2011.
- H. K.P Neubert, Instrument Transducer: An Introduction to their Performance and Design, 2nd ed., Oxford Uni. Press, 2000.
- Dynamical Systems Laboratory of Stevens Institute of Technology [http:\\www.stevens.edu].
- Distance Learning Remote Laboratories using LABVIEW. [www.ni.com].
- Virtual Labs (undated). An Initiative of Ministry of Human Resource Development, Government of India. Under the National Mission on Education through ICT. http://www.vlab.co.in.
- T. Fountain and R. Wright, "Internet enabled measurements," Dedicated Systems Magazine, 2000.
- A.B. Buckman, "VI-based introductory electrical engineering laboratory course," International Journal of Engineering Education, vol.16, no. 3, pp. 212-217, 2000.
- Z. Nermina, L. Samir and D. Pelkovice, "Virtual Instruments - A Chance to teach engineering at a distance", International Conference on Engineering Education, Oslo, Norway, August 6-10, 2001.
- Bachnak R., Steidley C and Resendez, K. "Virtual experiment in data acquisition, display, and monitoring", In Proceedings of the 2003 ASEE Gulf-Southwest Annual Conference, University of Texas at Arlington, American Society for Engineering Education, 2003.
- Y. B. Gandole, "Virtual instrumentation as an effective enhancement to laboratory experiment" International Journal of Computer Science and Information Technologies, vol. 2, no.6, pp. 2728-2733, 2011
- Xu Yang, Shujiao Ji, Lu Song, "Signal analysis and processing platform based on LabVIEW" Sensors & Transducers, vol. 172, issue 6, pp. 165-171, June 2014.
- R. J. Costa and G. R. Alves, "Experimenting through the web a linear variable differential transformer," I. J of Online Engineering, pp.1-7, 2006.
- B.M. Gurumurthy, S.R. Harisha, R.P. Subramanya, and K.V.Gangadharan, "Design of virtual instrumentation approach for a multi-purpose online mechanical vibration experiment using Labview," IOSR Journal of Mechanical and Civil Engineering, pp. 68-71, 2014.
- N. Ulivieri, N and S. Rocchi, S "Labweb 1451: Remotely accessible virtual laboratory for transducer electronic data sheets creation and testing", Instrumentation and Measurement Technology Conference, Sorrento, Italy, April 24-27, 2006.
- I. T Christou, S. Efremidis T. Tiropani, A. Kalis, "Grid-Based Virtual Laboratory Experiments for a Graduate Course on Sensor Networks," IEEE Transactions on Education, vol. 50, no. 1, pp. 17-26, 2007.
- J. K. Mukherjee, "Intelligent Transduction for response synthesis in telemanipulation," I.J. on Smart Sensing and Intelligent Systems, vol. 6, no. 4, pp. 1479-1498, Sept 2013.
- M. Dominic, S. Francis, A. Pilomenraj, "E-Learning in Web 3.0", I.J. Modern Education and Computer Science, vol. 2, pp. 8-14, 2014.
- L. Senthilkumar, "Teaching programming courses online using cloud system: Practices and future challenges," I.J. Modern Education and Computer Science, vol.12, pp. 14-19, 2014.
- Dynalog (India) Ltd. DYNA-1750 Transducer and Instrumentation Trainer Curriculum Manual IT01
- Dynalog (India) Ltd. DYNA-1750 Transducer and Instrumentation Trainer Technical Manual IT01.
- RS Components, Photoconductive Cell Specifications and Data Sheet.
- National Instrument, LabVIEW Measurement Manual
- National Instruments, NI-IMAQ for USB cameras: User guide.
- G. W. Johnson, LabVIEW Graphical Programming- Practical Application in Instrumentation and Control. Tata McGraw-Hill, 2001.
