Web Video Object Mining: Expectation Maximization and Density Based Clustering of Web Video Metadata Objects

Автор: Siddu P. Algur, Prashant Bhat
Журнал: International Journal of Information Engineering and Electronic Business(IJIEEB) @ijieeb
Статья в выпуске: 1 vol.8, 2016 года.
Бесплатный доступ
Nowadays YouTube becoming most popular video sharing website, and is established in 2005. The YouTube official website is providing different categories videos including Science and Technology, Films and Animation, News and politics, Movies, Comedy, Sports, Music etc. Each video hosted in website such as YouTube have its own identity and features. The identity and features of each video can be described by web video metadata objects such as- URL of each video, category, length of the video, rating information, view counts, comment information, key words etc. Using extracted web video metadata objects, we present an in-depth and systematic clustering study on the metadata objects of YouTube videos using Expectation Maximization (EM) and Density Based (DB) clustering approach. Distinct web video metadata object clusters are formed based on different category of web videos. The resultant clusters are analyzed in depth as a step in the KDD process.
Web Videos, Clustering, Metadata, EM Clustering, Density Based Clustering, Web Video Metadata Objects
Короткий адрес: https://sciup.org/15013397
IDR: 15013397
Текст научной статьи Web Video Object Mining: Expectation Maximization and Density Based Clustering of Web Video Metadata Objects
Published Online January 2016 in MECS
The amount of video content on the Internet has amplified dramatically in the recent years. New generation of high speed Internet connectivity, ubiquitous use of smart phone devices, and the popularity of video websites such as YouTube, Yahoo Screen etc, are being contribute to the rapid increase of video content over the Internet [1]. According to the surprising statistic of the YouTube [2], the web videos can be considered as ‘Big Data’. YouTube is one of the most popular and largest video sharing website (with social networking features) on the Internet [3][4]. According to official declaration by the YouTube authority [2], it has more than 1 billion users. Every day, people are spending hundreds of millions of hours on YouTube videos. More than 300 hours of video are uploaded to YouTube every minute, and also YouTube is available in 75 countries with 61 languages. Approximately 300 hours of video are uploaded to YouTube every minute [2]. This statistics shows that, how YouTube is popular day by day in a rapid increasing way. Hence, the social media researchers’ are attracting towards YouTube video which contains huge unstructured complex data.
Obviously, The domain ‘Big Data’ is recognized as -emerging, interesting and challenging research area due to its complex and unstructured nature.
In this work is continuation of our previous works [5][6] to discover knowledge from web videos using metadata objects such as ‘Category’, ‘Length’, ‘Number of Comments’, ‘View counts’, ‘Number of rates’, and ‘Rating’. Using such web video metadata objects, we made an attempt to form unsupervised clusters to discover knowledge from web videos.
The three main contributions of our work are as follows:
-
• Given a large collection of web video metadata objects dataset with ‘Category’ as nominal and remaining metadata object values are numeric, we train ‘Category’ based unsupervised clustering model using EM and DB clustering methods.
-
• The trained/built unsupervised clustering models using EM and DB are tested for large collection of web video metadata object dataset.
-
• The resultant unsupervised clusters of EM and DB are analyzed in depth to discover knowledge from web videos.
Many clustering models/algorithms and data mining machine learning tools are developed in recent years. Using different data mining algorithms and machine learning tools, it is possible to clustering the web videos based on their features/metadata objects.
The rest of the paper is organized as follows: The section 2 represents related works on the clustering of web videos, section 3 represents proposed web video clustering methodology, section 4 represents performance evaluation analysis of cluster models and comparison of efficiency of cluster models, and finally section 5 represents conclusion and future enhancements.
-
II. Related Works
This section represents some related previous works which are implemented to cluster web videos using metadata objects.
In accordance with clustering of web videos, the authors C.F-Hsu, James C., and E. Khabiri [3] proposed by means of comment term normalization and key term extraction via KL-Divergence for distilling noisy comments. The authors [3] also developed an incremental insertion component for updating the comments-based hierarchy. The advantage of this technique is- resources can be efficiently placed in the hierarchy. This is because, comments arise and without the need to re-generate (potentially) the expensive hierarchy. The experimental study over YouTube provides proof that the proposed approach can lead to comments-based video management in social video sharing websites such as YouTube-like environment.
The authors Siddu P. Algur, Prashant Bhat and Suraj Jain [5], worked on implication of web video descriptive metadata and presented a useful and proficient method for construction and extraction of web video descriptive metadata. The presented method recognized the effectiveness of constructing the descriptive metadata with timeline for some domain specific web videos. The work of [5] also recommended the construction of event specific and objects specific metadata and which are considered to be very useful. With the proposed descriptive metadata model, users may process the video contents effectively and efficiently.
Xu Cheng, Cameron Dale, and Jiangchuan Liu [7] proposed a detailed analysis of the characteristics of YouTube, which is known to be most popular Internet short video sharing website. Through investigating the massive amounts of data collected in a 3-month period, the authors [7] verified that, while sharing certain similar features with traditional video repositories, YouTube reveals many exclusive characteristics, particularly in access pattern, length distribution, and growth trend. Such traits establish new challenges and opportunities for optimizing the performance of small video sharing services. The authors [7] also examined the social network among YouTube videos, which has most unique and interesting characteristics, and is substantially contributed to the achievement/success of new generation of service. Also the authors [7] found that the systems of interrelated videos, which are selected based on usergenerated content, have both small-world uniqueness of a short characteristic path length linking any two videos, and a large clustering coefficient indicating the grouping of videos. These uniqueness can be exposed to assist the design of novel caching or peer-to-peer approach for short video sharing.
The experimental results of C. Ramachandran, R.Malik, Xin Jin and Jing Gao [8] showed that the Video- Mule has a good accuracy, precision and recall than individual classifiers and clustering algorithms. Also in future the authors [8] have strategy to expand the evaluation process with data from other video-sharing websites using VideoMule.
The authors Alex Hindle, Jie Shao Dan Lin, Jiaheng Lu and Rui Zhang [9] developed a web video search system which has extra post-processing functionality of clustering results. This facilitates users to recognize their preferred videos more suitably. The planned information integration framework of [9] is- first attempt to examine the fusion of the diverged information from different sources for clustering. The major infrastructure of the proposed system is completed and is readily extendible to integrate and check other video clip and text comparison algorithms, as well as clustering algorithms, which may be further look up the quality of clustering.
The authors [10] defined a method to produce Visual Affinity Graphs, revealing dissimilar kinds of visual associations between elements in the network. Approximately 38,000 videos, comprising over 2,800 hours, were taken from the website and analyzed. The resultant visual affinity graphs showed considerable quantities of noise/redundancy in the set, with over a third of the results were visually linked to others. The experiments of classification and clustering showed that the supplementary information obtained by automatic tagging can considerably improve the automatic structuring and organization of content; The primary user assessment point outs an information gain for viewers of the videos.
The authors Gloria Chatzopoulou, Cheng Sheng, Michalis Faloutsos [11] analyzed attractiveness in an all-inclusive fashion by searching properties and patterns in time and considering different popularity metrics. The authors [11] further studied the relationship of the popularity metrics and found that four metadata are highly correlated -view count, comments, ratings and favorites while the fifth one, the average rating, and reveals very little correlation with the other metrics. The [11] also found “magic number” in the average behavior of videos- for every 400 times a video is viewed, the authors have one of each of the following user actions- writing a comment, rating the video and adding to one’s favorite set.
-
III. Proposed Methodology
This section presents novel methodology of the proposed work. The metadata objects of online videos are extracted using Info Extractor tool [12]. This metadata includes uploader information, category, comments, ratings, length of the video, descriptions about content of the video etc. We propose a novel and effective methodology to cluster large scale web videos using metadata objects such as length, view counts, number of comments and rating information by applying data mining techniques. For experimental purpose, out of the total metadata object dataset, 60% are used for training and remaining 40% are used for testing the cluster model built using Expectation Maximization and Density Based clustering methods. The cluster results of each considered metadata objects are analyzed in depth. The system model of the proposed technique is represented in Fig. 1, and it consists of the following components:
-
A) Web video metadata object extraction
-
B) Web video metadata object refinement
-
C) Cluster models
-
D) Resultant cluster analysis
-
A) . Web Video Metadata object Extraction
The different kind of web video metadata objects are extracted using a tool called InfoExtractor [12]. The extracted web video metadata objects include- length, rating information, category, etc. The web video metadata objects are then stored in a disk [13] with CSV or ARFF file format for experimental purpose.
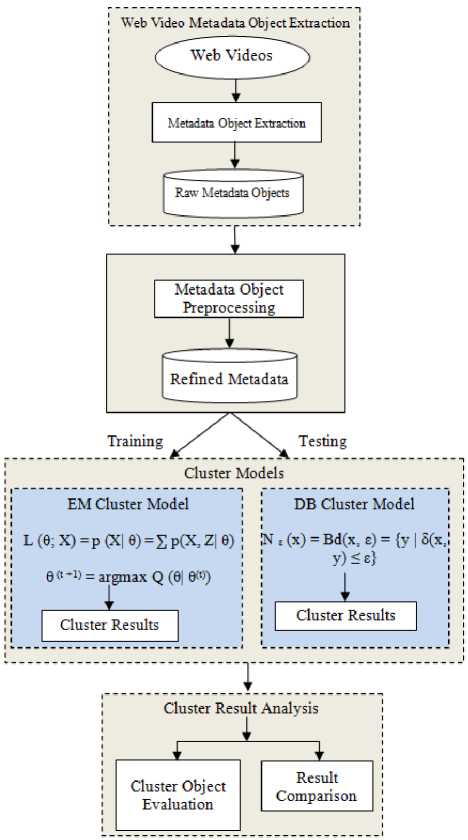
Fig.1. System Model of the Proposed Methodology
-
B) . Metadata Refinement
The input to this component is raw metadata objects extracted from the web videos. This raw metadata objects has to be preprocessed for the refinement such as file format conversion and to recognize the irrelevant metadata objects for the clustering experiment. The WEKA tool is used for file preprocessing and to build cluster models. The extracted raw metadata objects are converted to ARFF or CSV format from the text format to form effective clusters. Some web videos might have less metadata objects information, whereas some web videos might have more metadata objects information [14]. Through interpretation, it is found that, all web videos contains minimum metadata object information such as- length, view counts, ratings, average ratings and number of comments, author information and URL. Among these minimum metadata object information of web videos, only the numeric and nominal metadata objects -length, view counts, ratings, average ratings, category and number of comments are considered for clustering experiment and structure of the dataset considered is represented in Table 1 [14].
Table 1. Structure of Web Video Metadata Dataset
|
Category |
Length |
Views |
Rate |
Ratings |
Comments |
|
People & Blogs |
217 |
1157 |
3.6 |
5 |
3 |
|
Comedy |
426 |
667 |
4 |
4 |
4 |
|
Entertainment |
237 |
1063 |
4.8 |
30 |
10 |
|
Sports |
294 |
274 |
1 |
1 |
2 |
|
…….. |
…… |
…… |
…… |
……. |
….. |
|
…….. |
…… |
…… |
…… |
……. |
….. |
The missing values are replaced by mean of each numeric metadata object and the missing values of the metadata object ‘category’ are replaced by most repeated values.
-
C) . Building the cluster models
Two clustering models are used in the proposed method.
-
i) Expectation Maximization cluster model
-
ii) Density Based cluster model.
The functionality of each cluster model is discussed as follows.
-
• Building the Expectation Maximization cluster model
Expectation Maximization clustering approach is an iterative process [15]. It begins with a primary parameter presumption. Expectation Maximization (abbreviated as ‘EM’) clustering algorithm assigns a probability distribution to each web video metadata object which indicates the probability of it belonging to each of the clusters. The EM algorithm can decide how many clusters to generate by cross validation method. In this experiment, the training set is split randomly into 10 folds.
The cross validation performed to determine the numbers of clusters generated is according to the following steps:
-
1. By default, the number of clusters is set to 1.
-
2. The training set is split randomly into 10 folds.
-
3. EM is performed 10 times using the 10.
-
4. The log likelihood is averaged over all 10 results.
-
5. If log likelihood is increased the number of clusters by 1 then the program continues at step 2.
The number of folds is fixed to 10, as long as the number of instances in the training set is not smaller 10. If this is the case the number of folds is set equal to the number of instances.
The parameter values of web video metadata objects are used to compute the likelihood of the current model. This is known as ‘ Expectation Step’ . Given a statistical model which generates a set ‘X’ of observed data, a set of unobserved latent data or missing values ‘Z’, and a vector of unknown parameters ‘ θ ’, along with a likelihood function,
L (6, X, Z) = p(X: Z| 6)
Then the maximum likelihood estimate (MLE) of the unknown parameters is determined by the marginal likelihood of the observed data
L(6:X) = p(X|9) = 2p(XZ|6) z
Under the current estimate of the parameters θ (t) , the Expectation Step’ can be calculated by
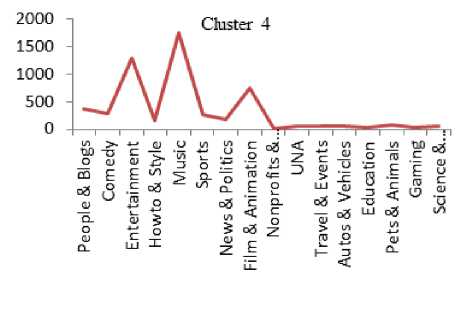
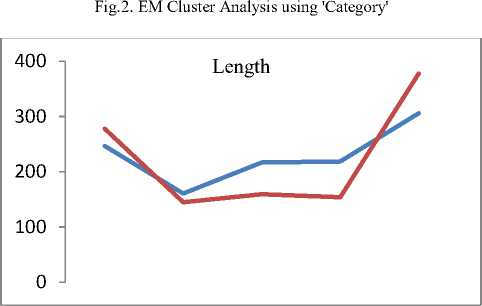
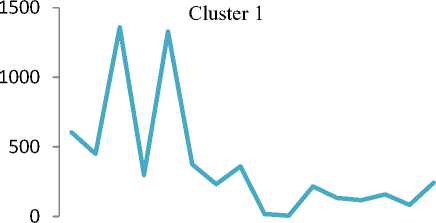
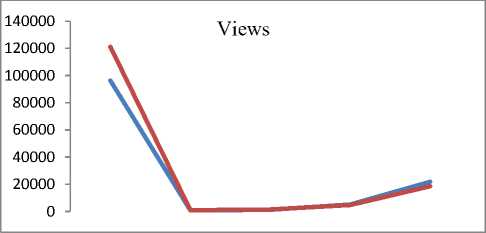
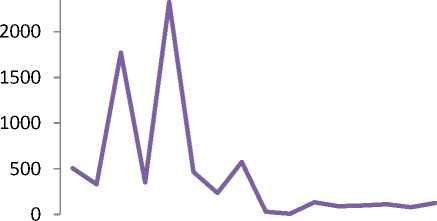
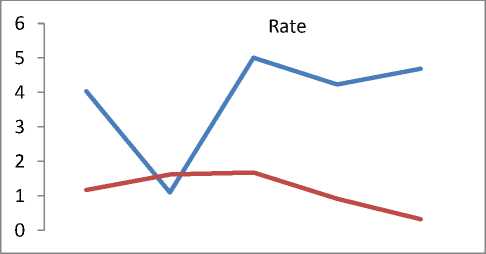
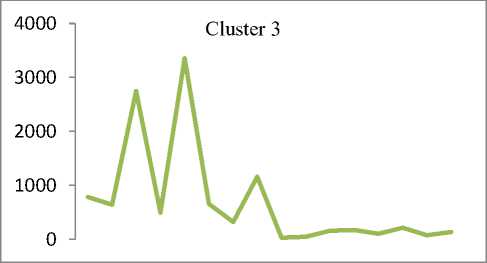
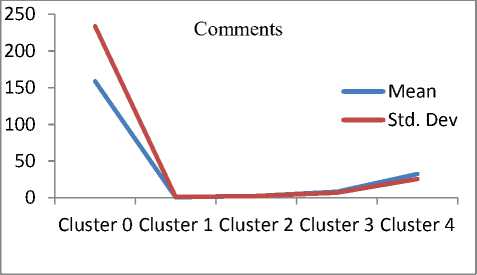
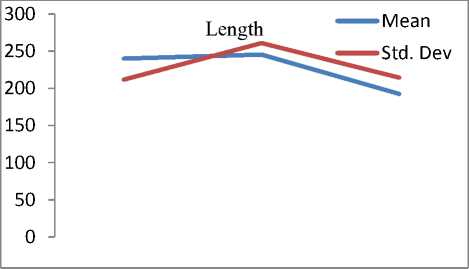
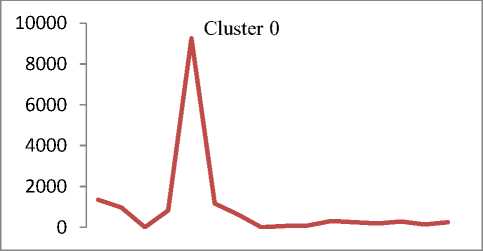
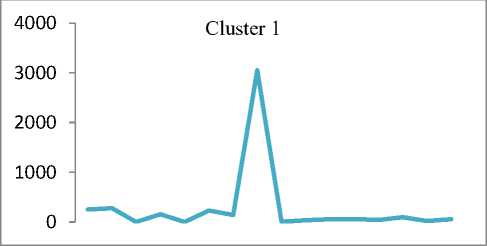
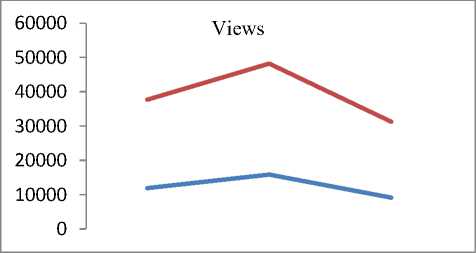
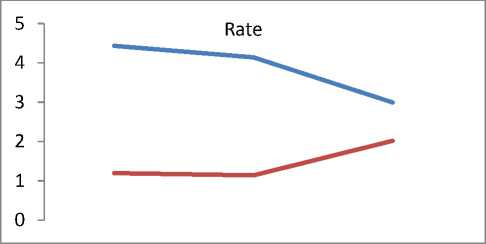
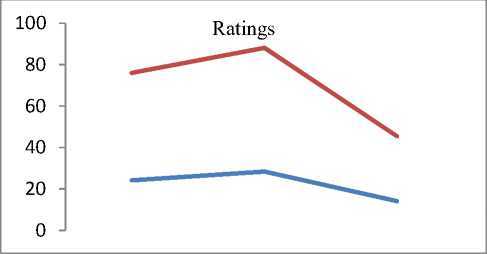
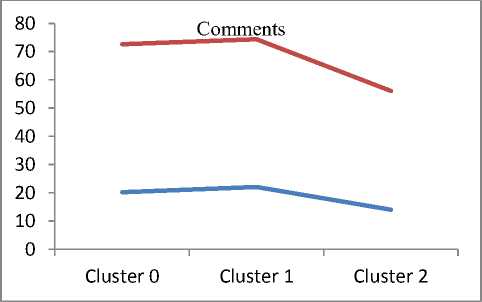
Q(0| 0<^ = Ezxe The parameter values are then recalculated to maximize the likelihood. This is known as ‘Maximization Step’. The new parameter estimates are used to calculate a new expectation, and then they are optimized again to maximize the likelihood. The parameter which maximizes the given quantity is 19 (t-i) = argmax Q (9| 6®) 9 (4) This iterative method continues until model convergence. The following is the algorithmic steps to form clusters using Expectation Maximization method. 1. The parameters (θ) of metadata objects of web video are initialized to some random values. 2. For the given parameter values of metadata objects of web video, calculate the best value for missing or unobserved latent values (ie. Z). 3. Then, use the just-calculated values of missing or unobserved latent values (Z) to calculate a better estimate for the parameters of web video metadata object values (θ). Parameters associated with a particular value of missing or unobserved latent values Z will use only those data points whose associated latent variable has that particular value. 4. Iterate steps 2 and 3 until convergence. • Building the Density Based cluster model Rather than using only the distance between points, Density Based clustering approach uses the local density of points to determine the clusters. In a circle (cluster shape) of radius ε around a point x, called the ε -neighborhood of x can be calculated as follows: Here δ(x, y) is the Euclidean distance between x and y. In a web video metadata object database D, for any web video metadata object value x ϵ D, we say that x is a core point if there are at least minimum y metadata object values in its neighborhood. In other words, x is a core object value if | N ε (x) | ≥ y, where y is a user-defined local density or frequency threshold. A border object value is defined as a object value that does not meet the y threshold. That is, it has | Nε (x) | < y, and is belongs to the neighborhood of some core object value z, i.e., x ϵ N (z). Finally, if an object value is neither a core nor a border value, then it is called an outlier or a noise object value. We say that an object value x is directly density reachable from another object value y, if x ϵ N ε(y) and y is a core object value. Further, the object value x is density reachable from another object value y, if there exists a chain of points, x = x0, x1, · · · , xk = y, such that xi is directly density reachable from xi-1. Meaning that, there is set of core object values leading from y to x. Finally, define any two points x and y to be density connected if there exists a core point z, such that both x and y are density reachable from z. We can now define a Density-based cluster as a maximal set of density connected points. D). Resultant Cluster Analysis The automatic formed clusters are analyzed in depth for knowledge discovery process. Normal distributions for each cluster are measured. Also structure of resultant cluster objects are analyzed in terms of different web video metadata objects considered for the experiment. IV. Results And Discussions This section is focused on in-depth study of cluster analysis of web video metadata objects. The metadata object ‘Category’ which has different nominal classes, is chosen for cluster evaluation. The 60% of the web video metadata object dataset [16] are trained and 40% are tested for the evaluation of cluster objects. A. Cluster Analysis using Expectation Maximization Approach The Table 2 and Table 3 represent cluster result obtained by the Expectation Maximization Approach. Five cluster objects are automatically formed namely, Cluster 0, Cluster 1, Cluster 2, Cluster 3 and Cluster 4 during the unsupervised clustering method using Expectation Maximization Approach. The properties of each clustered object are discussed as follows: The ‘Cluster 0’ has least cluster probability and the ‘Cluster 3’ has the highest cluster probability among formed five cluster objects. All the five cluster objects have cluster centroid as – ‘Music’ category web videos. The detailed ‘category’ based cluster analysis is represented in Fig.2. In Fig.2, the X – axis represents web video metadata object counts and Y-Axis represents 16 different categories of web videos as listed in Table 2 (from ‘People and Blogs’ to Science and technology’ respectively). Also, the Fig.3 represents normal distribution in terms of mean and standard deviation of each numerical web video metadata object. Table 2. Unsupervised Automatic EM Cluster Objects Sl.No Cluster 0 Cluster 1 Cluster 2 Cluster 3 Cluster 4 Cluster Probabilities ^ 0.06 0.19 0.23 0.35 0.17 Category 1 People & Blogs 125.8543 605.7934 506.889 782.1828 364.2806 2 Comedy 175.6425 451.095 331.6086 637.9954 294.6584 3 Entertainment 415.4066 1358.424 1770.909 2744.796 1301.465 4 How-to & Style 46.9774 298.1039 350.5691 490.9575 167.3921 5 Music 495.999 1327.863 2322.67 3355.796 1756.672 6 Sports 83.6863 374.4819 465.8565 653.9774 273.9979 7 News & Politics 85.2809 233.391 236.486 318.405 177.437 8 Film & Animation 226.061 359.8495 574.4305 1155.5 743.1588 9 Nonprofits & Activism 5.5086 18.6773 31.9984 26.4706 14.3451 10 UNA 49.9197 5.6252 8.7039 47.0667 62.6846 11 Travel & Events 14.7746 216.9608 135.3613 157.9615 61.9417 12 Autos & Vehicles 21.6471 134.2016 90.5184 171.2573 52.3756 13 Education 16.8447 118.144 100.7993 99.1903 30.0218 14 Pets & Animals 22.9445 158.9762 112.2925 214.0684 68.7184 15 Gaming 6.7311 83.5574 80.4027 72.8108 28.498 16 Science & Technology 17.2891 242.7793 127.4119 131.4901 57.0296 Total 1810.568 5987.923 7246.907 11059.93 5454.676 Table 3. Normal Distribution of Metadata Objects in Resultant EM Clusters Sl.No Metadata Objects Normal Distribution Cluster 0 Cluster1 Cluster 2 Cluster 3 Cluster 4 1 Length Mean 246.3689 160.3732 216.6672 218.4776 305.6104 Std. Deviation 277.7578 144.4847 159.2349 153.8294 377.4888 2 Views Mean 96418.1841 664.6557 1317.3737 5096.2072 21873.3883 Std. Deviation 121090.4299 793.9686 1375.036 4741.9052 18530.9799 3 Rate Mean 4.0289 1.092 5 4.2235 4.6821 Std. Deviation 1.1642 1.6169 1.6731 0.9131 0.3133 4 Ratings Mean 170.8535 0.7951 3.1132 10.1359 40.4014 Std. Deviation 232.5451 1.2307 2.3756 6.6112 26.1341 5 Comments Mean 158.6655 0.7184 2.5087 8.2193 32.4498 Std. Deviation 233.9087 1.1161 2.6406 6.9219 25.5269 The ‘Cluster 0’ has ‘Music’, ‘Entertainment’ and ‘Films and Animation’ categories as its major part. The ‘Cluster 0’ contains web videos which are most viewed, good ratings and large number of comments. Meaning that, the popular videos are clustered as ‘Cluster 0’ using metadata objects. The ‘Cluster 1’ has ‘Music’, ‘People and Blog’ and ‘Entertainment’ categories as its major part. The ‘Cluster 0’ contains web videos which are least viewed, less ratings and less number of comments. Meaning that, the non-popular videos are clustered as ‘Cluster 1’ using metadata objects. The ‘Cluster 2’ has ‘Music’, ‘Entertainment’ and ‘Films and Animation’ categories as its major part. The ‘Cluster 2’ contains web videos which are most viewed, high length, average number of rates and ratings, and less number of comments. Meaning that, the high lengths with non-popular videos are clustered as ‘Cluster 2’ using metadata objects. The ‘Cluster 3’ has ‘Music’, ‘Entertainment’ and ‘Films and Animation’ categories as its major part. The ‘Cluster 3’ contains web videos which are most viewed, high length, average number of rates and good ratings, and less number of comments. Meaning that, the high lengths, most viewed with non-popular videos are clustered as ‘Cluster 2’ using metadata objects. The ‘Cluster 4’ has ‘Music’, ‘Entertainment’ and ‘Films and Animation’ categories as its major part. The ‘Cluster 4’ contains web videos which are most viewed, high length, high rates and ratings, and average number of comments. Cluster 2 Ratings Fig.3. EM Cluster Analysis using Normal Distributions contains web videos which are High length, large number of viewed, average rated, average ratings and less number of comments. Meaning that, the average -popular videos with less number of comments are clustered as ‘Cluster 0’ using metadata objects. The ‘Cluster 2’ has ‘Entertainment’, ‘Sports’ and ‘People and Blogs’ categories as its major part. The ‘Cluster 2’ contains web videos which are comparatively small in length, less viewed, poor rated, less ratings and very less number of comments. Meaning that, the non-popular videos with less number of comments are clustered as ‘Cluster 0’ using metadata objects. Meaning that, the high lengths, most viewed with average-popular videos are clustered as ‘Cluster 4’ using metadata objects. The normal distribution of metadata object ‘Length’ is found well in ‘Cluster 3’ and ‘Cluster 1’ as compared to remaining resultant clustered objects, as shown in Fig. 3 and Table 3. Similarly, the normal distribution of ‘ Views’, ‘Ratings’ and ‘Comments’ is found well only in ‘Cluster 0’. In ‘Cluster 2’, the normal distribution is considerable found good for the metadata object ‘Rate’. Also we found that, the Log likelihood of the Expectation Maximization clustering model is: -27.07905. B. Cluster Analysis using Density Based Approach The Table 4 and Table 5 describes cluster result obtained by the Density Based clustering Approach. Three cluster objects are automatically formed namely, Cluster 0, Cluster 1, and Cluster 2 during the unsupervised clustering method using Density Based clustering Approach. The properties of each clustered object are discussed as follows: The ‘Cluster 1’ has least cluster probability and the ‘Cluster 0’ has the highest cluster probability among formed five cluster objects. The cluster centroid of ‘Cluster 0’ is ‘Music’ category, the centroid of ‘Cluster 1’ is found ‘Films and Animation’ category, and the cluster centroid of ‘Cluster 2’ is found ‘Entertainment’ category. The detailed ‘category’ based cluster analysis is represented in Fig.4. In Fig.4, the X – axis represents web video metadata object counts and Y-Axis represents 16 different categories of web videos as listed in Table 4 (from ‘People and Blogs’ to Science and technology’ respectively). Also, the Fig.5 represents normal distribution in terms of mean and standard deviation of each numerical web video metadata object. In Fig.5, X-axis represents distribution units in terms of mean and standard deviation, Y-axis represents ‘Cluster 0, ‘Cluster 1’ and ‘Cluster 2’ respectively. The ‘Cluster 0’ has ‘Music’, ‘Sports’ and ‘People and Blogs’ categories as its major part. The ‘Cluster 0’ contains web videos which are High length, most viewed, good rated, average ratings and less number of comments. Meaning that, the popular videos with less number of comments are clustered as ‘Cluster 0’ using metadata objects. The ‘Cluster 1’ has ‘Films and Animation’, ‘Sports’ and ‘Comedy’ categories as its major part. The ‘Cluster 1’ Table 4. Unsupervised Automatic DB Cluster Objects Cluster 0 Cluster 1 Cluster 2 Cluster Probabilities^ 0.5001 0.1423 0.3576 Category People & Blogs 1353 252 778 Comedy 965 277 647 Entertainment 1 1 7587 How-to & Style 820 157 375 Music 9255 1 1 Sports 1166 233 451 News & Politics 628 140 281 Film & Animation 1 3055 1 Nonprofits & Activism 62 8 25 UNA 92 38 42 Travel & Events 309 55 221 Autos & Vehicles 252 60 156 Education 191 41 131 Pets & Animals 278 97 200 Gaming 141 22 107 Science & Technology 247 57 270 Total 15761 4494 11273 Table 5. Normal Distribution of Metadata Objects in Resultant DB Clusters Metadata Objects Normal Distribution Cluster 0 Cluster 1 Cluster 2 Length Mean 239.871 245.5234 192.352 Std. Dev 211.736 260.9182 214.25 Views Mean 11937.57 15878.49 9123.86 Std. Dev 37663.23 48179.50 31252.79 Rate Mean 4.431 4.1397 2.9945 Std. Dev 1.1959 1.1414 2.0184 Ratings Mean 24.1054 28.3618 14.1239 Std. Dev 75.9427 88.1207 45.3857 Comment Mean 20.1799 22.0386 14.0359 Std. Dev 72.6342 74.4091 56.0402 Also we found that, the Log likelihood of the Density Based clustering model is: -33.64669. Note that, the difference between log likelihood of Expectation Maximization cluster model and density Based cluster model is approximately 6. 1000 0 Cluster 2 /\ 1-1-г-^tt^^^^^^^^F^^^T^^t Fig.4. DB Cluster Analysis using 'Category' V. Conclusion and Future Work In this work, effective attempts are made to cluster web videos based on metadata objects such as – category, view counts, length, number of comments, and rating information. The clusters are made to form automatically using unsupervised Expectation Maximization (EM) and Density Based (DB) clustering approach. Effective clustering models were built using EM and DB algorithms and applied on large scale web video metadata object dataset. Different clusters were formed according to the web video metadata objects. The each resultant clusters are analyzed in depth and normal distribution of each numerical metadata object within clusters are found. Also we found, the log likelihood of EM and DB cluster models. The future work is to enhance this experiment to detect and find out the outlier/abnormal web videos among large scale web video dataset. Fig.5. EM Cluster Analysis using Normal Distribution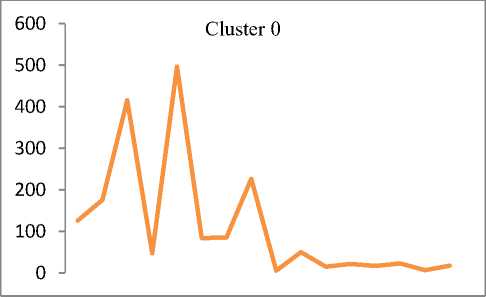


Список литературы Web Video Object Mining: Expectation Maximization and Density Based Clustering of Web Video Metadata Objects
- Amjad Mahmood, Tianrui Li, Yan Yang, Hongjun Wang and Mehtab Afzal, "Semi-supervised evolutionary ensembles for Web video categorization", Elsevier- Knowledge-Based Systems 76 (2015) 53–66.
- https://www.youtube.com/yt/press/index.html
- C.F-Hsu, James C., and E.Khabiri, "Hierarchical Comment Based Clustering", ACM 978-1-4503-0113-8/11/03, March 2011.
- Aggarwal N, Agrawal, S. and Sureka, A., "Mining YouTube Metadata for Detecting privacy Invading Harassment and Misdemeanor Videos", Privacy, Security and Trust (PST), 2014 IEEE Twelfth Annual International Conference on , vol., no., pp.84,93, 23-24 July 2014.
- Siddu P. Algur, Prashant Bhat, Suraj Jain, "Metadata Construction Model for Web Videos: A Domain Specific Approach", International Journal of Engineering and Computer Science, December 2014.
- Siddu P. Algur, Prashant Bhat, "Metadata Based Classification and Analysis of Large Scale Web Videos", International Journal of Emerging Trends and Technologies in Computer Science, May-June 2015.
- Xu Cheng, Cameron Dale, and Jiangchuan Liu, "Understanding the Characteristics of Internet Short Video Sharing: YouTube as a Case Study", arXiv: 0707.3670v1 [cs.NI] 25 Jul 2007.
- C. Ramachandran, R.Malik, Xin Jin and Jing Gao "VideoMule: A Consensus Learning Approach to Multi-Label Classification from Noisy User-Generated Videos", ACM, MM'09, October 19–24, 2009
- Alex Hindle, Jie Shao Dan Lin, Jiaheng Lu and Rui Zhang "Clustering Web Video Search Results based on Integration of Multiple Features", World Wide Web, Springer, 2011.
- J.S.Pedro, Stefan Siersdorfer and Mark Sanderson, "Content Redundancy in YouTube and its Application to Video Tagging", ACM Transactions on Information Systems, March 2011.
- Gloria Chatzopoulou, Cheng Sheng, Michalis Faloutsos, "A first step towards understanding popularity in YouTube", http://www.cs.unm.edu/~michalis/PAPERS/ youtube_CAMERA.pdf
- Chirag Shah, Charles File, "Infoextractor – A Tool for Social Media Data Mining", JITP 2011.
- Siddu P. Algur, Prashant Bhat, Suraj Jain, "The Role of Metadata in Web Video Mining: Issues and Perspectives", International Journal of Engineering Sciences & Research Technology, February-2015.
- Siddu P. Algur, Prashant Bhat, "Metadata Based Classification and Analysis of Large Scale Web Videos", International Journal of Emerging Trends and Technologies in Computer Science, May-June 2015.
- http://docs.oracle.com/database/121/DMCON/algo_em.htm#CHDGCEGC.
- Dataset for "Statistics and Social Network of YouTube Videos", http://netsg.cs.sfu.ca/youtubedata/.
