Why is the self-sufficiency of urban districts budgets not growing

Author: Povarova Anna Ivanovna
Journal: Economic and Social Changes: Facts, Trends, Forecast @volnc-esc-en
Section: Public finance
Article in issue: 1 (43) т.9, 2016.
Free access
Urban districts occupy a special place in the system of municipalities due to their potential and role in the implementation of governmental economic policy. Possessing the most developed infrastructure, facilities and a good financial basis, large and medium-sized cities accumulate the major part of budget revenues. However, the predominant part of their revenues that amounts, according to various estimates, to 70-85% [1, 6, 15] goes to superior budgets. As a consequence of the reforms of intergovernmental fiscal relations and local government that were held in 2000-2009, cities were left without stable, legislated fiscal revenue sources that were sufficient to fulfill their obligations to the population. Currently, city government can fully dispose of single tax on imputed income, individual property tax and land tax. Significant imbalances in the distribution of budget revenues make cities dependent on the financial assistance of higher levels of public authority and lead to an accumulation of problems...
Urban district, urban districts budgets, own revenues of the budget, intergovernmental fiscal relations, efficiency of intergovernmental fiscal policy
Short address: https://sciup.org/147223795
IDR: 147223795 | UDC: 336.14 | DOI: 10.15838/esc/2016.1.43.7
Text of the scientific article Why is the self-sufficiency of urban districts budgets not growing
The state of budgetary security of the cities of Vologda and Cherepovets is particularly important for the regional economy development: they account for 87% of industrial output, 65% of retail turnover, 42% of volumes of commissioned housing, focus 90% of fixed assets, and employ 63% of working population.
What is the situation in the budgets of urban districts in? To answer this question, we study the reports on the execution of municipal budgets. They show a drop in key budget parameters. In 2011–2014 the provision with own revenue sources in the form of tax and non-tax revenues decreased by a third. The amount of municipal debt of the city of Vologda reached 1.9 billion rubles at the end of 2014; it was four-fold higher than in 2011. The debt of the Cherepovets’ budget is progressively accumulated, though the city had not had any debt obligations till 2013. It is important to emphasize that, in general, by budgets of RF urban districts the dynamics of own incomes has not changed (tab. 1).
The deterioration of financial autonomy of the cities is testified by the general negative dynamics of the key indicator of budget process management – provision with own revenues per one resident. In 2010–2012 the average annual growth rate of this indicator was 99% against 10–20% in 2000–2009; the greatest fall was observed in 2012 ( fig. 1 ).
Table 1. Key parameters of urban districts’ budgets in 2011–2014
|
Parameters |
2011 |
2012 |
2013 |
2014 |
2014 to 2011, % |
|
Vologda, million rubles |
|||||
|
Own revenues |
3,987.4 |
2,875.9 |
3,198.9 |
2,912.1 |
73.0 |
|
Surplus, deficit (-) |
-328.8 |
-481.1 |
-520.1 |
-231.7 |
70.5 |
|
Municipal debt |
535.2 |
1,109.2 |
1,877.7 |
1,941.9 |
362.8 |
|
Cherepovets, million rubles |
|||||
|
Own revenues |
4,132.4 |
3,056.2 |
3,181.7 |
2,894.3 |
70.0 |
|
Surplus, deficit (-) |
120.5 |
-181.2 |
-246.2 |
-64.0 |
х |
|
Municipal debt |
0 |
0 |
501.7 |
601.4 |
х |
|
Russian Federation, billion rubles |
|||||
|
Own revenues |
741.7 |
727.0 |
790.3 |
740.2 |
99.8 |
|
Surplus, deficit (-) |
-31.3 |
-31.0 |
-43.4 |
-38.4 |
122.7 |
|
Municipal debt |
215.5 |
245.3 |
288.9 |
313.2 |
145.3 |
|
* In general, for all levels of municipalities. Sources: data of the Ministry of Finance of the Russian Federation [7]; the Federal Treasury [8]; reports on the execution of budgets of the cities of Vologda [9] and Cherepovets [11]; the author’s calculations. |
|||||
Figure 1. Dynamics of average annual growth rates of per capita provision of the Vologda Oblast urban districts with own budget revenues in 2000–2014, %
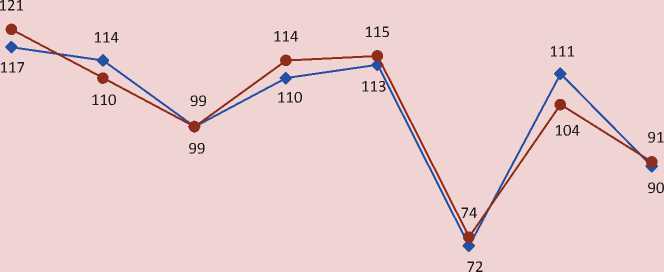
Average Average Average 2010 2011 2012 2013 2014
for for for
2000-2004 2005-2009 2010-2014
— ♦ — Vologda —•— Cherepovets
Source: data from the reports on the execution of budgets of the cities of Vologda and Cherepovets; Federal State Statistics Service of the Russian Federation [12]; the author’s calculations.
The absolute volume of own incomes per capita in the city of Vologda in 2014 was lower than in many administrative centers of the Northwestern Federal District and the neighboring regions. By this indicator, the “city-metallurgist” of Cherepovets lagged behind its counterparts – Lipetsk and Chelyabinsk ( fig. 2 ).
What is the reason for the situation, why is the state of municipal budgets characterized by destabilization today? Is it based on economic factors perhaps? However, the official statistical data refute this assumption. In 2012–2014 the city’s economy developed rapidly, without creating obvious threats to reduce tax potential: the key macroeconomic indicators show increasing trends ( tab. 2 ).
The more detailed research in the structure of tax payments to the budgets of cities shows sharp changes in the dynamics of the main revenue source – personal income tax (PIT). In 2014 with the 30 percent growth in average monthly wages the amount of fees did not account for half of the total receipts in 2011. The role of personal income tax in the formation of own budgetary resources declined significantly: the share of this tax in the total revenue decreased from 46–54% to 30–36%, respectively ( tab. 3 ).
Personal income tax receipts to the budgets of Russia’s urban districts, unlike the Vologda Oblast, went down on average only by 7% for the specified period.
Figure 2. Provision of the RF urban districts with own budget revenues in 2014, rubles per capita
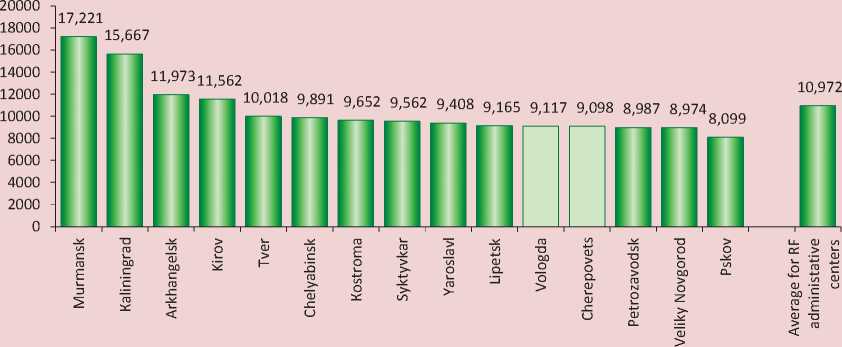
Source: the author’s calculation by the data of the Federal State Statistics Service of the Russian Federation.
Table 2. Key macroeconomic indicators of urban districts in the Vologda Oblast in 2011–2014
|
Indicators |
2011 |
2012 |
2013 |
2014 |
2014 to 2011, % |
|
Vologda |
|||||
|
Industrial production index, % to the previous year |
115.0 |
97.4 |
103 |
140.9 |
141.4 |
|
Retail trade turnover, billion rubles |
33.3 |
45.1 |
48.1 |
53.2 |
159.8 |
|
Housing commissioning, thousand m2 of the total area |
140.6 |
144.6 |
164.5 |
183.8 |
130.7 |
|
Cherepovets |
|||||
|
Industrial production index, % to the previous year |
103.1 |
100.6 |
102.0 |
103.5 |
106.2 |
|
Retail trade turnover, billion rubles |
31.3 |
38.6 |
41.4 |
43.8 |
140.0 |
|
Housing commissioning, thousand m2 of the total area |
110.1 |
63.0 |
97.1 |
138.5 |
125.8 |
|
Sources: data of the Federal State Statistics Service of the Russian Federation; official websites of the cities of Vologda and Cherepovets; the author’s calculations. |
|||||
Table 3. Personal income tax receipts to the budgets of urban districts in 2011–2014
|
Indicators |
2011 |
2012 |
2013 |
2014 |
2014 to 2011, % |
|
Vologda |
|||||
|
Average monthly wage, thousand rubles |
20.7 |
23.1 |
25.5 |
26.7 |
129.0 |
|
Personal income tax, million rubles |
1,850.4 |
997.0 |
1,091.9 |
872.8 |
47.2 |
|
Share in own revenues, % |
46.4 |
34.7 |
34.1 |
30.0 |
-16.4 p.p. |
|
Cherepovets |
|||||
|
Average monthly wage, thousand rubles |
26.4 |
29.6 |
32.4 |
34.3 |
129.9 |
|
Personal income tax, million rubles |
2,247.9 |
1,231.8 |
1,272.4 |
1,046.3 |
46.5 |
|
Share in own revenues, % |
54.4 |
40.3 |
40.0 |
36.1 |
-18.3 p.p. |
|
Russian Federation |
|||||
|
Personal income tax, million rubles |
361.9 |
376.9 |
420.3 |
337.0 |
93.1 |
|
Share in own revenues, % |
48.8 |
51.8 |
53.2 |
45.5 |
-3.3 p.p. |
|
Sources: data of the Federal State Statistics Service of the Russian Federation; the Federal Treasury; reports on the execution of budgets of the cities of Vologda and Cherepovets; the author’s calculations. |
|||||
Since personal income tax is the main tool to regulate interbudgetary relations at the level of “region – municipality”; the reasons of its fiscal functions deterioration should be sought in the existing intergovernmental fiscal policy.
I should say that due to the intergovernmental reforms in Russia in the early 2000s the budgets of cities were left without half of their taxes that were withdrawn to the budgets of higher levels ( tab. 4 ).
In the subsequent years by analogy with the federal government the regional authorities carried out centralization of budgetary revenues, reducing the rates of tax deductions to the cities’ budgets. As a result, of the total tax and non-tax payments collected, for example, on the territory of Vologda, 9% went to the city’s budget in 2014, compared to 28% in 2010–2011 ( fig. 3 ). We should stress that the reduction in standards of the receipts allocated to the city’s budget occurred on the background of growing payments.
According to the Control and Accounts Chamber of the city of Vologda [10], in 2014 the standards of distribution of the revenues collected in the city to the higher budgets were as follows: to the regional budget – 35.2%; to the budgets of state extra-budgetary funds – 32.8%; the federal budget – 22.8%.
Depriving the cities of the lion’s share of budgetary resources, the state transferred most powers of the federal and regional authorities to local authorities. In 2014 half of the expenses of budgets of the Vologda Oblast urban districts accounted for the delegated powers of public authorities of higher level, which limited the possibilities for building their own budget policy. In the period from 2008 to 2014 the delegated authorities increased 3-fold, and the co-financing of obligations to the cities’ population from federal and regional budgets in the form of subsidies decreased by 1.8 times ( tab. 5 ).
Table 4. Structure of the Vologda budget’s tax revenues in 1999, 2005 and 2014
|
Tax revenues |
1999 |
2005 |
2014 |
|||
|
Billion rubles |
% |
Billion rubles |
% |
Billion rubles |
% |
|
|
Total |
771.5 |
100.0 |
1,885.9 |
100.0 |
1,894.1 |
100.0 |
|
corporate tax |
131.1 |
17.0 |
98.6 |
5.2 |
0 |
0 |
|
Personal income tax |
213.4 |
27.7 |
1,014.3 |
53.8 |
872.8 |
46.1 |
|
Value added tax |
57.3 |
7.4 |
0 |
0 |
0 |
0 |
|
Excises |
65.6 |
8.5 |
190.4 |
10.1 |
4.4 |
0.2 |
|
Sales tax |
27.9 |
3.6 |
0 |
0 |
0 |
0 |
|
lumpsum tax |
17.6 |
2.3 |
125.7 |
6.7 |
296.8 |
15.7 |
|
Property taxes |
82.6 |
10.7 |
419.2 |
22.2 |
661.8 |
34.9 |
|
Payments for the use of natural resources |
14.0 |
1.8 |
0 |
0 |
0 |
0 |
|
State tax |
2.1 |
0.3 |
22.4 |
1.2 |
58.3 |
3.1 |
|
Local taxes and fees* |
149.3 |
19.4 |
0 |
0 |
0 |
0 |
|
Other taxes, fees and charges |
10.6 |
1.3 |
0 |
0 |
0 |
0 |
* Tax on maintenance of housing and objects of the socio-cultural sphere, target tax on police maintenance, landscaping and education, tax on advertising, fee for granting a patent.
Sources: data of the reports on the execution of the budget of the city of Vologda; the author’s calculations
Figure 3. Structure of distribution of tax and non-tax revenues, received in the city of Vologda in 2010–2014, billion rubles
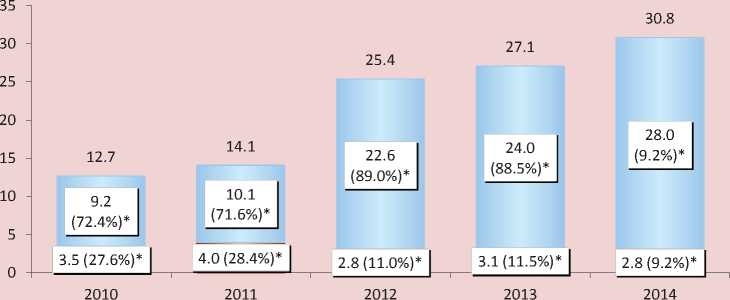
Revenues gone into the budgets of higher level □ Revenues gone into the budget of the city
* Brackets indicate the share of revenues transferred to the budget system levels, total revenue.
Sources: data of the Control and Accounts Chamber of the city of Vologda; reports on the execution of the budget of the city of Vologda; the author’s calculations.
Table 5. Expenditures of the urban districts budgets’ on the execution of delegated authorities in 2008–2014, billion rubles
|
Indicators |
2008 |
2009 |
2010 |
2011 |
2012 |
2013 |
2014 |
2014 to 2008, % |
|
Vologda Oblast |
||||||||
|
Delegated authorities |
2.55 |
2.59 |
2.87 |
3.06 |
3.99 |
4.45 |
6.95 |
272.7 |
|
Share in total expenditure, % |
21.0 |
26.8 |
24.0 |
23.1 |
30.3 |
33.3 |
48.1 |
+27.1 p.p. |
|
Subsidies |
2.45 |
1.05 |
1.79 |
1.65 |
2.37 |
1.87 |
1.39 |
56.8 |
|
Russian Federation |
||||||||
|
Delegated authorities |
210.5 |
230.3 |
256.6 |
295.2 |
386.6 |
400.3 |
549.7 |
261.1 |
|
Share in total expenditure, % |
17.4 |
19.3 |
19.8 |
19.9 |
25.1 |
24.1 |
31.8 |
+14.4 p.p. |
|
Subsidies |
206.9 |
198.1 |
222.8 |
254.2 |
279.3 |
316.6 |
293.3 |
141.8 |
Sources: data of the Federal Treasury; the author’s calculations.
Let us note that with the equivalent growth of delegated expenditures in general by RF urban budgets the subsidiary financing increased by 1.4 times. This trend suggests that the regional authorities solve the problem of the Vologda Oblast budget system imbalance by gradually distancing themselves from participation in those or other directions to develop local territories.
The declining dynamics of the budget’s provision with own resources indicates the reduction in fiscal autonomy of the cities. If in 1999 the city authorities could fully provide expenditure commitments with own receipts, in 2014 – only 72–84% (fig. 4).
In 2012 the replacement of equalization transfers by differentiated rates of PIT deductions is innovation of the interbudge-tary regulation in the Vologda Oblast. This replacement was conducted mainly at the expense of the withdrawal of part of personal income tax from the budgets of the cities of Vologda and Cherepovets, thus involving the fall in own revenue sources. So, in 2014 the budgets of urban districts received only 16% of the total amount of collected income tax ( fig. 5 ).
In our opinion, budgetary maneuver has not achieved the desired effect, although at first glance, the regional authorities’ efforts to reduce subsidization of the municipalities have reached their goal. Since 2012, when the inter-budgetary interaction principles were adjusted, the share of financial aid in the municipal budgets’ revenues has decreased from 82 to 72%, but it is still very high (the national average is 77%). Moreover, after the decline in the share of transfers in 2012–2013 it increased in the following two years. At the same time, gratuitous receipts in municipal budgets increased from 38% to 55%. Therefore, there was no overall significant reduction in the local budgets’ dependency on transfers (fig. 6).
Besides, the withdrawal of the cities’ revenues artificially deprive other municipalities of the incentives to seek additional receipts of their budgets, as they receive minimum funds to resolve issues of local significance in any case. In 2012–2014 tax revenues of budgets of the Vologda Oblast municipal districts went up
Figure 4. Indicator of the balance of budgets* of the Vologda Oblast urban districts in 1999–2014, %
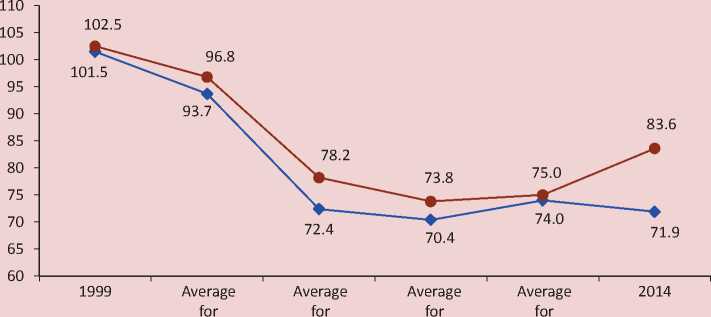
1999-2003 2004-2005 2006-2009 2010-2014
— ♦ — Vologda —•— Cherepovets
* Calculated as the ratio of own revenues to expenses minus subsidies.
Source: data of the reports on the execution of budgets of the cities of Vologda and Cherepovets; the author’s calculations.
Figure 5. Structure of the distribution of personal income tax, received from the Vologda Oblast urban districts in 2014, million rubles
6,634

5,334

4,461
5,588
Vologda
Cherepovets
-
□ Budget of the city
-
□ Budget of the region
Sources: Department of Finance of the Vologda Oblast [14]; the author’s calculations.
Figure 6. Proportion of inter-budgetary transfers in the revenues of the Vologda Oblast local budgets in 2011–2015, %
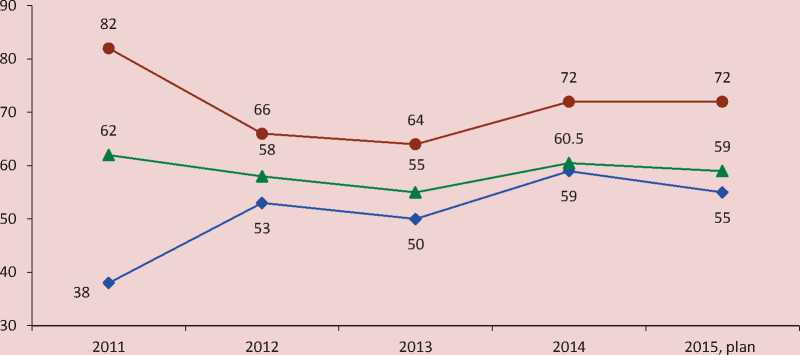
—•— Urban districts
• Municipal districts
—*— Average for municipal districts
Sources: data of the Federal Treasury; the author’s calculations.
by 80% compared to 2011, primarily due to the transfer of income tax, while the other sources are characterized by a downward trend ( tab. 6 ).
The new regime of interbudgetary regulation did not contribute to any appreciable changes in the municipalities’ economic development: in 201 1–2014 the share of regions did not amount to 12% in the volume of shipped products of regional manufacturing enterprises (fig. 7). Thus, the urban districts continued to be key drivers of its economic growth.
Table 6. Income tax receipts to the budgets of the Vologda Oblast municipal districts in 2011–2014, million rubles
|
Tax revenues |
2011 |
2012 |
2013 |
2014 |
2014 к 2011, % |
|
Total |
2,055.7 |
4,298.4 |
4,203.9 |
3,677.2 |
178.9 |
|
Personal income tax |
1,310.5 |
3,370.1 |
3,113.4 |
3,173.0 |
242.1 |
|
lumpsum tax |
403.2 |
504.8 |
554.2 |
357.9 |
88.8 |
|
Property tax |
220.8 |
401.1 |
508.9 |
0 |
х |
|
State tax |
120.7 |
22.4 |
27.4 |
34.6 |
28.7 |
|
Sources: data of the Federal Treasury; the author’s calculations. |
|||||
Figure 7. Structure of the volume of shipped products of the manufacturing industry in the Vologda Oblast in 2011–2014, billion rubles
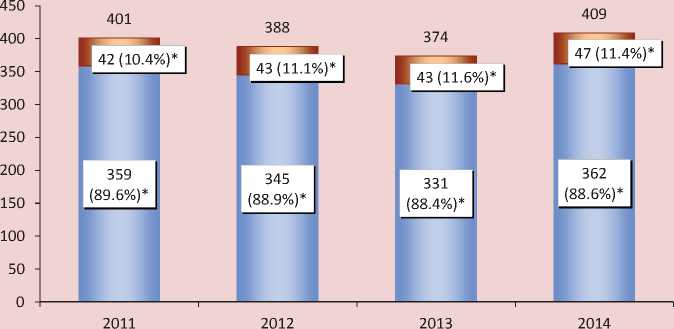
□ Urban districts О Municipal districts
* Brackets show the share in total shipments.
Sources: Federal State Statistics Service of the Russian Federation; the author’s calculations.
Table 7. Forecast parameters of the budgets of the Vologda Oblast urban districts in 2016, million rubles
|
Indicators |
Vologda |
Cherepovets |
||||||
|
2014, fact |
2015, assessment |
2016, forecast |
2016 to 2015, % |
2014, fact |
2015, assessment |
2016, forecast |
2016 to 2015, % |
|
|
Own revenues |
2,912.1 |
3,253.9 |
2,842.3 |
87.3 |
2,894.3 |
3,103.0 |
3,103.5 |
100.0 |
|
Subventions |
3,543.1 |
3,368.1 |
2,346.1 |
69.7 |
3,406.2 |
3,216.1 |
2,494.8 |
77.6 |
|
Costs |
7,593.2 |
7,728.4 |
6,062.2 |
78.4 |
6,866.2 |
6,902.6 |
6,018.2 |
87.2 |
|
Deficit |
-231.7 |
-295.2 |
-150.4 |
50.9 |
-64.0 |
-112.8 |
-77.1 |
68.4 |
|
Municipal debt |
1,941.9 |
1,800.0 |
1,538.4 |
85.5 |
601.4 |
679.2 |
643.5 |
94.7 |
|
To own revenues, % |
66.7 |
55.3 |
54.1 |
-1.2 p.p. |
20.8 |
21.9 |
20.7 |
-1.2 p.p. |
Sources: data of the reports on the execution of budgets of the cities of Vologda and Cherepovets; the approved municipal budgets for 2015; the draft municipal budgets for 2016; the author’s calculations.
The urban districts budgets’ for 2016 do not contain any visible signs of declining budgetary tensions ( tab. 7 ).
So, in the budget of the city of Vologda the positive dynamics of own revenues resumed in 2015 will be interrupted: the forecast for 2016 indicates its 13% decline. There will be no growth of own revenue sources in the budget of the city of Cherepovets. Together with the decline and stagnation of own revenues the 20–30% reduction of subventions transferred from higher budgets is expected; it involves insufficient funding of delegated authorities.
The municipal debt will be reduced, but the debt load of the Vologda’s budget will remain substantial, accounting for more than half of its total receipts.
The expected reduction of the deficit will be achieved by cutting spending by 22% in the budget of the city of Vologda and by 13% in the budget of Cherepovets. If personal income tax receipts remained at least at the 2011 level, the city authorities would not have to implement the large-scale sequestration of costs on socio-economic development of their territories. According to the forecasts, in Vologda in 2016 the budget spending will not reach the 2011 level even at current prices, while the expenditure part of the city’s budget will be lower than in 2007 (fig. 8).
The decrease in capital investment or, in other words, the development budget is one of the most negative consequences of reduced budgetary self-sufficiency of the cities: in Vologda in 2014 budget investment decreased to 1.4 billion rubles, compared to 3.6 billion rubles in 2012. The draft budget of the city of Cherepovets for 2016 stipulates the reduction of financial support of the municipal investment program in the amount of 70 million rubles, or by more than 20% to the 2015 level.
The results of the conducted analysis allow us to conclude that during the years of market reforms in Russia the authorities have not achieved any key goals of the fiscal policy – an objective and efficient system for the distribution of revenue between levels of public authority. As a result, with the cities’ decisive contribution to territorial and national economy they have minimum sources for self-development.
Figure 8. Dynamics of the expenses of budgets of the Vologda Oblast urban districts in 2007–2016, billion rubles
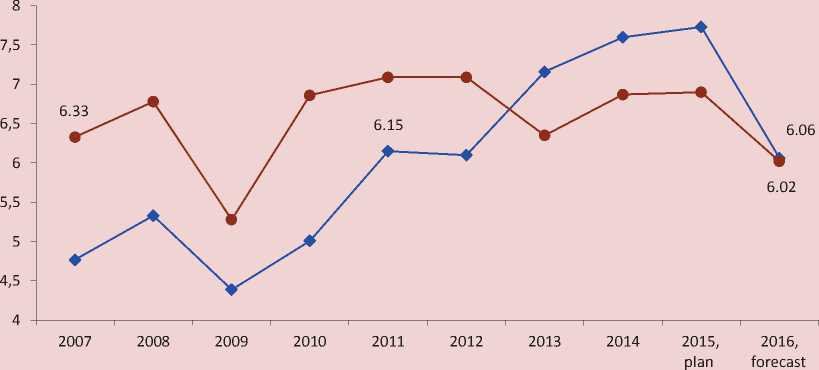
— ♦ — Vologda —•— Cherepovets
Source: data of the reports on the execution of budgets of the cities of Vologda and Cherepovets; the approved municipal budgets for 2015; the draft municipal budgets for 2016.
So, in 1999–2014 the two largest cities of the Vologda Oblast produced about 90% of industrial output on average, but their share in the consolidated budget of the region decreased from 35 to 12.5 percent. There is a clear relationship between the reform and the reduction of financial autonomy of the cities ( fig. 9 ). During the years of reforms the share of municipal budgets’ own revenues in gross regional product of the Vologda Oblast reduced from 4.5 to 1.5%; consequently, Vologda and Cherepovets did not receive any positive effects in terms of their budgets’ revenues from the regional economy growth, mainly provided by these cities.
Surely, the lack of budgetary resources for basic needs of the population living in the municipalities of lower level increases the load on the regional budget: every year more than a third of its expenses go to local budgets as financial assistance.
You cannot deny that today many municipalities of lower level will not survive without allocation of certain cities’ receipts to districts and villages. But the question is what part of the collected revenue shall be withdrawn from cities. Only in 2014 due to the insufficient amount of income tax received to the budget, the city authorities of Vologda and Cherepovets were unable to
Figure 9. Share of the urban districts in industrial production and own revenues of the Vologda Oblast consolidated budget in 1999–2014, %
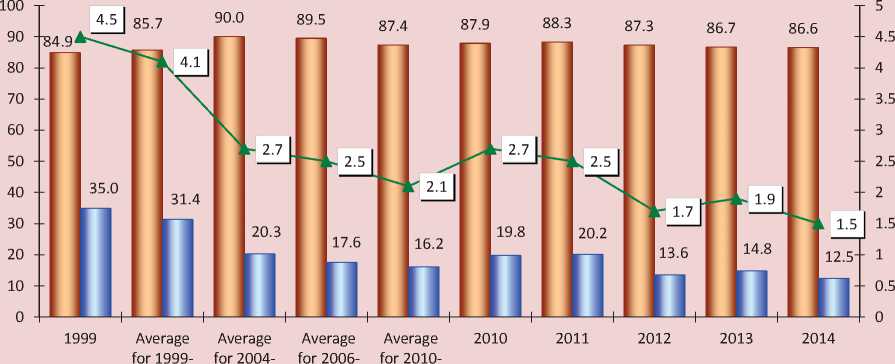
2003 2005* 2009** 2014
■ __ ■ Industrial production
■ = ■ Consolidated budget
—*— Own revenues of the cities’ budgets to GRP, %
* Period of the interbudgetary reform and preparations for the local government reform.
** Period of the local self-government reform.
Sources: data of the Federal Treasury; Federal State Statistics Service of the Russian Federation; the reports on the execution of budgets of the cities of Vologda and Cherepovets; the author’s calculations.
assign 10 billion rubles for the solution of social problems, repair of roads, resettlement, and other issues of survival.
It seems that cities should have more than half of all revenue collected and the losses of regional budgets should be compensated by means of revising the current budget and tax policy, especially redistribu ting taxes in favor of RF subjects, but not the federal government.
Specific proposals in this direction have been reflected in a number of works by the representatives of expert and scientific community [2, 3, 4, 5, 13].
In our view, different approaches to inter-budgetary policy are required; they should take into account the interests of all participants of the budget process. Cities, especially administrative centers, should be legislatively singled out from the total number of municipalities because of their special relevance to the socio-economic life of regions; strategies and comprehensive plans of urban development should have sufficient and stable budgetary support. Unfortunately, the cities’ current budgeting system has not yet focused on the future development of the country and its territories.
References Why is the self-sufficiency of urban districts budgets not growing
- Byudzhet goroda . Ofitsial'nyi sait g. Naberezhnye Chelny . Available at: http://nabchelny.ru/page/270
- Byudzhet dlya gorozhan vmesto byudzheta chinovnikov . Ofitsial'nyi sait d.e.n. Dmitrievoi O.G. . Available at: http://www.dmitrieva.org/id915
- Valentei S.D., Gligich-Zolotareva M.V., Lykova L.N. Starye i novye problemy rossiiskogo Federalizma . Federalizm , 2012, no. 4, pp. 7-38.
- Zubarevich N.V. Mezhbyudzhetnye otnosheniya tsentra i regionov: ekonomicheskie i institutsional'nye aspekty . Zhurnal Novoi ekonomicheskoi assotsiatsii , 2014, no. 3, pp. 158-161.
- Ilyin V.A., Povarova A.I. Problemy regional'nogo razvitiya kak otrazhenie effektivnosti gosudarstvennogo upravleniya . Ekonomika regiona , 2014, no. 3, pp. 48-62.
- Interv'yu agentstvu “Interfaks” mera g. Bataiska V. Putilina . Available at: http://www.interfax-russia.ru/South/print.asp?id=559545& type=exclusive
- Informatsiya Ministerstva finansov RF ob ob”eme gosudarstvennogo dolga sub”ektov RF i dolga munitsipal'nykh obrazovanii . Available at: http://www.minfin.ru/ru/perfomance/public_debt/subdbt/index.php
- Otchetnost' Federal'nogo kaznacheistva ob ispolnenii byudzhetov sub”ektov RF i mestnykh byudzhetov . Available at: http://www.roskazna.ru/byudzhetov-subektov-rf-i-mestnykh-byudzhetov
- Ofitsial'nyi sait administratsii g. Vologdy . Available at: http://vologda-portal.ru/
- Ofitsial'nyi sait Kontrol'no-schetnoi palaty g. Vologdy . Available at: http://kspvologda.ru/
- Ofitsial'nyi sait merii g. Cherepovtsa . Available at: http://mayor.cherinfo.ru/
- Ofitsial'nyi sait Federal'noi sluzhby gosudarstvennoi statistiki . Available at: http://www.gks.ru/
- Povarova A.I., Uskova T.V. Byudzhetnaya obespechennost' munitsipal'nykh obrazovanii Vologodskoi oblasti: sostoyanie, problemy, puti povysheniya . Ekonomicheskie i sotsial'nye peremeny: fakty, tendentsii, prognoz , 2010, no. 1, pp. 45-61.
- Raschet postuplenii naloga na dokhody fizicheskikh lits v byudzhet oblasti na 2016 god: prilozhenie k proektu zakona “Ob oblastnom byudzhete na 2016 god” . Ofitsial'nyi sait Zakonodatel'nogo Sobraniya Vologodskoi oblasti . Available at: http://vologdazso.ru/zakin/search.php?docid=
- Trostnikov D. Pochemu byudzhet Moskvy v 45 raz bol'she byudzheta Novosibirska? . Available at: http://nsknews.info/news/117482
