Wiener filter based noise reduction algorithm with perceptual post filtering for hearing aids

Author: Rajani S. Pujar, Pandurangarao N. Kulkarni
Journal: International Journal of Image, Graphics and Signal Processing @ijigsp
Article in issue: 7 vol.11, 2019.
Free access
This paper presents a filter bank summation method to perform spectral splitting of input signal for binaural dichotic presentation along with dynamic range compression coupled with noise reduction algorithm based on wiener filter. This helps to compensate the effect of spectral masking, reduced dynamic range, and improves speech perception for moderate sensorineural hearing loss in the adverse listening conditions. We have considered cascaded structure of noise reduction technique; Filter Bank Summation (FBS) based amplitude compression and spectral splitting. Wiener filter produces the enhanced signal by removing unwanted noise. The signal is split into eighteen frequency bands, ranging from 0-5KHz, based on auditory critical bandwidths. To reduce the dynamic range, amplitude compression is carried out using constant compression factor in each of the bands. Subjective and objective assessment based on Mean Opinion Score (MOS) and Perceptual Evaluation of Speech Quality (PESQ) scores, respectively, are used to test the Perceived quality of speech for different Signal-to-Noise Ratio (SNR) conditions. Vowel Consonant Vowel (VCV) syllable /aba/ and sentences were used as the test material. The results of the listening tests showed MOS scores for processed speech sentence “sky that morning was clear and bright blue” (4.41, 4.2, 3.96, 3.6, 3.08 and 2.66) as compared with unprocessed speech MOS scores ( 4.53, 1.21, 1.16, 1.06, 0.8, 0.483) for SNR values of ∞, +6, +3, 0, -3 and -6 dB respectively, and PESQ values (Left Channel: 2.6192, 2.5355, 2.5646, 2.5513, 2.5221, and 2.4309; Right Channel: 2.5889, 2.3001, 2.3714, 2.4710, 2.3636, and 2.4712) for SNR values of ∞, +6, +3, 0, -3 and -6 dB respectively, indicating the improvement in the perceived quality for different SNR conditions. To evaluate the intelligibility of the perceived speech, listening test was carried out for hearing impaired (moderate Sensorineural Hearing Loss (SNHL)) persons in the presence of background noise using Modified Rhyme Test (MRT).The test material consists 50 sets of monosyllabic words of consonant-vowel-consonant (CVC) form with six words in each set. Each subject responded for a total of 1800 presentations (300 words x 6 different SNR conditions). Results of the listening tests (using MRT) showed maximum improvement of (27.299%, 23.95%, 24.503%, 23.602%, and 23.498%) in the speech recognition scores at SNR values of (-6dB, -3dB, 0dB, +3dB, +6dB) compared to unprocessed speech recognition scores. Reductions in response times compared to unprocessed speech response times at lower SNR values were observed. The decrease in response times at the SNR values of -6, -3, 0, +3 and+6 dB were 1.581, 1.41, 1.329, 1.279, and 1.01s, respectively, indicating improvement in intelligibility of the speech at lower SNR values.
Filter bank summation (FBS) method, Dynamic Range Compression (DRC), Modified Rhyme Test (MRT), Perceptual Evaluation of Speech Quality (PESQ), Mean Opinion Score(MOS)
Short address: https://sciup.org/15016069
IDR: 15016069 | DOI: 10.5815/ijigsp.2019.07.06
Text of the scientific article Wiener filter based noise reduction algorithm with perceptual post filtering for hearing aids
Published Online July 2019 in MECS DOI: 10.5815/ijigsp.2019.07.06
There are different types of noise sources such as i) Background noise (additive noise) which is uncorrelated with signal for example noise from fans, cars, machines etc. ii) Babble noise ( speech like noise) from multi-talker noise as in classroom, cafeteria etc. iii) Noise correlated with the signal such as reverberation and echoes.
Speech signals are usually corrupted by one or combination of these noise sources. Hearing- impaired people have more difficulty in understanding speech than normal hearing people in the presence of background noise. Hence they may require an increased SNR, which may be up to 15 dB (on the average 4.5 dB) [1]. Hence it is essential for hearing aids to employ effective noise reduction technique to eliminate noise.
Noise reduction in hearing aids is a very challenging issue because the properties of the noise signal change significantly with time. Hence it is very difficult to develop an algorithm that works in different listening environments. The nature and properties of noise sources are very important in deciding which noise reduction algorithm works well to enhance speech signal by eliminating the noise from the corrupted signal. Some of the noise reduction schemes applicable for hearing aids are spectral subtraction, wiener filter, and beam former approaches [2,3,4,5].
Hearing impaired people have difficulty in hearing softer sounds; this is mainly because of the damage of hair cells in inner ear leading to elevated frequency dependent hearing thresholds and reduced dynamic range. To enhance the perception of soft sounds, different levels of sound must be amplified without making louder sounds uncomfortable. Filter Bank Summation Method (FBSM) is used for multi-channel dynamic-range compression to partly compensate the effect of reduced dynamic range for the people with sensorineural hearing loss [6].
In our proposed work, we have investigated the use of Weiner filter based noise reduction algorithm for multiband dynamic range compression using FBS Method. Wiener filter obtains the enhanced signal by optimizing the mean square error criteria. Weiner filter output is the input for Filter Bank Summation (FBS) i.e., we are cascading the wiener filter with FBS. In FBS method, frequencies ranging from 0-5000Hz are divided into 18 bands, depending on auditory critical bands. Each band is amplitude compressed with the constant compression factor of 0.4, 0.6 and 0.8. Spectral splitting of compressed speech is carried by combining odd numbered and even numbered filters and presented to the two ears for binaural dichotic listening.
Rest of the paper is organized as follows. Related works are discussed in section 2. Weiner filter algorithm for noise reduction is given in section 3. Result analysis is given in section 4. Finally, section 5 concludes the work.
-
II. Related Works
Many studies have investigated the noise reduction techniques for enhancing the speech perception for the hearing aid users. This section summarizes the existing techniques for noise reduction in hearing aids. Most of the advanced hearing aids are aimed at compensating one or more effects of sensorineural hearing loss. But still hearing aid users have difficulty in understanding speech especially in adverse listening conditions. Hence hearing aids should include noise reduction techniques for enhancing the speech perception [7,8].
Noise reduction techniques can be classified into two categories, i.e. single and multichannel techniques [9,10]. Single channel techniques, i.e. single microphone techniques with a single connection to the outside world (this to exclude a directional microphone), are based on exploiting differences in physical characteristics, such as frequency content, temporal characteristics, etc., between speech and other sound sources. The prominent single channel technique used in hearing aids is spectral subtraction technique. In spectral subtraction, it is assumed that the noise is sufficiently stationary such that its estimate can be subtracted from the spectrum obtained during speech and noise periods.
Due to the miniaturization of microphones, two or more microphones can be integrated in commercial hearing aids [11]. In contrast with single channel systems, multichannel noise reduction has the ability to exploit not only spectral and temporal differences but also the spatial separation between sound sources to enhance the SNR.
Hence, it is preferred over single channel systems [12]. Spatial domain (direction or location) difference between a target and noise signal can be used to achieve noise reduction in different noisy conditions using a system with a microphone array [13]. Beam forming is the most commonly used commercial multi-microphone noise reduction approach in hearing aids [14].
A performance comparison of monaural and binaural spectral subtraction approaches with a conventional directional microphone is discussed in [15]. The input signals are recorded from everyday hearing conditions. An improved performance was achieved from the directional microphone with noise reduction of 6.8 dB. During speech pauses, monaural spectral subtraction provides similar noise reduction effect as that of Directional Microphone (DM). The binaural spectral subtraction provides noise reduction of 8.2 dB. The objective of noise reduction techniques is to improve quality and intelligibility of noisy speech. Improving the quality of speech may not necessarily improve intelligibility of speech signal [16,17,18,19].
A reduced-bandwidth Multi Channel Wiener Filter (MWF) based algorithm to restrict the number of signals transmitted between the hearing aids on a binaural link is discussed in [20]. This was achieved by using contra lateral microphone signals. Front contralateral microphone signals (MWF-front), Contra lateral MWF (MWF-contra) and Distributed Binaural MWF scheme (DB-MWF) were discussed. Performance evaluation was based on intelligibility weighted SNR and directivity patterns. The speech sentences were taken from the Hearing- In- Noise Test (HINT) database, noise source used was multi talker babble noise. Single and multiple noise sources with input broadband SNR equal to 0 dB was considered. Results showed that binaural MWF gives the largest SNR of 22 dB. MWF-front resulted in performance degradation by 2-4 dB. The distributed binaural MWF scheme achieves SNR of 21 dB for multiple noise sources.
A binaural noise reduction algorithm based on Speech Distortion Weighted Multichannel wiener filter (SDW-MWF) to achieve binaural cue preservation and noise reduction performance is discussed [21]. Binaural SDW-MWF extensions namely, MWF-η (noise estimation) and MWF-ITF (Interaural transfer function) were proposed to improve the binaural cue preservation. MWF-η algorithm combines the original noise signal with the output signal. Both speech and noise cues were preserved with decreased SNR. The SDW-MWF cost function was extended with the ITFs of the speech and noise component using MWF-ITF algorithm. Performances of these algorithms were measured using SNR improvement, speech and noise ITD errors. The output SNR (5 dB) was similar to the binaural SDW-MWF output SNR. Both noise and speech cues were not preserved at the same time. The performance comparisons of algorithms under reverberant environment condition were carried out. Head Related Transfer Functions (HRTFs) were measured to take the head-shadow effect into account. The sentences from HINT list were taken as speech material. The multitalker babble noise was considered. Results show that the MWF-η algorithm SNR output of 5 dB; the SDW-MWF and MWF-ITF algorithms result in same SNR output of 10 dB at 2.5 KHz, except for a few frequency bins.
An extension for binaural MWF algorithm is proposed by [22] to achieve noise reduction performance by preserving localization cues. The SDW–MWF cost function related to the Interaural Time Difference (ITD) cue of the noise components was defined. The speech and the noise signals were separately recorded at16 kHz sampling frequency. The speech and noise sources were English sentences and multi-talker babble noise. Evaluation was done based on improvement in SNR and the ITD function (mean of the cost function over all frequencies). An experimental result shows that as β (weight factor) increases, ITD (cost function) decreases for noise and hardly increases for speech components.
Usually the noise-reduction algorithms are more effective at high SNRs than at low SNRs [23]. The work presented has investigated whether such SNR dependent effects of noise reduction on intelligibility exists. SNR dependent effects on speech intelligibility were studied for three noise reduction algorithms: Spectral Subtraction (SS), Minimum Mean Square Error Spectral Estimation (MMSE), and Subspace Enhancement Algorithm (SSA). It is assumed that the functions relating SNR to percentage correct scores, called as Psycho Metric Functions (PMF), have sigmoid curve shapes. If the effects of processing are independent of SNR, the PMF should simply shift along the SNR axis as a consequence of noise reduction. Changes in the PMF’s slope are considered as SNR dependent effects. Effects on intelligibility scores were measured for two types of noise (car and babble) over five SNR values. Twenty normalhearing listeners for each algorithm were considered for the listening tests. The speech materials used in the experiments were the University College London (UCL) recordings of the Institute of Electrical and Electronics Engineers (IEEE) sentences. With SS and MMSE, the deteriorating effect of noise reduction was found to be independent of SNR. SSA had no significant deteriorating effects on intelligibility scores at any SNR. Modeling of the results with a sigmoid curve shape psychometric function showed that the degradation in intelligibility scores coincides with a constant shift in SNR.
Speech signal quality enhancement based on Linear Prediction (LP) residual signal was proposed [24]. High SNR regions in input speech corrupted by noise are enhanced selectively in the time and frequency domains. Work was carried out by identifying the speech and noise areas in the time domain. LP residual signal is used to find a frame that belongs to speech and nose part. Using the features of the LP residual signal, the areas of high SNR and low SNR of the input speech signal were determined based on the characteristics of the spectral flatness in short (2 ms) time frames. The spectral flatness information is derived using the ratio of energies in the LP residual signal of the speech and the noisy signal.
Inverse spectral flatness characteristics are used to derive a weight function for the residual signal. The LP residual signal of noisy speech was modified retaining only the 2 ms portions of the residual signal around the instants of excitation. The modified residual signal was used to excite the time-varying all-pole filter to regenerate the speech signal. The resulting speech was significantly enhanced without causing serious distortion. Results reveal that quality of the output speech decreases steadily with the increase of noise level in input signal. This is mainly because speech information is lost in the high noise areas, at lower SNR values.
The performance comparisons of directional (adaptive ) microphone and two stages beam former(adaptive) with fixed directional microphone for hearing aids are discussed [25]. In Adaptive Directional Microphone (ADM), two directional microphones create the (speech and noise) reference signal. In ADM, the delay operation allows obtaining of speech reference at front cardioids (null at 1800) and a noise reference at rear cardioids (null at 00). The speech and noise were given as reference signals to an adaptive noise canceller. Two-stage adaptive beam former (A2B) algorithm uses a directional microphone and an all pass filter to create the noise and the speech reference signal for an Adaptive Noise Cancellation (ANC) Scheme. All pass filter was used to obtain desired delay. The speaker was assumed to be at 00 angle that is in the front position of the listener. Normalized Least Mean Squares procedure (NLMS) was used to find noise and subtracts noise from noisy speech signal. Performance evaluations of algorithms were carried on the Canta7 (Behind the Ear) BTE hearing aids. Perceptual evaluation was done based on Speech Reception Threshold (SRT). Speech material consists of Dutch sentences (male speaker). Noise material is Multi talker Babble (MB) noise. Subjects (Normal hearing) were participated in the evaluation. The directivity index and polar diagrams shows the improved signal to noise ratio was achieved by adaptive beam former compared to ADM and FDM. The directivity indexes at 450 Hz were: FDM (5.9 dB), ADM (5.1 dB) and A2B (8.6 dB). The analysis of polar diagram reveals that the A2B showed improvement of 2 dB at 450 Hz up to 4 dB at 900 Hz than the FDM and ADM. The ADM and the A2B technique showed about 4.4 dB performance improvement than the FDM in the back hemisphere. In contra lateral hemisphere, the A2B showed performance improvement of 1dB than the FDM and the ADM schemes. The Perceptual evaluation showed that the SRT improvements depend on the jammer sound source. For single noise source, at 1800, improvement in speech intelligibility was 7.2 dB for A2B, 3.2 dB for FDM, and 5.3 dB for ADM.
Noise reduction problem in monaural and binaural hearing aids using adaptive noise cancellation schemes are still under development [26,27,28]. Experimental evaluations indicate that these techniques are similar to directional microphone arrays. They give better performance when speech and noise comes from different directions and less reverberation. To obtain improved performance, one possibility is to combine the directional microphone arrays with adaptive noise cancellation scheme [29,30].
Two stages adaptive noise filtering scheme is discussed in [31]. The algorithm was implemented for normal sized BTE hearing aid, equipped with two identical front facing directional microphones, mounted in an end fire configuration. Signal processing was carried out on a Personal Computer (PC) interfaced to Digital Signal Processor (DSP). The algorithm was evaluated using Speech intelligibility test in realistic environment. Normal-hearing and hearing aid users with moderate hearing losses were participated in the test. Open set words and sentences were used as test material. A significant improvement, on an average more than 5 dB, of Speech Reception Threshold (SRT) in background noise of 0 dB SNR was obtained.
Hearing-impaired people have a broader auditory filter [32]. Spectrum representation of the broader auditory filters is very smooth. This causes poor perception of speech by hearing-impaired people. The effect of spectral masking can be reduced by using multiband frequency compression technique. This technique divides the speech spectrum into 18 bands and spectral samples in these analysis bands are compressed by a constant compression factor towards the band centre. The investigation of the effectiveness of the scheme for different compression factors, in improving the speech perception is discussed [33]. Implementation of the algorithm with different types of frequency mappings, bandwidths, and segmentation for processing is presented [34,35]. Even though the technique was found to increase speech perception for subjects with sensorineural hearing loss in quiet, its effectiveness is to be quantified under adverse listening conditions.
Non-uniform multi-band analysis algorithm to reduce noise from noisy speech signal is presented [36]. The algorithm divides the noisy speech signal into a number of sub-bands using a gammatone filter bank and each sub-band signals are weighted using Ephraim and Malah spectral attenuation algorithm and the power spectral subtraction algorithm. Speech samples are taken from the NOIZEUS speech data base which are sampled at 8 KHz and corrupted by different noise sources like babble, car, train and street noise. The speech signals consist of 30 sentences from male and female speakers. The subjective evaluation for car noise at 15 dB shows score of 2.91 for the Ephraim -Malah Gamma tone Filter Bank (EM_GTFB) as compared to 2.77 for EM. The PESQ score for babble noise at 0 dB for SS_GTFB is 1.96 compared to 1.78 for the SS.
From the literature review we may conclude that the problem of noise reduction, localization, and problems associated with SNHL listeners such as reduced dynamic range, spectral and temporal masking has attracted considerable amount of research attention for hearing aids. Hence there should be a mechanism which reduces the background noise along with addressing the adverse effects of SNHL. In our present study we have considered a cascaded structure mechanism which addresses both the noise reduction and SNHL problems, namely reduced dynamic range and increased spectral masking.
-
III. Proposed Work
-
3.1 Wiener Filter
Wiener Filter was first proposed by Norbert Wiener in 1949 [38]. It is typically used in the estimation or
In our proposed work, we have considered cascaded operation of Wiener filter, FBS based dynamic range compression and spectral splitting of speech signal. FBS based dynamic range compression is used to reduce the dynamic range of the speech signal to fit into the reduced dynamic range of the people with sensorineural hearing loss and spectral splitting of signal to overcome the effect of spectral masking [37] and Wiener filter for noise reduction to improve speech perception in the presence of noise.
prediction of a clean speech signal from the noisy speech signal. The filter can be used to remove the unwanted noise to enhance the quality of speech signal. A noisy signal Y(n) can be expressed as shown in equation (1).
Y(n) = x(n) + N(n) (1)
Here x (n) is the clean speech signal and N (n) is the additive noise. It is assumed that noise and speech signal is uncorrelated.
In the frequency domain, the equation (1) can be written as shown in equation (2).
Y(f) = X(f) + N(f) (2)
Where X(f) is the speech signal spectrum and N(f) is the noise spectrum.
The transfer function of the Wiener filter is as shown in equation (3).
W(f) =--- P xxf--- (3)
f (P xx (f)+ P nn (f)) ()
W(f) is the frequency response of the filter, Pxx(f) is the speech signal power spectrum and Pnn(f) is the noise power spectrum. Enhanced speech spectrum is obtained by multiplying the frequency response of the Wiener filter with the noisy speech signal spectrum (as shown in equation 4).
X = Y.* W (4)
Where Y is the noisy speech spectrum and W is the frequency response of the Wiener filter.
-
3.2 VAD Method
-
3.3 Filter Bank Summation Method
A filter bank is an array of band-pass filters that divides the input signal into multiple sub-bands. In our proposed FBS method, frequency bands ranging from 05000Hz are divided into 18 smaller sub-bands, depending on auditory critical bands (as shown in Table 1).
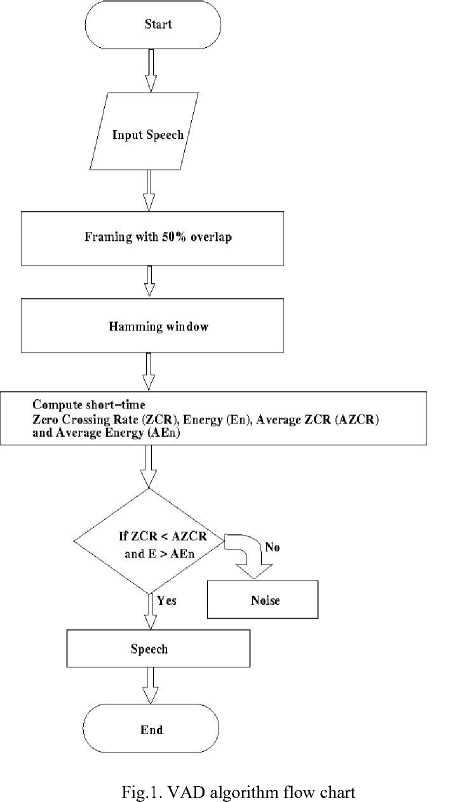
Finding active speech periods within a signal is one of the important problems in speech processing application. The conversational speech is a discontinuous signal consisting of both voice-active and voice-inactive regions.
Linguistic information is present only with voice active region and pauses between these regions are the silence regions. For an audio segment, the decision on these two regions is to be done.
In our proposed algorithm, we have used Voice Activity Detection (VAD) algorithm based on combination of short term energy and zero crossing rates to detect presence or absence of speech. The proposed VAD algorithm is as shown in flowchart Fig. 1.
The filter bank, as shown in Fig. 2, consists of 18 Finite Impulse Response (FIR) band pass filters. The FIR band pass filters were designed using iterative application of frequency sampling technique for the sampling frequency fs = 10 KHz and order N =16. These band pass filters divides the input signal into 18 bands. The outputs of (odd) filter bank were combined to get the signal for left channel and combing the outputs of (even) filter bank gives output for right channel. In our proposed work, we have used constant amplitude compression factor of 0.4, 0.6 and 0.8 to reduce the dynamic range of the speech signal so as to fit into the reduced dynamic range of the people with sensorineural hearing loss.
Table 1. List of Critical Bands along with their Centre frequencies [39]
|
Sl. No. |
Center Frequency (in Hz) |
Frequency Range (in Hz) |
|
1 |
130 |
10-200 |
|
2 |
250 |
200-300 |
|
3 |
350 |
300-400 |
|
4 |
450 |
400-510 |
|
5 |
570 |
510-630 |
|
6 |
700 |
630-770 |
|
7 |
840 |
770-920 |
|
8 |
1000 |
920-1080 |
|
9 |
1170 |
1080-1270 |
|
10 |
1370 |
1270-1480 |
|
11 |
1600 |
1480-1720 |
|
12 |
1860 |
1720-2000 |
|
13 |
2160 |
2000-2320 |
|
14 |
2510 |
2320-2700 |
|
15 |
2920 |
2700-3150 |
|
16 |
3420 |
3150-4000 |
|
17 |
4050 |
3700-4400 |
|
18 |
4700 |
4400-5000 |
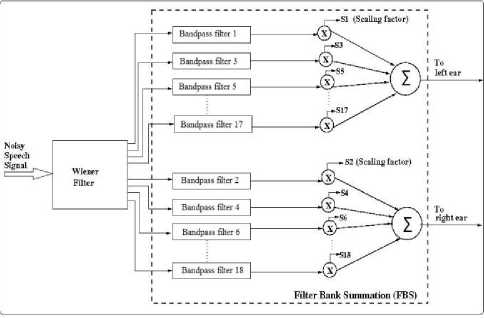
Fig.2. Cascaded structure of Weiner filter and FBS (with DRC and spectral splitting) system
-
3.3.1 Dynamic range compression (DRC)
The dynamic range of hearing is the difference between the hearing threshold level and loudness discomfort level. Cochlear loss, caused mainly due to the loss of outer hair cells, results in the elevation of hearing thresholds with no corresponding increase in loudness discomfort level. This causes reduced dynamic range which distorts loudness relationships among components of speech. This limits the benefit of linear amplification to compensate for the loss of audibility and it can severely affect the overall speech perception. Dynamic range compression (DRC) is a signal processing operation that reduces the overall signal excursion range to the desired value.
Some of the benefits of DRC are:
-
• Restrict the hearing aid output without much distortion,
-
• Reduce the loudness discomfort,
-
• Auditory system damage can be prevented in addition.
-
• Effective usage of the residual dynamic range
-
3.3.2 Spectral splitting
In current study, we have used multiband compression of audio signal which compresses different audio frequency bands separately. First splitting the audio signal into multiple bands and then each band is compressed using a fixed compression factor of 0.4, 0.6 and 0.8. The effect of different compression factor on the dynamic range of the signal is studied.
Sensorineural hearing impaired persons have poor frequency resolution and hence poor speech perception mainly because of increased spectral masking. Hence to improve speech perception, spectral masking effect has to be reduced. This can be achieved by spectral splitting. Speech perception occurs at the central level while masking of spectral components occurs at the peripheral level of auditory system. Splitting the speech signal into two parts with complementary spectral information for binaural dichotic listening and combining the auditory information received from both the ears the adverse effects of frequency masking can be avoided. In our work, input speech is filtered by 18 FIR band pass filters (Filter bank). Frequency responses of the alternate band signals (odd and even numbered bands) were added and given to the left and right ears (i.e., spectral splitting was carried out) that help in reducing the effect of (spectral) masking and hence improves the intelligibility of the speech.
-
IV. Tests and Results
-
4.1 Mean Opinion Score (MOS) test for speech quality
-
4.2 Perceptual Evaluation of Speech Quality (PESQ)
To evaluate the performance of the proposed method, speech quality and intelligibility assessment were conducted for normal and hearing impaired subjects. i) Subjective listening test using Mean Opinion Score (MOS) for the compression factor of 0.6 was obtained for quantifying the speech quality using normal-hearing subjects in the presence of broad band noise. ii) Objective evaluation of speech quality using PESQ measure was carried out for the amplitude compression factors of 0.4, 0.6 and 0.8 and iii) Speech intelligibility assessment using Modified Rhyme Test (MRT) for hearing impaired subjects for the compression factor of 0.6 was carried out in the presence of broad band noise.
In this test six subjects (S1, S2, S3, S4, S5, and S6) with normal hearing (Hearing thresholds less than 20 dB HL) participated in the listening tests. The subjects were asked to listen to the input (unprocessed speech) and the processed output speech and rate the quality of the processed sound with respect to the unprocessed sound on the scale 0 – 5, based on the perceived quality. The rating is selected from 0 to 5 (0 to 0.5 is very bad, 0.5 to 1.5 bad , 1.5 to 3 Good, 3 to 5 excellent). The respective ratings of the subjects for different input SNR’s are as shown in Table 2, Table 3, and Table 4. At higher SNR values, the proposed method works well in removing the noise significantly from noisy speech signal and thereby improving the speech quality. All clean speech samples were taken from the Noizeus Speech database [40] . The input to the proposed algorithm is the clean speech signal from male /female voice. This clean speech is added with white Gaussian noise at different SNR values ranging from -6 dB to 6 dB in steps of 3 dB. VCV syllable /aba/ and sentences were used as the test material. The results of the listening tests showed processed speech MOS scores for the sentences “sky that morning was clear and bright blue” (4.41, 4.2, 3.96, 3.6, 3.08 and 2.66) as compared with unprocessed speech MOS scores (4.53, 1.21, 1.16, 1.06, 0.8, 0.483) for SNR values of ∞ ,+6, +3, 0, -3 and -6 dB respectively, for the compression factor of 0.6. The MOS values for other test material are in similar line. The p value resulted from paired t-test is less than 0.05, indicating the statistical significance of the tests carried out.
Perceptual Evaluation of Speech Quality (PESQ) is an international standard for objective speech quality measurement. It is standardized as ITU-T P.862 PESQ [41]. It is based on cognitive models of the human hearing organ to form pseudo subjective scores.
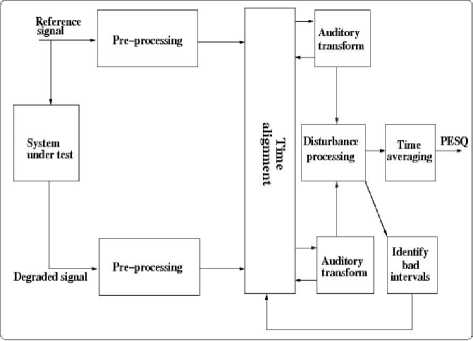
Fig.3. Block diagram of PESQ [41]
PESQ operates on an unprocessed (reference) signal and processed (test) speech signal to compute the perceptual quality of the test w.r.t unprocessed signal. The block diagram of the PESQ is shown below in Fig. 3.
-
4.3 Speech Intelligibility assessment using Modified Rhyme Test (MRT)
-
4.4 Spectrographic Analysis
Intelligibility of the processed speech was evaluated using Modified Rhyme Test (MRT) for subjects with moderate to severe sensorineural loss with the stimuli presented in the presence of broadband noise. Listening test was conducted on six hearing impaired (SNHL) subjects with moderate sensorineural loss. The audiometric thresholds of subjects are given in Table 8. The processed speech signal was given through headphones.
The test material consists 50 sets of monosyllabic words of consonant-vowel-consonant (CVC) form with six words in each set i.e., total of 300 words. Each of the words begins with a sentence “would you write ------”.
All these 300 words were arranged in 6 test lists (1x, 1y, 2x, 2y, 3x, 3y) of 50 words each. The words in each test list were selected by a two level randomization process: (i) the set level 1, 2, 3, and (ii) the word level x, y within a set, in such a way that every word gets presented once.
Each subject with hearing loss responded for a total of 1800 presentations (300 words × 6 SNR conditions). The test was conducted for approximately one or two hours per day for each subject depending on the availability and willingness of the subject.
Results of listening tests conducted on hearing impaired subjects are summarized in Table 9. It shows the average (across the six subjects) speech recognition score (%) for unprocessed speech and the speech processed with different SNR conditions. It can be observed from Table 9 that there is maximum improvement (27.29%, 23.95%, 24.503%, 23.602%, 23.498%) in the speech recognition scores at SNR values of (-6dB, -3dB, 0dB, +3dB, +6dB) compared to unprocessed speech recognition scores. For unprocessed speech, the mean recognition score was about 45.196% for SNR of -6 dB. Table 10 gives the average response times of hearing impaired subjects for different SNR conditions. It can be seen from Table 10 that there is reduction in response time compared to unprocessed speech response times at lower SNR values. The decrease in response times at the SNR values of -6, -3, 0, +3 and+6 dB were 1.581, 1.41, 1.329, 1.279, and 1.01s, respectively. Thus the results of recognition scores and response time show that proposed method enhanced speech perception in the presence of masking noise.
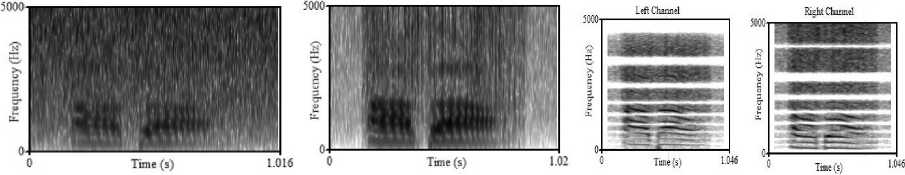
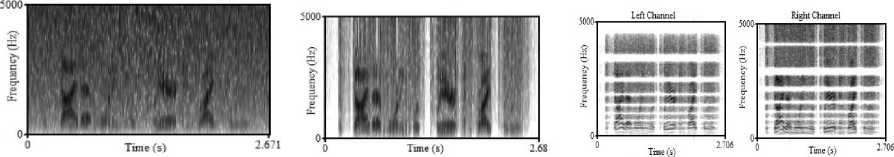
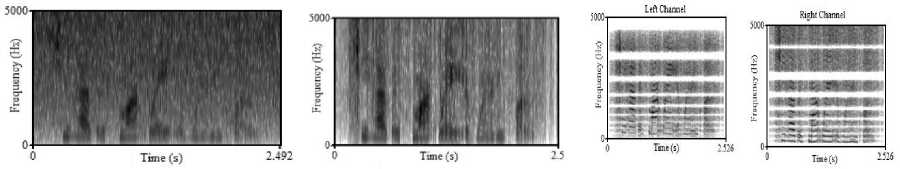
Fig. 4 shows the wide band spectrograms of the VCV utterance /aba/ from a female speaker. Fig. 5 shows the spectrograms for the sentence “the sky that morning was clear and bright blue” from a male speaker. Fig.6 shows the spectrograms for the sentence “she has a smart way of wearing cloths” from a female speaker for SNR value of 3dB.
It can be seen from these spectrograms that the background noise has been significantly reduced for all SNR values. These findings are in conformity with the MOS test results and PESQ scores. The processed speech spectrograms show that there is slight shift in formant locations and the harmonic structure is mostly preserved for all defined compression factors.
Table 2. MOS Score of VCV syllable /aba/ (female)
|
SNR (dB) |
-6 |
-3 |
0 |
3 |
6 |
∞ |
||||||
|
Subjects |
Unproce ssed |
Process ed |
Unproc essed |
Process ed |
Unproce ssed |
Proce ssed |
Unproc essed |
Process ed |
Unproc essed |
Proce ssed |
Unproce ssed |
Process ed |
|
S1 |
0.5 |
2.5 |
0.8 |
2.8 |
1 |
3 |
1 |
3.2 |
1.1 |
3.5 |
4.3 |
4.2 |
|
S2 |
0.4 |
2.5 |
0.7 |
3 |
1.2 |
3.5 |
1 |
3.8 |
1.1 |
4.0 |
4.6 |
4.5 |
|
S3 |
0.3 |
2.8 |
0.8 |
3.2 |
0.9 |
3.8 |
1.2 |
4.0 |
1.2 |
4.0 |
4.5 |
4.3 |
|
S4 |
0.5 |
2.5 |
0.9 |
3.0 |
1 |
3.3 |
1.3 |
3.5 |
1.2 |
4.2 |
4.4 |
4.2 |
|
S5 |
0.4 |
2.7 |
0.7 |
3.3 |
1.3 |
4 |
1 |
4.0 |
1.3 |
4.5 |
4.7 |
4.5 |
|
S6 |
0.6 |
2.7 |
0.9 |
3.1 |
1 |
3.4 |
1.3 |
3.6 |
1.3 |
4.2 |
4.4 |
4.2 |
|
MOS |
0.45 |
2.612 |
0.8 |
3.067 |
1.067 |
3.5 |
1.13 |
3.68 |
1.2 |
4.06 |
4.483 |
4.31 |
|
P-Value |
6.52996E-07 |
8.32637E-07 |
4.1315E-06 |
5.54211E-06 |
7.26776E-07 |
0.000260533 |
||||||
Table 3. MOS Score of “Sky that morning was clear and bright blue” (male)
|
SNR (dB) |
-6 |
-3 |
0 |
3 |
6 |
∞ |
||||||
|
Subjects |
Unproc essed |
Proce ssed |
Unproce ssed |
Process ed |
Unprocess ed |
Processe d |
Unproc essed |
Proce ssed |
Unproce ssed |
Proce ssed |
Unproce ssed |
Proce ssed |
|
S1 |
0.6 |
2.8 |
0.9 |
3 |
1.2 |
3.5 |
1 |
4 |
1.1 |
4.0 |
4.6 |
4.5 |
|
S2 |
0.4 |
2.5 |
0.9 |
2.8 |
1 |
3.5 |
1.2 |
4 |
1.2 |
4.0 |
4.5 |
4.4 |
|
S3 |
0.4 |
2.8 |
0.7 |
3.3 |
0.8 |
3.8 |
1.2 |
4.2 |
1.3 |
4.2 |
4.4 |
4.3 |
|
S4 |
0.5 |
2.4 |
0.8 |
3.2 |
1.2 |
3.5 |
1.3 |
3.6 |
1.2 |
4.5 |
4.6 |
4.5 |
|
S5 |
0.4 |
3 |
0.7 |
3.4 |
1.3 |
3.8 |
1.1 |
3.8 |
1.3 |
4.5 |
4.6 |
4.4 |
|
S6 |
0.6 |
2.5 |
0.8 |
2.8 |
0.9 |
3.5 |
1.2 |
4.2 |
1.2 |
4.0 |
4.5 |
4.4 |
|
MOS |
0.483 |
2.66 |
0.8 |
3.08 |
1.06 |
3.6 |
1.16 |
3.96 |
1.21 |
4.2 |
4.53 |
4.41 |
|
P-Value |
3.54266E-06 |
6.65365E-06 |
1.16194E-06 |
9.78703E-07 |
2.01101E-07 |
0.000458 |
||||||
Table 4. MOS Score of “She has a smart way of wearing cloths” (female)
|
SNR (dB) |
-6 |
-3 |
0 |
3 |
6 |
∞ |
||||||
|
Subject s |
Unproc essed |
Proce ssed |
Unproc essed |
Processe d |
Unproce ssed |
Processe d |
Unproc essed |
Proce ssed |
Unproc essed |
Process ed |
Unproc essed |
Process ed |
|
S1 |
0.4 |
2.5 |
0.5 |
3 |
1.1 |
3.3 |
1.2 |
3.7 |
1.2 |
4.2 |
4.5 |
4.3 |
|
S2 |
0.5 |
2.5 |
0.7 |
2.8 |
1.2 |
3.8 |
1.3 |
4.1 |
1.2 |
4.2 |
4.5 |
4.3 |
|
S3 |
0.5 |
2.7 |
0.5 |
2.7 |
1 |
3.3 |
1.2 |
3.9 |
1.3 |
4 |
4.4 |
4.3 |
|
S4 |
0.4 |
2.6 |
0.6 |
3 |
1.3 |
3.5 |
1.2 |
3.8 |
1.1 |
4.0 |
4.5 |
4.0 |
|
S5 |
0.5 |
2.6 |
0.7 |
2.6 |
1.1 |
4 |
1.3 |
3.8 |
1.1 |
4.1 |
4.5 |
4.2 |
|
S6 |
0.6 |
2.6 |
0.6 |
2.8 |
0.8 |
3.3 |
1.1 |
3.9 |
1.2 |
4 |
4.4 |
4.3 |
|
MOS |
0.483 |
2.583 |
0.6 |
2.816 |
1.083 |
3.533 |
1.22 |
3.86 |
1.183 |
4.08 |
4.46 |
4.23 |
|
P-Value |
1.50355E-08 |
8.81478E-07 |
1.83686E-06 |
4.07807E-08 |
1.69329E-08 |
0.006338 |
||||||
Table 5. PESQ score of wiener filter and wiener filter cascaded with FBS based spectral splitting and DRC for VCV syllable /aba/; (female), Duration: 1.016 (Sec)
|
SNR (dB) |
Wiener Filter PESQ score |
Compression factor ( C ) |
Left Channel |
Right Channel |
|
∞ |
4.5 |
0.8 |
4.1214 |
4.1284 |
|
0.6 |
4.1300 |
4.1365 |
||
|
0.4 |
4.1484 |
4.1508 |
||
|
+6 |
2.6242 |
0.8 |
3.0638 |
3.0760 |
|
0.6 |
3.0618 |
3.0781 |
||
|
0.4 |
3.0698 |
3.0840 |
||
|
+3 |
2.4846 |
0.8 |
2.8287 |
2.8563 |
|
0.6 |
2.8300 |
2.8585 |
||
|
0.4 |
2.8399 |
2.8600 |
||
|
0 |
2.3308 |
0.8 |
2.5804 |
2.6049 |
|
0.6 |
2.5803 |
2.6049 |
||
|
0.4 |
2.5826 |
2.6059 |
||
|
-3 |
2.0645 |
0.8 |
2.2161 |
2.2645 |
|
0.6 |
2.2164 |
2.2648 |
||
|
0.4 |
2.2168 |
2.2662 |
||
|
-6 |
1.9925 |
0.8 |
2.0846 |
2.1300 |
|
0.6 |
2.0843 |
2.1312 |
||
|
0.4 |
2.0840 |
2.1324 |
Table 6. PESQ score of wiener filter and wiener filter cascaded with FBS based spectral splitting and DRC for a sentence “Sky that morning was clear and bright blue” (male), Duration: 2.671 (Sec)
|
SNR (dB) |
Wiener Filter PESQ score |
Compression factor ( C ) |
Left Channel |
Right Channel |
|
∞ |
4.2157 |
0.8 |
2.6181 |
2.5876 |
|
0.6 |
2.6192 |
2.5889 |
||
|
0.4 |
2.6216 |
2.5914 |
||
|
+6 |
3.4494 |
0.8 |
2.3827 |
2.3002 |
|
0.6 |
2.5355 |
2.3001 |
||
|
0.4 |
2.4908 |
2.3002 |
||
|
+3 |
3.4331 |
0.8 |
2.5514 |
2.2819 |
|
0.6 |
2.5646 |
2.3714 |
||
|
0.4 |
2.5372 |
2.3681 |
||
|
0 |
3.4143 |
0.8 |
2.5507 |
2.4711 |
|
0.6 |
2.5513 |
2.4710 |
||
|
0.4 |
2.5510 |
2.4706 |
||
|
-3 |
2.3480 |
0.8 |
2.5230 |
2.2630 |
|
0.6 |
2.5221 |
2.3636 |
||
|
0.4 |
2.4839 |
2.2600 |
||
|
-6 |
2.1892 |
0.8 |
2.2698 |
2.4716 |
|
0.6 |
2.4309 |
2.4712 |
||
|
0.4 |
2.2699 |
2.4709 |
Table 7. PESQ score of wiener filter and wiener filter cascaded with FBS based spectral splitting and DRC for a sentence “She has a smart way of wearing cloths” (female), Duration: 2.492 (Sec)
|
SNR (dB) |
Wiener Filter PESQ score |
Compression factor (C) |
Left Channel |
Right Channel |
|
∞ |
3.1490 |
0.8 |
2.7137 |
2.7144 |
|
0.6 |
2.7202 |
2.7046 |
||
|
0.4 |
2.8555 |
2.6466 |
||
|
+6 |
2.4336 |
0.8 |
2.6510 |
2.7031 |
|
0.6 |
2.7682 |
2.7001 |
||
|
0.4 |
2.7484 |
2.7290 |
||
|
+3 |
2.4592 |
0.8 |
2.7501 |
2.6350 |
|
0.6 |
2.7506 |
2.6780 |
||
|
0.4 |
2.7252 |
2.6354 |
||
|
0 |
2.5589 |
0.8 |
2.9492 |
2.8829 |
|
0.6 |
2.9490 |
2.7829 |
||
|
0.4 |
2.9486 |
2.6333 |
||
|
-3 |
1.5331 |
0.8 |
1.8131 |
1.6592 |
|
0.6 |
1.8142 |
1.6701 |
||
|
0.4 |
1.8116 |
1.6548 |
||
|
-6 |
1.3887 |
0.8 |
1.5200 |
1.6659 |
|
0.6 |
1.5204 |
1.6678 |
||
|
0.4 |
1.5200 |
1.6659 |
Table 8. Audiometric threshold for the subjects with moderate SNHL
|
Subject |
Ear |
Hearing threshold (dB HL ) |
||||||
|
Frequency(KHz) |
||||||||
|
0.25 |
0.5 |
1.0 |
2.0 |
4.0 |
6.0 |
8.0 |
||
|
S1 |
RIGHT |
38 |
38 |
40 |
40 |
50 |
60 |
70 |
|
LEFT |
28 |
28 |
30 |
31 |
40 |
45 |
50 |
|
|
S2 |
RIGHT |
55 |
52 |
55 |
60 |
68 |
72 |
80 |
|
LEFT |
50 |
50 |
50 |
50 |
60 |
62 |
75 |
|
|
S3 |
RIGHT |
60 |
60 |
62 |
69 |
75 |
80 |
90 |
|
LEFT |
50 |
50 |
50 |
52 |
58 |
65 |
70 |
|
|
S4 |
RIGHT |
60 |
60 |
58 |
58 |
69 |
60 |
65 |
|
LEFT |
62 |
60 |
58 |
58 |
60 |
64 |
68 |
|
|
S5 |
LEFT |
28 |
28 |
29 |
30 |
38 |
45 |
45 |
|
RIGHT |
38 |
38 |
40 |
40 |
48 |
60 |
60 |
|
|
S6 |
RIGHT |
48 |
50 |
50 |
55 |
60 |
65 |
70 |
|
LEFT |
60 |
58 |
60 |
60 |
65 |
70 |
80 |
|
Table 9. Speech Recognition Scores (SRS %) for hearing impaired subjects, for 6 SNR conditions and for compression factor of 0.6
|
subject |
Speech Recognition Score (%) |
|||||||||||
|
SNR(dB) |
||||||||||||
|
∞dB |
+6dB |
+3dB |
0dB |
-3dB |
-6dB |
|||||||
|
Unproce ssed |
Proces sed |
Unproce ssed |
Process ed |
Unproce ssed |
Process ed |
Unproce ssed |
Process ed |
Unproce ssed |
Proce ssed |
Unproce ssed |
Process ed |
|
|
S1 |
95 |
93.6 |
62 |
93 |
59.3 |
92.6 |
51.6 |
81.6 |
50 |
78 |
45.6 |
72.6 |
|
S2 |
95.66 |
94.67 |
56.33 |
82 |
55.66 |
76.3 |
50.33 |
74 |
46.66 |
70.33 |
42.33 |
66 |
|
S3 |
87.33 |
85.33 |
53.33 |
78.33 |
53 |
74 |
48.66 |
70.33 |
47 |
68.66 |
41.66 |
66.66 |
|
S4 |
88.66 |
93.66 |
56.66 |
83.66 |
52.33 |
80 |
51.66 |
75.33 |
50.33 |
72.33 |
44.33 |
67.66 |
|
S5 |
96.66 |
95.66 |
74 |
89.66 |
71.66 |
86.66 |
56.66 |
78.33 |
54 |
75 |
52.66 |
84.66 |
|
S6 |
87 |
84.6 |
66 |
82.66 |
52 |
76 |
48 |
74.33 |
45.33 |
72.66 |
44.6 |
75.33 |
|
Mean |
91.71 |
91.25 |
61.38 |
84.885 |
57.325 |
80.926 |
51.15 |
75.653 |
48.88 |
72.83 |
45.196 |
72.495 |
|
% Improvement |
-0.46 |
23.498 |
23.602 |
24.503 |
23.95 |
27.299 |
||||||
Table 10. Response Time (Secs) for hearing impaired subjects, for 6 SNR conditions and for compression factor of 0.6
|
subject |
Response Time (Secs) |
|||||||||||
|
SNR(dB) |
||||||||||||
|
∞dB |
+6dB |
+3dB |
0dB |
-3dB |
-6dB |
|||||||
|
Unproces sed |
Process ed |
Unproc essed |
Process ed |
Unproce ssed |
Process ed |
Unproce ssed |
Process ed |
Unproc essed |
Process ed |
Unproc essed |
Process ed |
|
|
S1 |
1.2593 |
1.3689 |
2.7178 |
1.255 |
3.4901 |
1.5874 |
3.6915 |
2.1667 |
3.7409 |
2.5968 |
4.3149 |
2.4397 |
|
S2 |
1.7585 |
1.8553 |
2.8874 |
1.1334 |
3.1394 |
1.5421 |
3.6083 |
1.8593 |
3.264 |
2.1238 |
3.0615 |
2.5968 |
|
S3 |
1.6587 |
1.6738 |
2.7772 |
1.8157 |
3.2874 |
2.0655 |
2.9725 |
2.1687 |
3.524 |
2.2684 |
3.873 |
2.5031 |
|
S4 |
1.272 |
1.3609 |
2.7499 |
2.0499 |
2.9187 |
1.7679 |
2.9857 |
1.9757 |
3.8287 |
1.8287 |
3.9622 |
2.3545 |
|
S5 |
2.3402 |
2.2736 |
2.5661 |
2.0462 |
3.115 |
1.8795 |
3.2322 |
1.7582 |
3.2826 |
1.6486 |
3.7336 |
1.5939 |
|
S6 |
1.8572 |
2.0265 |
2.8745 |
2.2109 |
3.314 |
2.752 |
3.402 |
1.9863 |
3.632 |
2.3472 |
4.1303 |
2.102 |
|
Mean |
1.691 |
1.759 |
2.762 |
1.752 |
3.211 |
1.932 |
3.315 |
1.986 |
3.545 |
2.135 |
3.846 |
2.265 |
|
Improvement |
0.068 |
1.01 |
1.279 |
1.329 |
1.41 |
1.581 |
||||||
(a)
(b)
(c)
Fig.4. Wide band Spectrograms of the VCV syllable /aba/: a) Unprocessed b) Processed by wiener filter and c) Processed by wiener filter cascaded with FBS based spectral splitting and DRC
(a) (b) (c)
Fig.5. Wide band Spectrograms of the sentence “Sky that morning was clear and bright blue” (male): a) Unprocessed b) Processed by wiener filter only and c) Processed by wiener filter cascaded with FBS based spectral splitting and DRC
(a)
(b)
(c)
Fig.6. Wide band Spectrograms of the sentence “She has a smart way of wearing cloths” (female): a) Unprocessed b) Processed by wiener filter and c) Processed by wiener filter cascaded with FBS based spectral splitting and DRC
-
V. Discussion
Many experiments have been conducted in the earlier studies to evaluate the performance of hearing aid algorithms under different combinations of noise reduction algorithms. For Combining noise reduction and hearing aid algorithms, it is necessary to reduce the noise without affecting the advantage obtained by hearing aid algorithm. The objective of the noise reduction algorithm in speech and noise scenarios is to reduce the noise to a maximum extent while minimizing speech distortion. The DRC is designed to amplify sounds based on their intensity level and chosen compression characteristic.
An integrated approach of noise reduction and DRC in hearing aids using multi-microphone noise reduction scheme based on Generalized Side lobe Canceller (GSC) that consists of a fixed spatial pre-processor and a multichannel Adaptive Noise Canceller (ANC) was discussed by [42]. The main objective of this study was to analyze and verify if there are any undesired interaction effects between the noise reduction and the DRC. To assess the noise reduction performance, the intelligibility-weighted SNR was used. For measuring the signal distortion a frequency-weighted log-spectral signal distortion (SD) was used. Results of this work suggest that integration of noise reduction and DRC have shown improvement in SNR of 10dB and reduction in speech distortion around 1dB was observed for 0dB input SNR, for the compression ratio of 2.
Based on the earlier works and results obtained from these works, we have proposed cascaded structure of noise reduction; FBS based spectral splitting and DRC to test the performance of noise reduction algorithm when combined with the hearing aid algorithm.
Our work is mainly based on the usage of FBS approach to study the combined effect of (i) dichotic spectral splitting by providing alternate bands to the left and right channels, and dynamic range compression using fixed compression factor, and (ii) noise reduction based on wiener filter. Major advantage of the proposed scheme is in the use of FBS approach, which gives a convenient way of selecting the suitable parameters such as gain, compression factor etc for different bands, based on the perceptual importance of the auditory information present in each of the bands. Using cascaded structure of noise reduction and spectral splitting along with DRC using FBS method, improvement in speech perception under adverse listening conditions is achieved by reducing the adverse effects of spectral masking and reduced dynamic range associated with SNHL listeners.
We have evaluated our work thoroughly with both subjective and objective measures. Speech quality test using MOS and intelligibility test using MRT was conducted. Objective analysis was also done using PESQ. Speech intelligibility assessment for hearing impaired using MRT was conducted. The test material consists of 50 sets of monosyllabic words of CVC form with six words in each set. Each of the words begins with a sentence “would you write ------”. Each subject with hearing loss responded for a total of 1800 presentations (300 words × 6 SNR conditions). Results of the test showed maximum improvement in speech recognition score (27.29%) and reduction in response time of (1.581) at lower SNR value of -6dB compared to unprocessed speech, indicating the improvement in intelligibility of speech for different SNR conditions. For Subjective and objective assessment VCV syllable /aba/ and sentences were used as the test material. MOS scores for processed speech sentence “sky that morning was clear and bright blue” (4.41, 4.2, 3.96, 3.6, 3.08 and 2.66) as compared with unprocessed speech MOS scores ( 4.53, 1.21, 1.16, 1.06, 0.8, 0.483) for SNR values of ∞, +6, +3, 0, -3 and -6 dB respectively, and PESQ values (Left Channel: 2.6192, 2.5355, 2.5646, 2.5513, 2.5221, and 2.4309; Right Channel: 2.5889, 2.3001, 2.3714, 2.4710, 2.3636, and 2.4712) for SNR values of ∞, +6, +3, 0, -3 and -6 dB respectively, indicating the improvement in the perceived quality for different SNR conditions. The improvements obtained from the proposed method are statistically significant with p value less than 0.05.
-
VI. Conclusions
Subjective listening tests (using MOS and MRT) and objective assessment (using PESQ) were conducted to evaluate the effectiveness of the proposed cascaded scheme of wiener filter followed by spectral splitting (using FBS method) and amplitude compression. Results suggests that maximum improvement in speech recognition score (27.29%) and reduction in response time of (1.581) were obtained at lower SNR values (-6dB) compared to unprocessed speech, indicating the improvement in intelligibility of speech for different SNR conditions. Further performance evaluation of the proposed method using different noise reduction techniques and for different amplitude compression factors needs to be carried out and have to find the optimal noise reduction technique suitable for hearing aids.
Acknowledgements
We are very much thankful to reviewers for useful comments.
References Wiener filter based noise reduction algorithm with perceptual post filtering for hearing aids
- Sunitha, S. L., & Udayashankara, V. (2011). A Practical approach: Adaptive filtering for sensorineural hearing impairment. International Journal of Advanced Biotechnology and Research, 2(1), 183-189.
- Yang, L., & Philipos C. L. (2008). A geometric approach to spectral subtraction, Speech Communication, 50(1), 453-466.
- Cornelis, B., Moonen, M., & Wouters, J., (2011). Performance analysis of multichannel Wiener filter based noise reduction in hearing aids under second order statistics estimation errors. IEEE Transactions on Audio, Speech, and Language Processing, 19 (5), 1368–1381.
- Zhang, M., & Er. M. H. (1995). Adaptive beamforming by microphone array. IEEE Global Telecommunications Conference, 1, 163-167.
- Nathaniel, A., Whitma1 & Janet C., R. (1994). Noise reduction algorithms for digital hearing aids. IEEE 16th Annual International Conference on Engineering Advances: New Opportunities for Biomedical Engineers, 1294-1295.
- Sid, P. B. (2006). Auditory compression and hearing loss. Acoustics Today, 2 (2), 30.
- Jingdong C., Jacob B., Yiteng H., & Simon D. (2006). New insights into the noise reduction wiener filter. IEEE Transactions on Audio, Speech, and Language Processing, 14(4).
- Luts, H., Maj, J. B., Soede, W., & Wouters, J. (2004). Better speech perception in noise with an assistive multimicrophone array for hearing aids. Ear Hearing, 25(1), 411–420.
- Cornelis, B., Moonen, M., & Wouters, J. (2010). Binaural cue preservation in binaural hearing aids with reduced-bandwidth multichannel Wiener filter based noise reduction. International Workshop on Acoustic Echo and Noise Control.
- Chatlani, N., Fischer, E., & Soraghan, J. (2010). Spatial noise reduction in binaural hearing aids. European Signal Processing Conference.
- Cornelis, B., Moonen, M., & Wouters, J. (2011). A VAD-robust multichannel wiener filter algorithm for noise reduction in hearing aids. IEEE International Conference on Acoustics, Speech, and Signal Processing, 281–284.
- Cornelis, B., Moonen, M., & Wouters, J. (2009). Comparison of frequency domain noise reduction strategies based on multichannel wiener filtering and spatial prediction. IEEE International Conference on Acoustics, Speech, and Signal Processing, 129–132.
- Bernard, W., & Fa-Long, L., (2003). Microphone arrays for hearing aids: An overview. Speech Communication, 39, 139–146.
- Emanuel, A. P., Habets & Jacob B. (2013). A two-stage beam forming approach for noise reduction and dereverberation. IEEE Transactions on Audio, Speech and language processing, 21(5).
- Volkmar., H. (2002). Comparison of advanced monaural and binaural noise reduction algorithms for hearing aids. IEEE International Conference on Acoustics, Speech, and Signal Processing, 4008 – 4011.
- Hendriks, R. C., & Gerkmann, T. (2011). Estimation of the noise correlation matrix. IEEE International Conference on Acoustics, Speech, and Signal Processing, 4740–4743.
- Doclo, S., & Moonen, M. (2005). On the output SNR of the speech-distortion weighted multichannel wiener filter. IEEE Signal Processing Letters, 12, 809–811.
- Doclo, S., Spriet, A., Wouters, J., & Moonen, M. (2007). Frequency-domain criterion for speech distortion weighted multichannel wiener filter for robust noise reduction. Speech Communication, 49 (8), 636–656.
- Klasen, T., Van den Bogaert, T., Moonen, M., & Wouters, J. (2005). Preservation of interaural time delay for binaural hearing aids through multichannel wiener filtering based noise reduction. IEEE International Conference on Acoustics Speech and Signal Processing, 29-32.
- Simon, D., Van den Bogaert, T., Wouters, J., & Moonen, M. (2007). Comparison of reduced–bandwidth MWF based noise reduction algorithms for binaural hearing aids. IEEE Workshop on Applications of Signal Processing to Audio and Acoustics.
- Cornelis, B., Doclo, S., Van den Bogaert, T., Wouters, J., & Moonen, M. (2010). Theoretical analysis of binaural multi-microphone noise reduction techniques. IEEE Tranactions on Audio, Speech and Language Processing, 18 (2), 342-355.
- Doclo, S., Dong, R., Klasen, T. J., Wouters, J., Haykin, S., & Moonen, M. (2005). Extension of the multi-channel Wiener Filter with ITD cues for noise reduction in binaural hearing aids. IEEE Workshop on Applications of Signal Processing to Audio and Acoustics, 70-73.
- Hilkhuysen, G., Gaubitch, N., Brookes, M., & Huckvale, M. (2012). Effects of noise suppression on intelligibility: Dependency on signal-to-noise ratios. Journal of Acoustical Society of America, 131(1), 531-539.
- Yegnanarayana, B., Carlos, A., Hynek, H., & Satyanarayana Murthy, P. (1999). Speech enhancement using linear prediction residual. Speech Communication, 28(1), 25-42.
- Jean-Baptiste, M., Liesbeth, R., Jan, W., & Marc, M. (2006). Comparison of adaptive noise reduction algorithms in dual microphone hearing aids. Speech Communication, 48(8), 957-970.
- Hu, Y., & Loizou, P. (2007). A comparative intelligibility study of single-microphone noise reduction algorithms. Journal of Acoustical Society of America, 122(3), 1777–1786.
- Chen, J., Benesty, J., & Huang, Y. (2008). A minimum distortion noise reduction algorithm with multiple microphones. IEEE Transactions on Audio, Speech, and Language Processing, 16(3), 481–493.
- Chen, J., Benesty, J., Huang, Y., & Doclo, S. (2006). New insights into the noise reduction Wiener filter. IEEE Transactions on Audio, Speech, and Language Processing, 14(4), 1218–1234.
- Kim, G., Lu, Y., Hu, Y., & Loizou, P. (2009). An algorithm that improves speech intelligibility in noise for normal-hearing listeners. Journal of the Acoustical Society of America, 126(3), 1486-1494.
- Dendrinos, M., Bakamidis, S., & Carayannis, G. (1991). Speech enhancement from noise: A regenerative approach. Speech Communication, 10(2), 45–57.
- Jeff, V., B., & Jan, W. (1998). An adaptive noise canceller for hearing aids using two nearby microphones. Journal of Acoustical Society of America, 103(6), 3621-3626.
- Glasberg, B., R., & Moore, B., C., J. (1986). Auditory filter shapes in subjects with unilateral and bilateral cochlear impairments, Journal of Acoustical Society of America, 79(1), 1020-1033.
- Kulkarni, P., N., Pandey, P., C., & Jangamashetti, D., S. (2009). Multi-band frequency compression for sensorineural hearing impairment. 16th IEEE International Conference on Digital Signal Processing, 322-327.
- Kulkarni, P., N., Pandey, P., C., & Jangamashetti, D., S. (2009). Multi-band frequency compression for reducing the effects of spectral masking. International Journal of Speech Technology, 10(4), 219-227.
- Kulkarni, P., N., Pandey, P., C., & Jangamashetti, D., S. (2012). Multi-band frequency compression for improving speech perception by listeners with moderate sensorineural hearing loss. Speech Communication, 5(3), 341-350.
- Novlene, Z., Zied, L., Noureddine, E. (2009). Speech enhancement using auditory spectral attenuation. 17th European Signal Processing Conference.
- Kulkarni, P., N., & Pandey, P., C. (2006). Perceptually balanced filter response for binaural dichotic presentation to reduce the effect of spectral masking. Journal of Acoustical Society of America, 120(5), 32-53.
- Abd El-Fattah, M., A., Dessouky, M., I., Diab, S., M., & Abd El-samie, F., E. (2008). Speech enhancement using an adaptive wiener filtering approach. Progress in Electromagnetics Research. l4, 167-184.
- Zwicker, E. W. (1961). Subdivision of audible frequency range into critical bands (Freqenzgruppen). Journal of Acoustical Society of America, 33(2), 248-248.
- Noisy Speech Corpus, http://ecs.utdallas.edu/loizou/speech/noizeus
- Loizou, P. C., (2007). Speech enhancement: Theory and practice. CRC Press, 2007.
- Kim Ngo, Simon Doclo, Ann Spriet, Marc Moonen, Jan Wouters and Soren Holdt Jensen. (2008). An integrated approach for noise reduction and dynamic range compressionin hearing aids, 16th European Signal Processing Conference , Lausanne, Switzerland, August 25-29, 2008.
