WOA Enabled Fuzzy-C-Means Segmentation for Accurate Detection of Polycystic Kidney Disease

Author: S. Helora Padmini, C. Sujatha
Journal: International Journal of Image, Graphics and Signal Processing @ijigsp
Article in issue: 6 vol.16, 2024.
Free access
Polycystic Kidney disease (PKD) is often caused due to inherited condition and it forms many cysts around the kidney, and it is damaged when it grow. Accurate segmentation of PKD is very crucial for a persistent MRI diagnostics. Because many people have no symptoms, they can lead to complications until the surgery is done to remove the cyst. Methods: For accurate detection PKD, the heap of MRI images have been considered, In this work, A novel method includes feature based Fuzzy C means (FFCM) with whale optimization algorithm (WOA) for accurate segmentation of kidney cyst. WOA is used to optimally attach the cluster centroids of FCM. In the conventional methods like mountain models and fuzzy C-shells models are used to identify the regions of interest (ROI). Result: The outcomes of FFCM and WOA based process are compared with the results from existing methods using IB-FCM and Fuzzy K-means and FCM model. Conclusion: However, an exact boundary of the region is obtained and computed an experimental dispersal of the image by Feature extraction based Fuzzy C-Means Clustering segmentation. A detection process is based on the FFCM and WOA segmentation is accomplished to discriminate the normal cyst and the kidney disease. The experimental evaluation is accomplished through the use of Ischemic kidney Disease (IKD) database.
Kidney Segmentation, Feature Based Fuzzy-C-Means, Feature Extraction
Short address: https://sciup.org/15019570
IDR: 15019570 | DOI: 10.5815/ijigsp.2024.06.07
Text of the scientific article WOA Enabled Fuzzy-C-Means Segmentation for Accurate Detection of Polycystic Kidney Disease
Polycystic Kidney disease (PKD) affects the kidney and lead to complications and hospitalization. PKD forms several cyst clusters, which happens a kidney to enlarge and lose over function in due time. The symptoms are high blood pressure and back pain. It is an inherited disease which involves bilateral kidneys. PKD should be identified in earlier stage, because symptoms may not visibly appear until late stages of cyst development. Radiological imaging method like Magnetic Resonance Imaging (MRI) of the patient is used to detect and diagnose the PKD. PKD is categorized into two major classifications such as Autosomal dominant PKD (ADPKD) and Autosomal recessive PKD (ARPKD). ADPKD patients affected but not that much of ARPKD They lead a normal life; conversely, ARPKD can cause kidney dysfunction and leads to kidney failure. The removal cyst is the remedial measure to reduce the rigorousness of the disease. The early detection of a disease is based on the accurate segmentation of MRI probe. Although many algorithms are proposed to solve the medical imaging segmentation, but still it remains a challenging task in computer vision. Unified framework for achieving fast image segmentation is still in research. There are two reasons for the difficulty in medical image segmentation one is that the medical imaging is a multi-solution problem and another is complexity due to to noising effect and intensity non-uniformity. Renal column, renal cortex, renal medulla and renal pelvis are the major segments to discover the kidney disease. Feature extraction is needed to provide remarkable attributes, histogram characteristics, geometric features and gray level attributes. The probe image segmentation algorithms is constructed on a kernel fuzzy C-means, But the feature based FCM implemented with superpixel information which will improve the efficacy of image segmentation.
There are existing algorithms like FB-K means, IB-FCM and IB-K-Means. Several identification tools are available for imaging analysis such as ITK, FSL, GIMIAS and Elastix etc. The authors in [1] proposed an exacting imaging acquisition system to identify and analyze kidney segmentation based on diverse processing. The authors in [2] suggested a complex valued implied shape model to identify 3D shape model. The model offered anatomical knowledge to the non-medical observers. A fully automatic method is suggested in [3] to identify four distinctive components of kidney. They used modified random forest (MRF) method to segment and analyze through localization phase. An effective model-based methodology is proposed in [4] for segmenting abdominal CT images. Clinical diagnosis and extraction is produced through the location of the spine, elliptic region and adaptive region. In [5] higher end spatial communication is provided to show the regional attributes and tissue classification. .FPGA based CAD system is proposed in [6] to pre-processing, de-noise and segmentation. The Multi-Layer perceptron (MLP) is used to train the extracted features and to classify the image with PKD and without PKD. In [7] a refine method is utilized to do fine segmentation. The coarse segmentation is based on spatial information and K-means fuzzy. Refined segmentation is grounded on Improved Grow Cut (IGC) algorithm. A graph-cuts method is suggested segmentation in US images by mixing texture information and image intensity information [8-10]. Deep CNN and U-Net are demonstrated in recent works, but it is time consuming and computational complexity when the number of layers is increased [11-16]. Although a diversity of approaches have been implemented, many works resolve the kidney segmentation problem as a boundary detection problem Classical FCM frequently loss spatial information resulted in poor performance for image segmentation In this work WOA inspired by the humpback’s social behavior of whales. The contributions are listed as
• To develop PKD detection system by implementing a feature based Fuzzy C--means clustering (FFCM) enhanced with WOA for enhancing centroid for segmentation and detection.
• To optimize the segmentation process with the whale optimization algorithm to do fitness value for the accurateness in IKD database MRI images.
• To compare the experimental results with prevailing methodologies refereed in previous research so as to enable the prominence of the suggested PKD detection system
2. Materials and Methods2.1 PKD Image Preprocessing
The work is organized as follows. The proposed PKD detection method for diagnosing PKD is illustrated in Section 2. The experimental findings and a comparison with the current approaches are available in Section 3. The conclusion part of the paper is in Section 4.
The articulation of Proposed PKD system using Optimal WOA feature with FFCM segmentation algorithm is detailed below Fig. 1. Initially the probe images are converted into blocks and all the attributes are detached so that FFCM features are optimally joins the group centroids using WOA. The centroid function is considered to show the intensity of MRI of kidney cyst. Here, the tumor/cyst segment from the normal and abnormal types of kidney clustered segment, the suggested PKD system is articulated.
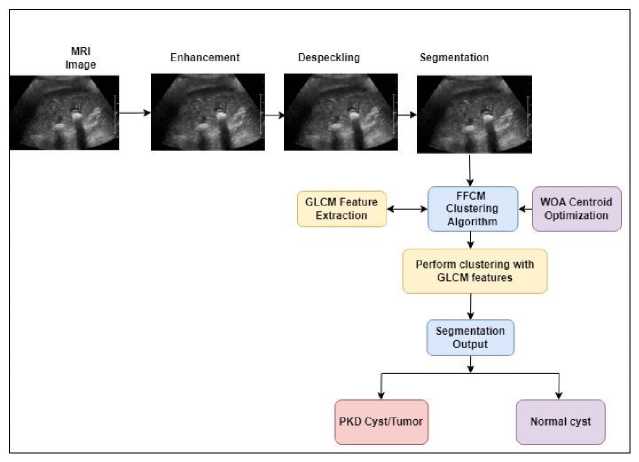
Fig. 1. Articulation of PKD system
Medical Image Preprocessing is a vital part of diagnosis and detection of disease. The main aim is to enhance the quality and to eliminate the removable noise. The image enhancement and de-speckling are the two preliminaries in preprocessing. To enhance the quality of kidney images, a sigmoid filter is used. The input image is considered as H and then sigmoid filter is applied. The mathematical representation is as follows
^Enh (Hmax Hmin) ^ iT^ri (1)
1+е v +нт[п
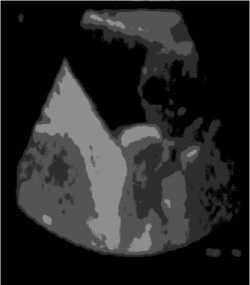
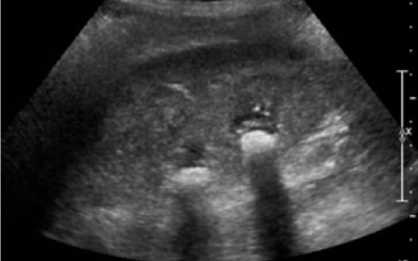
The enhanced version of an input image is H Enh . The minimum and maximum gray scale image is represented as Нтах & mmln. a and y are the parameters to represent the center and width of the image. The preprocessed image is shown in Figure 2.
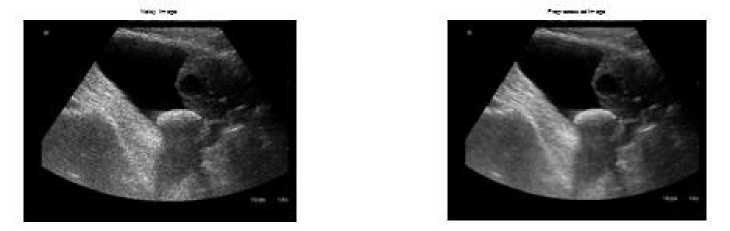
Fig. 2. MRI Noisy Image and preprocessed Image
After preprocessing, bilateral filter is proposed for despeckling. This kind of speckle noise and analyzes its performance.
x(t) = Zs en(t) W ( s,t ) z(s)
Assuming the multiplicative model z(t) = x(t)u(t) with x(t) and z( t) are the true and observed intensity values of pixel t. u( t) is the gamma random variable and the weighted average of predictors z(s) is drawn from a small neighborhood Ω(t). The weight associated with the predictor is given us to prevent over-filtering.
w (s,t) = Cexp{—a\\s — t\\2 + Aodo[o(s),o(t)] — Asds[z(s),z(t)])
The normalizing constant is C and the weights ЛO,AS depend on spatial distance as well as amplitude distance. The normalized Euclidean distance is computed as
d о (s,t) = -^L ^ ke p [O i (s + k} — O i ( t + k)]2
M is the number of bands. p is the patch size t is the patch center in spatial offset and S is the search area. The distance is the random variable with homogeneous signal and is denoted as
D [u(s),u(t)] = I о g №==]
^u(s)u(t)]
As we know that u(s)u(t) are the independent Gamma distributed RV’s with unity mean and the shape parameter varies from L=1, L=4 and L=16.
The edges and boundaries are clearly visible after de-speckling. The comparative study is made to show that the proposed bilateral de-speckling filter resulted in removing speckle noise as shown in Figure 4.
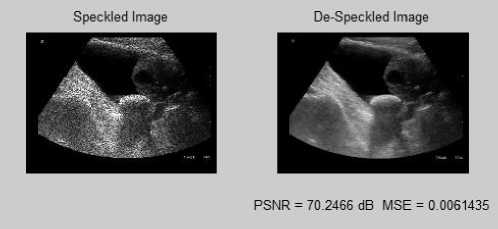
Fig. 3. De-speckled image output
Speckled Image Savitzky-Golay Filetered Image
Original Image
Median Filetered Image
De-Speckled Image
PSNR = 70.2466 dB MSE = 0.0061435
Fig. 4. Comparative study of proposed de-speckling
-
2.2 Feature based FCM (FFCM) clustering for segmentation
Feature based FCM is centered on clustering by curtailing an objective function There are hard clustering and soft clustering algorithms, k-means is a hard clustering algorithm and is searching to initial clustering centers or membership. C-means is a soft algorithm that recovers the deficiencies of k-means at the cost of increasing iterations.
Fig. 5. Attributes of Feature Extraction
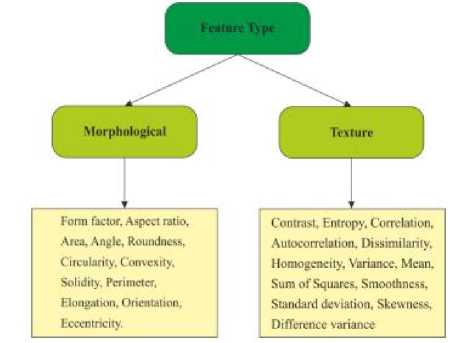
Figure 5 is a depiction of feature extraction attributes for consideration. The input image consists of group of attributes which are considered as U = {и ,, и 2,u 3............um } and W = {w1,w2 , w3............wm } are the weight parameters of cluster group centers. The cluster centroid is chosen randomly as n=3.
The fuzzy association function is defined as
^ k = --^ (6)
The gray-level co-occurrence matrix is denoted as
G ( i,j, о, tp )
l"
XZ" X
G(
i, J
,
о
,
)
G
(
i, j, о,cp
) is the frequency component and the adjacent pixels are
i
and
j. o
is the offset value and
cp
is the direction segment.
The fuzzy centroids are calculated as
_ (^jrfuj
)
w
=
.z-
^j)^
The distance function n _ dki+dkRt =
D^l
represents the amalgamation of pixel and region dissimilarity.
dkRi sum
( )
∑
i
∈
RtdkjRi
Ri
is the region which is obtained by the mean shift.
In (4)
^R[Rj
=‖
mean
(
Ri
)-
mean
(
Rj
)‖ is the Euclidean distance between the mean values of neighborhood regions. Z is a normalized constant. Instead of using pixels for clustering problem, gray levels are taken into account for decreasing the computational complexity. The objective function of proposed FFCM is
^m
=∑
∑
k^lYi^k
,
I
‖
fl
-
Vk
‖2
In (5) , is the fuzzy membership of gray value l and the weighting exponent m in association with the kth clustering center vk ,f is a gray level image with gray level values 1≤I≤q, Yi is the number of pixels.
∑
=
The enhanced FCM implements the histogram to reduce the complexity. The objective function
От
is to minimize and update the membership function
minOx
(
S
,
W
)=∑ ∑
к=1^к
r2 ( Uj ,
Wk
)
Where
s
=[
^-jk
] and
rfk
(
Uj
,
wk
)=‖
Uj
-
wk
‖ represent the distance.
The proposed FFCM algorithm is summarized as follows. Initialize randomly the membership partition values, cluster centers, fuzzification degree, weighting factor and error.
2.3 Whale optimization algorithm
The whale optimization algorithm is a meta-heuristic algorithm presented to make the universal optimum for fuzzy centroid function until the segmentation quality is met. WOA is inspired by the actions of humpback whales hunting process. It swims in the prey oriented region at a circle which will be reduced slowly with a spiral shaped nature. Here the algorithm is used to explore or exploit basis depends on searching or foraging for prey. Step 1: Initialization
The population is initialized with
$1
(
i
=1,2,3…
m
) N set cluster centroid, coefficients U and V , Maximum Iteration count x and optimum vector
⃗⃗⃗
∗
⃗
()
Step 2: Fitness Function The task is to optimize the centroid value based upon the accuracy of segmentation function.
f
(
Si
) =max(
segmentationaccuracy
)=
J K J TP+TN+FN+FP We know that TP-True positive, TN-True negative FN-False Negative and FP –False Positive Step 3: Surrounding Prey As already explained Humpback whales find the finest location and increase the quantity of iteration.
⃗
=|
v
.
⃗⃗⃗
∗
⃗
(
x
)-
S
(
x
)|
⃗
(
X
+1)=
∗
⃗
(
X
)-
⃗
⃗
․
⃗⃗⃗⃗
if d
<0.5
Step 4 Updating Spiral position The position are updated in spiral form to attack the prey and the mathematically represented as ⃗⃗ • V 4
⃗
(
X
+1)=
⃗
ehx
соѕ(2
Til
) +
⃗⃗⃗
∗
⃗
(
X
)
if d
≥0.5
Step 5 Searching for prey -?
⃗⃗⃗⃗⃗⃗⃗⃗⃗
(
X
)-
S
(
X
)|
|
⃗
⃗
|>1 – Exploiting FFCM algorithm
|
⃗
⃗
|<1 – Explore and update the finest centroid.
Step 6: Termination After completion of the maximum iteration, cluster centroid is fixed and the finest collection of segmentation results are the outcome of WOA enabled feature based FCM. Each pixel is assigned to the closest cluster center in the order of the minimum distance, and we then compute the new clusters of cities. The cycle is repeated until it is finished Criteria is satisfied.
2.4 Feature Extraction using Gray-Level Co-Occurrence Matrix
The Gray-level Co-occurrence matrix is the technique used here for feature extraction. Image texture analysis is used here to extract distinguished features of a kidney tumor or kidney cyst and the soberness of PKD. The objective of GLCM is to allocate an identified model into groups of images. Feature based FCM + WOA clustering Algorithm
Initialize
: Values for
Ajk
,
n , W, S°
=[0]
e-
Termination criterion {0, 1]
Ensure
all center vectors
W^
: all membership degrees
^Jk
loop counter b = 1
Repeat
: update clustering centroid using WOA
update membership degrees update objective functions
Until Return Apply
: ‖
0^
-
^m
‖<
e
,
b
>1
: Membership degrees
^ki
Each data item into the cluster whose
^Jk
>
max
End if
The size is reduced to speed up the testing and training phase of the system and also the system to ameliorate the quality of the image. The performance is evaluated using the parameter mean square error (MSE) which is adopted as fitness function during the training phase of CAD system and is expressed as
MSE=∑ j
∈
t∑ P=1 (t Jp -уp)
^p
is the labeled class and
Ур
is the obtained output from the CAD system.
3. Results and Discussion
3.1 Dataset used The publicly available database for analyzing PKD disease image is used for evaluation and the discussed methodology is experimented as well to improve and assist the diagnosis of the PKD severity. The considered database consists of 118 images with 512×512 pixels per slice. The region of interest is kidney background and tumor/cyst part with which the segmentation grading scale is fixed as per the latest medical standard. All kidney cyst greater than 1.5 mm is the degree of PKD symptom and is graded for severity. Patients vary in size from microscopic to around 5 cm in diameter, with a thin, transparent wall. These cysts can be linked to major diseases that impede kidney function but don't frequently result in consequences. US chronic disease indicators: The dataset population offers a consensus-developed cross-cutting collection of 124 indicators that enable states, territories, and major metropolitan areas to consistently define, gather, and report data on chronic diseases. Table 1. Summary of PKD results
Dataset
PKD % of detection
Degree Scale
Degree of cyst severity
IKD - 50 Normal images
87%
0 %
No visible Tumor/cyst
IKD – 68 abnormal images
90%
1-24 %
Minimal effect
93%
25-49 %
Mild effect
86%
50-69 %
Moderate effect
91%
70-99 %
Severe PKD
90%
100 %
PKD affected
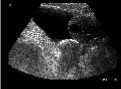
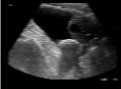
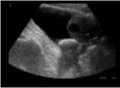
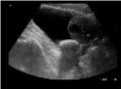
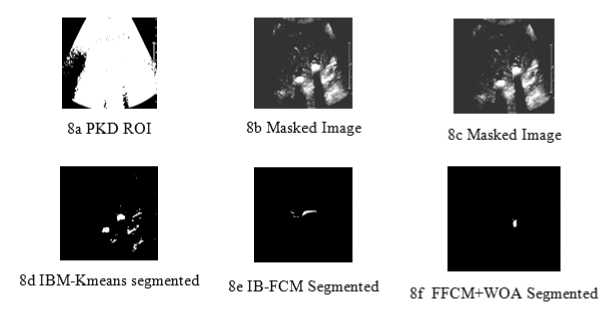
A diagnostic system can frequently arise when evaluating PKD. These patients may exhibit general symptoms like shortness of breath or chest pain. To demonstrate the proposed FFCM, we segment images in real time and compare the results with recent literature. Performance metrics of the FFCM are contrasted with those of the well-known benchmark segmentation algorithms BSDS and MSRC. It is observed that 45 out of 50 photographs are recognized as healthy hearts without occlusion and 54 out of 68 images were diagnosed as having occluded arteries. True positive classification accuracy is 83.07%, and true negative classification accuracy is 90%. If the patient presents with symptoms of a renal cyst, such as obstruction of the urine or stomach pain, the differential diagnosis is broad. Because the tissues of the kidneys are symmetrical, pain caused by a renal cyst can be traced to almost any organ. It's crucial to keep in mind, too, that most kidney cysts are asymptomatic and are usually found by chance. Segmentation result Fig. 6. Proposed FFCM Segmentation Image(without optimization) Fig. 7.FFCM+WOA segmented Image(with optimization) Fig. 8. 8a PKD ROI: 8b Masked Image : 8c masked image: 8d IBM-K means segemented :8e IB-FCM Segemented 8f FFCM WOA Segmented Table 2. Comparison of Performance parameters
S.No
Parameters
MGRF [15]
FFCM+WOA
1
MSE
0.3664
0.025
2
PSNR
52.4911
70.245
3
Loss Percentage
20
13
4
Accuracy
94
97
The performance of the proposed and existing classification procedures is compared in Table 2 using Mean Square Error (MSE) and Peak Signal to Noise Ratio (PSNR) metrics. These two error measures are what are utilized to compare image quality. The total squared error between the input and output images is known as the MSE. For low MSE levels, the error is also reduced. The PSNR shows the peak signal-to-noise ratio (in decibels (dB) between two images. This ratio is used to assess the image quality of the input and output. High PSNR levels result in greater image quality. Table 3. Performance metrics
Method
Precision
Recall
Accuracy
Dice
FCM
0.95
0.875
0.85
0.762
EFCM+WOA
0.95
0.925
0.97
0.764
Because of our model's excellent accuracy (97.%), there is very little chance that it will be misdiagnosed, which is crucial for practical use. In addition, our model has a high recall (92.52%), which indicates that there is very little chance of a missed diagnosis. A small portion of the pixels in the ROIs of a medical segmentation picture are often marked as background, with the remainder pixels being part of the image. Since the accuracy score takes into account actual negative results, it will always produce an erroneous high score. By comparison, the most often used metrics for semantic segmentation are IoU and dice coefficient because they penalise false positives, a typical feature in highly class unbalanced datasets such as MIS. Nevertheless, depending on the task's particular use cases, one may prefer to employ dice coefficient over IoU or vice versa. Table 4 Classification Performance of the proposed WOA+EFCM with existing classifiers
Contributers
Data
Method
Accuracy (%)
Sensitivity (%)
Specificity (%)
[10]
US
SOM-SVM
87.51
86.12
88.54
[11]
US
LFO-ASVM
93.62
90
96.24
[13]
WDBC
MBA-RF
96.71
91.32
93.23
[17]
CT
BAS-BPNN
96.31
96.32
95.62
Proposed method
MRI
WOA + FFCM
97
96.43
94.9
The medical image datasets are collected for using various scanners and imaging methods, an effective technique using transfer learning was applied to fine-tune the categorization task and increase accuracy. It was observed that the classification accuracy of the available approaches was 87.51% (SOM-SVM), 93.62% (LFOA-SVM), 96.71% (MBA -RF), and 96.31% (BAS-BPNN) [10, 11,13, 17].
4. Conclusion It is essential to diagnose kidney disease using MRI scanning techniques. Doctors can make more precise decisions with the aid of the proposed PKD model. This research suggested a CAD model that combines a whale optimization with the feature based FCM method to diagnose kidney PKD disease. In this system, the speckle noise was reduced with bilateral filter, and the contrast of the images was improved with a sigmoid filter. The dimensions of the resulting features were reduced by GLCM. After that, FFCM+WOA was employed to optimize the segmentation process. For training and centroid optimisation, traditional FCM needs more time. This suggested method utilized the knowledge of GLCM and fix finest FFCM to modify the weighting factors, thereby speeding up training and computation.
References WOA Enabled Fuzzy-C-Means Segmentation for Accurate Detection of Polycystic Kidney Disease
- Wolterink JM, Leiner T, de Vos BD, van Hamersvelt RW, Viergever MA, Išgum I. Automatic coronary artery calcium scoring in cardiac CT angiography using paired convolutional neural networks. Med Image Anal. (2016) 34:123–36. doi: 10.1016/j.media.2016.04.004
- Bezdek, J.C.; Ehrlich, R.; Full, W. FCM: The fuzzy c-means clustering algorithm. Comput. Geosci. 1984, 10, 191–203.
- Korfiatis P, kiadopoulos S, Sakellaropoulos P, et al (2014). Combining 2D wavelet edge highlighting and 3D thresholding for lung segmentation in thin-slice CT. Br J Radiol, 80, 996-1004
- J. Deen K., R G., A M. Fuzzy-C-means clustering based segmentation and CNN-classification for accurate segmentation of lung nodules. Asian Pacific J. Cancer Prevent. 2017;18
- T. Lei, X. Jia, Y. Zhang, S. Liu, H. Meng and A. K. Nandi, "Superpixel-Based Fast Fuzzy C-Means Clustering for Color Image Segmentation," in IEEE Transactions on Fuzzy Systems, vol. 27, no. 9, pp. 1753-1766, Sept. 2019, doi: 10.1109/TFUZZ.2018.2889018.
- S. Zeng, X. Wang, H. Cui, C. Zheng and D. Feng, “A unified collaborative multi-kernel fuzzy clustering for multiview data,” IEEE Trans. Fuzzy Syst., vol. 26, no. 3, pp. 1671-1687, Jun. 2018.
- J. Ma, S. Li, H. Qin and A. Hao, “Unsupervised multi-class cosegmentation via joint-cut over L1-manifold hyper-graph of discriminative image regions,” IEEE Trans. Image Process., vol. 26, no. 3, pp. 1216-1230, Mar. 2017.
- M. Gong, H. Li, X. Zhang, Q. Zhao and B. Wang, “Nonparametric statistical active contour based on inclusion degree of fuzzy sets,” IEEE Trans. Fuzzy Syst., vol. 24, no. 5, pp. 1176-1192, Oct. 2016.
- M. Bai and R. Urtasun, “Deep watershed transform for instance segmentation,” in Proc. IEEE Conf. Comput. Vis. Pattern Recognit. (CVPR), Honolulu, HI, 2017, pp. 2858-2866.
- M. Pereyra and S. McLaughlin, “Fast unsupervised bayesian image segmentation with adaptive spatial regularisation,” IEEE Trans. Image Process., vol. 26, no. 6, pp. 2577-2587, Jun. 2017.
- S. Yin, Y. Qian and M. Gong, “Unsupervised hierarchical image segmentation through fuzzy entropy maximization,” Pattern Recognit., vol. 68, pp. 245-259, Aug. 2017.
- Dhanamjayulu C, Nizhal U, Maddikunta PKR, Gadekallu TR, Iwendi C, Wei C, et al. Identification of Malnutrition and Prediction of Bmi From Facial Images Using Real-Time Image Processing and Machine Learning. IET Imag Process (2021). doi: 10.1049/ipr2.12222
- Del Re, D.P., Amgalan, D., Linkermann, A., Liu, Q. and Kitsis, R.N., 2019. Fundamental mechanisms of regulated cell death and implications for heart disease. Physiological reviews, 99(4), pp.1765-1817.
- Libby, P., 2013. Mechanisms of acute coronary syndromes and their implications for therapy. New England Journal of Medicine, 368(21), pp.2004-2013.
- Flora, G.D. and Nayak, M.K., 2019. A brief review of cardiovascular diseases, associated risk factors and current treatment regimes. Current pharmaceutical design, 25(38), pp.4063-4084.
- Ding J, Cheng HD, Huang J. Breast Ultrasound Image Classification Based on Multiple-Instance Learning. J Digit Imaging (2012) 25:620–7. doi: 10.1007/ s10278-012-9499-x
- Huang H, Feng X, Zhou S. A New Fruit Fly Optimization Algorithm Enhanced Support Vector Machine for Diagnosis of Breast Cancer Based on High-Level Features. BMC Bioinf (2019) 20:676–87. doi: 10.1186/s12859- 019-2771-z
- Severino, P., D’Amato, A., Pucci, M., Infusino, F., Adamo, F., Birtolo, L.I., Netti, L., Montefusco, G., Chimenti, C., Lavalle, C. and Maestrini, V., 2020. Ischemic heart disease pathophysiology paradigms overview: from plaque activation to microvascular dysfunction. International journal of molecular sciences, 21(21), p.8118.
- Jahmunah, V., Ng, E.Y.K., San, T.R. and Acharya, U.R., 2021. Automated detection of coronary artery disease, myocardial infarction and congestive heart failure using GaborCNN model with ECG signals. Computers in biology and medicine, 134, p.104457.
- Hannah et al, “Algorithms for automated diagnosis of cardiovascular diseases based on ECG data: A comprehensive systematic review” Heliyon Volume 9, Issue 2, February 2023
- https://github.com/TLKline/AutoK idneyCyst
