Working hours in Russia: employment models and choice factors

Author: Bobkov Vyacheslav N., Veredyuk Olesya V.
Journal: Economic and Social Changes: Facts, Trends, Forecast @volnc-esc-en
Section: Social development
Article in issue: 5 (65) т.12, 2019.
Free access
The paper classifies and investigates working hours in order to identify the structure of their distribution and factors determining their distribution in Russia. Assessment of the situation regarding working time is relevant in conditions of non-standard employment when it is necessary to search for ways to improve productivity. Our article adds to well-known publications that focus on the analysis of working hours and miss the important point that the same number of working hours can be implemented under different working time schemes, which entails, for example, different options for regulation and protection of employees’ rights. We design a conventional standard model of employment in Russia based on the frequency of occurrence of each of the three time parameters of employment (the number of working hours per week and per day, and the number of working days per week). We find out that this model represents a 40-hour work week with 5 working days and 8 working hours per day. According to the regression analysis of the microdata of the Russian Longitudinal Monitoring Survey - Higher School of Economics (RLMS-HSE), we identify factors that increase the probability of employment under this model, namely: availability of an employment contract, work in companies with state participation, employment in management bodies. While regional trends remain heterogeneous, the conventional standard model continues to spread, but it has not yet become the predominant model of working hours. We show that the growth of balance in the use of working hours is accompanied by processes that do not contribute to economic competitiveness, evenness of regional development and the quality of human potential in Russia. The results we obtain enrich the knowledge about the actual working time schemes used in Russia and can serve as a basis for making substantiated decisions to identify the reserves of working time and find ways to optimize it. Further research can analyze the quality of employment under different working hours.
Working hours, working time, employment models, labor market, quality of employment, rlms-hse, employment policy, Russia
Short address: https://sciup.org/147224208
IDR: 147224208 | UDC: 331.526 | DOI: 10.15838/esc.2019.5.65.7
Text of the scientific article Working hours in Russia: employment models and choice factors
Reducing the length of working time is a long-observed trend in the world [1, p. 14]. Thus, the average working time in the countries for which the Organization for Economic Cooperation and Development (OECD) collects data per employee per year was 1,960 hours in 1970, 1,851 hours in 1992 and 1,746 hours in 20171. This trend, being one of the implications of economic growth, is typical primarily of Western countries. In Russia, on the contrary, this indicator tended to increase, and after the crisis of 2008–2009 it fluctuates slightly around the level of 1,751 hours per year2, which corresponds to about 38 working hours per week3.
In general, a number of institutional factors have contributed to the evolution of working hours. W can note some of them with regard to Russia. For example, since 1991, the standard working week has been legally shortened (from 41 to 40 hours4), the minimum annual paid leave was increased (from 18 to 24 working days), national holidays were established (in the beginning of January and in the beginning of May), the scope of employees with flexible working hours (including part-time working day) was expanded, administrative leave and compulsory transfers to part-time employment were added [3, pp. 16-17]. In addition to these institutional factors, actual working hours also depend on economic and individual factors [4, p. 22].
Topics related to working hours are of particular relevance in the conditions when the problems of transition to a four-day working week, increasing productivity, and use of flexible forms of employment are discussed. Thus, in well-known publications on the Russian labor market, researchers investigate working hours per employee in annual terms [5; 6; 7]. Working hours per month are viewed as indicators of labor supply in assessing its wage elasticity [8]. A number of studies of the labor market in Russia proceed from the assumption that the Russian economy is dominated by the working week corresponding to the upper limit of 40 hours established by labor legislation5 [9]. However, it is important to look into the actual situation concerning working hours.
In the majority of well-known publications, including those cited above, their authors tend to focus on analyzing the number of working hours. However, one can work the same number of hours under various working time schemes, and this implies, for example, different options for regulating and protecting employees’ rights. This gap in scientific studies defines the novelty of our present work devoted to those working time schemes that include several time parameters of employment (the number of working hours per week and day, and also the number of working days per week).
The goal of our paper is to study working time schemes in order to identify the structure of their distribution and factors determining their distribution in Russia. The knowledge of actual schemes according to which working time is organized can serve as a basis for making optimal decisions to identify the reserves of working time and for changing the way in which standard and non-standard employment criteria are perceived in modern conditions.
The structure of distribution and the factors contributing to the prevalence of particular working time schemes are not studied as profoundly as the effects of both overtime and low-hours work. Studies have already shown their wide range at both micro and macro levels. For example, for an individual to be engaged in part-time employment means that there is no guarantee of even a minimum wage, because in order to obtain it, it is necessary to work the full standard working time6. When working hours are reduced against the employee’s will (for example, the employee is sent on involuntary administrative leave or he/she cannot find fulltime employment), his/her employment is associated with precarious employment, which is characterized by a low level of social rights and guarantees, lower wages, high concern about the likelihood of losing their job, and dissatisfaction with their work in general [10, pp. 9-30]. The presence of workers with precarized employment has an impact on other employees because leadership/training duties are shifted to the latter or because of direct competition for work between the two groups [11, p. 24].
On the other hand, for an individual, working overtime is associated with health problems (burnout syndrome, weight gain, increased alcohol consumption, and smoking), risks of injury, reduced productivity, an increase in the number of errors [12; 13; 14; 15]. Some studies indicate mental health problems that occur when working more than 39 hours a week [16] and are gender-specific [17].
For individuals, the decision to use time is central among the decisions they makes throughout their life [18, p.1]. Perhaps this is why low job satisfaction, both in the case of low working hours and in the case of overtime hours, reduces life satisfaction in general [19].
For a firm , working hours are important in terms of productivity, employee engagement, and employee turnover issues [20]. For example, output does not necessarily increase as operating hours increase, and in many industries, on the contrary, shorter hours are associated with higher hourly productivity [21].
For the economy as a whole, reducing working hours during a recession is one of the tools to curb the rising unemployment. Along with this, it is a factor that reduces gross output. The decrease in working hours may indicate an increase in the balance of working hours in the economy, on the one hand, and a lower flexibility of adaptation mechanisms of the labor market, on the other hand.
High importance of working hours in general urged the international expansion of the Decent Work Agenda, first introduced by the International Labor organization (ILO) in 1999 and implemented worldwide and in Russia as well. It included the concept of decent working time, implying health safety; workfamily balance; gender equality; productivity growth and the ability of workers to influence their working time [22]7.
The above-mentioned effects of both overtime and a reduction of working time increase the relevance of the research on the distribution structure and factors determining the spread of working time schemes.
The following section provides statistics that describe the structure of the distribution of groups of employees with different working hours, as well as the dynamics of their distribution. The third section uses regression analysis to identify factors that affect the probability of employment in the working hours scheme defined in this paper as a conventional standard model. The fourth section discusses the findings obtained in the course of the empirical research. In the end of our paper we give general conclusions and recommendations.
General patterns of distribution of workers according to the number of working hours in Russia
Let us clarify that we will talk about employment at the main place of work. We shall start with the number of actual working hours per week. According to the Russian Longitudinal Monitoring Survey conducted by the National Research University – Higher School of Economics (RLMS-HSE)8, employment of 40 hours per week is the most common (typical) model of employment in the Russian economy and the main representative database of microdata9 for this study. In 2017, this type of employment was typical of 44% of all the employed, in 200110 – 37%. This trend indicates the spread of the employment model with the number of actual hours of work per week corresponding to the standard adopted at the legislative level.
To get a more complete picture of the existing employment model in terms of working time, let us note two more characteristics of employment, namely the usual length of the working day and the number of working days per week. Thus, according to the data of RLMS-HSE, in 2017, an 8-hour working day was usual for 50% of the employed; this working time scheme has become more common since 2001 (46%). At the same time, the majority of employed (56% in 2017 and 51% in 2001) had a five-day working week 11. The frequency of using this working time scheme has increased as well12.
According to the correlation analysis carries out with the use of the data for 2017, we observe a strong positive correlation between the number of actual working hours per week and usual duration of working time (r = 0.720; p < 0.1); a weak positive correlation between the
Percentage of employees with working hours deviating from the standard (% of total employment in the federal district)
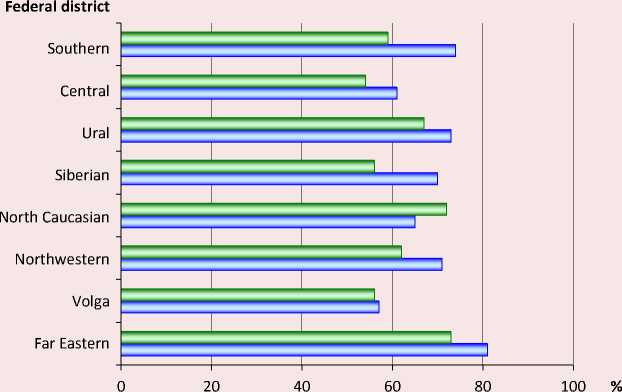
□ 2017 □ 2001
Source: compiled with the use of RLMS-HSE. Available at: (accessed 14.05.2019).
number of actual working hours per week and number of working days per week (r = 0.156; p < 0.1); a moderate negative correlation between usual duration of working time and number of working days per week (r = - 0.420, p < 0.1).
Taken together, the three parameters under consideration allow us to build a conventional standard model of employment in Russia on the basis of working time. We have found that this model represents a 40-hour work week with 5 working days and 8 working hours per day. The employment of 41% of all employees in 2017 met all parameters of this model, but the employment of the majority (59%) did not correspond to them to a certain extent.
In the regional context, the situation with the deviation from the specified standard of working hours is heterogeneous (Figure). From 2001 to 2017, the share of employees whose working hours deviated in one way or another from the standard decreased in all federal districts (FD), except for the North Caucasian FD, where this share increased. At the same time, the spread of this indicator between the districts decreased (from 24 p.p. to 19 p.p.), but remained noticeable. The minimum value is observed in the Central and Volga federal districts, the maximum – in the Far Eastern Federal District.
For further analysis, we distinguish three employment models with different working hours: standard, transitional and non-standard. The standard scheme implies an 8-hour working day and a 40-hour working week. The transitional scheme admits non-compliance with one of the specified parameters of the standard. The non-standard scheme includes employment that implies more or fewer working hours than the 8-hour working day and the 40-hour working week.
The dynamics of the spread of these three employment models with different working hours in Russia is presented in Table 1 . During
Table 1. People employed under schemes with different working hours, Russia (% of total employment)
Year Working hours scheme Total Standard* Transitional** Non-standard*** 40 hours per week 8 hours per day 2017 41.3 2.8 9.3 46.6 100 2013 40.1 1.9 9.7 48.3 100 2009 36.2 2.3 10.6 51.5 100 2005 38.2 1.8 10.8 49.2 100 2001 34.1 2.6 12.3 50.9 100 Calculated with the use of: RLMS-HSE. Available at: (accessed: 14.05.2019). * Employment 40 hours per week and 8 hours per day. ** Employment either 40 hours per week or 8 hours per day. *** Employment more/less than 40 hours per week and more/less than 8 hours per day.
Table 2. Employee distribution structure according to the combination of working hours per day and week, 2017, (% of total employment)
Number of actual working hours per day 1–5 hours 6–7 hours 8 hours (standard) 9–11 hours 12+ hours Number of actual working hours per week 1–30 hours 4.2 2.0 0.4 0.3 0.3 31–39 hours 0.1 7.1 1.1 0.4 2.0 40 hours (standard) 0.0 0.4 41.3 1.1 1.3 41–50 hours 0.0 1.2 6.8 6.1 10.6 51–70 hours 0.0 0.0 1.0 3.8 3.3 71+ hours 0.0 0.0 0.0 0.5 4.6 Calculated with the use of: RLMS-HSE. Available at: (accessed: 14.05.2019).
the observed time period, more people were employed under the non-standard scheme than under the standard one. Despite the general vector of dissemination of the standard model, the share of those employed under non-standard working hours remains higher. Redistribution of employees between the standard and nonstandard models occurs against the background of the gradual disappearance of the transitional scheme of working hours.
It follows from the HSE database that, for example, in 2017, the average working day was 9.5 hours, and the working week was 43.8 hours. It is known that average indicators may hide a large spread of values. In our case, this would mean a strong stratification of groups of workers in terms of working hours. In order to demonstrate the actual situation, we will resort to a more detailed (compared with the above) structure of the distribution of all employees by combinations of actual number of working hours per week and the usual duration of working day. This structure for 2017 is presented in Table 2.
The most important conclusions drawn from the analysis of the data in Table 2 include the following. First, the employed persons who work more or less than the standard 8 hours per day and 40 hours per week, are dominated by those whose working hours and working week exceed the specified standard. The share of such an enlarged group in 2017 amounted to about 30% of the total number of employees. We pay special attention to its most numerous subgroup, namely those employed with a small number of overtime hours per week (41–50 hours) and high overtime per day (12 hours or more). The size of this group exceeds 10% of the total number of employees. This group is formed in approximately equal proportions by women and men, whose average age is slightly more than 40 years.
Second, the next largest group (13% in the total structure of employment) consists of those employed with downward deviation from the standard working hours. Representatives of this group work no more than 7 hours a day, and their working week lasts less than 40 hours. Third, the groups with the least (up to 5 hours per day and up to 30 hours per week) and most (12+ hours per day and 71+ hours per week) intensive working hours account for about 4.5% in each case. The first group is formed by part-time worker13, the second one – by those employed with high overtime. These two groups are fundamentally different from each other according to socio-demographic characteristics. Typical representatives of the first group are women whose average age is about 50 years. As for the second group, its characteristic representative is a man 44 years of age.
In addition to the above analysis of the structure of the employed, we analyze the dynamics of this structure for the period from 2001 to 2017 on the basis of the data of the corresponding RLMS-HSE waves. Following the general logic of the previous section, we note a number of key points. First, let us consider those employed whose working hours and working week exceeded the specified standard. The share of this enlarged group during 2001–2017 was quite stable (about 30% of the total number of employees). This makes it possible to include this group in the stable core of the non-standard employment model.
Its largest subgroup, those employed with a small number of overtime hours per week (41– 50 hours) and high overtime per day (12 hours or more) increased from 8% in 2001 to 11% in 2017 during the period under consideration.
Second, the share of employees whose working time regime deviates from the standard model in two parameters simultaneously to the smaller side during the period under review decreased from 16% to 13%. Third, the proportion of groups with the least (up to 5 hours per day and up to 30 hours per week) and most (12+ hours per day and 71+ hours per week) intensive working hours barely changed during the period under review.
Speaking about the dynamics of the employment structure proposed in Table 2, we note its reaction to the crisis of 2008–2009. During this period, there was a decrease in the prevalence of the standard employment regime against the background of employment growth under the conditions of non-standard working hours. In the latter case we are talking mainly about such a scheme of working hours under which the number of hours per day and per week was below the standard (i.e. 8 hours and 40 hours respectively). This fact is due to the widespread use of adaptation mechanisms in the domestic economy such as administrative leave, mass transfers of workers to part-time employment14.
These general patterns of distribution of workers according to the number of working hours in Russia indicate that their structure is highly diversified. What factors give rise to differences in working hours? The answer to this question should help better understand what factors are important for the formation of total working time in the economy.
The heterogeneity of the structure of the employed and its dynamism dictate the necessity of setting research priorities. From now on, let us focus our analysis on the increasingly common standard working hours. Factors that may influence the likelihood of employment under such working hours will be investigated further. The goal of the study is to confirm empirically the correlation between working 8-hour per day and 40 hours per week and the sample factors. Our main hypothesis is that employment under the standard model is most likely in areas where economic activity is carried out within the framework of legal regulation, in which it is easy to draw boundaries and keep records of working time.
Data, methods and results of the empirical research
Data of the Russian Longitudinal Monitoring Survey conducted by the National Research University – Higher School of Economics (RLMS-HSE) served as the main empirical base for our study. RLMS-HSE is a series of nationally representative surveys designed to monitor the impact of Russian reforms on the health and well-being of households and individuals in Russia. The data contain information about the employed and their main place of work, sufficient for the purposes of the study. We also use the relevant indicators on the unemployment rate, which are issued by the Federal State Statistics Service (Rosstat) and which characterize the situation in regional labor markets.
Estimates based on microdata make it possible to analyze the situation not only as a whole, but also for individual groups. This will help identify the groups with the highest probability of employment under the terms of the standard work scheme (8 hours per day and 40 hours per week). The sample of RLMS-HSE is representative, which allows us to extend the results to the general population of Russia.
The latest published representative data of 26 waves collected in October 2017 – February
2018 were taken for our analysis. We formed a sample of respondents aged 15+ who gave an affirmative answer to the question of whether they are working now. The sample contains data on 5,071 individuals.
The purpose of the analysis is to identify the relationship between the sample characteristics (explanatory variables) of each individual and the probability of their employment under the conditions of standard working hours (i.e. 8-hour working day and 40 working hours per week) compared with the control group.
To do this, we used a logit regression15 based on the dummy qualitative variable y that reflects the state of employment (where 1 corresponds to employment under standard working hours and 0 – employment under other working schemes), as well as β -coefficients that determine the contribution of each selected factors to the probability of being in employment under standard working hours.
In addition to the basic characteristics commonly used in traditional economic models of labor supply, the impact of demand for labor is taken into account. We will proceed from the fact that the decision regarding participation in the labor market and the decision on the number of working hours are separate not only by logic, but also by time [25, p. 8]. Explanatory variables are divided into three groups: characteristics of respondents, place of work and place of residence (to control regional economic factors). All variables in the model are dummy and take a value of 1 or 0.
The final list includes characteristics we selected taking into account the existing literature, as well as our personal research interests. Thus, the individual characteristics of the respondent include: sex; age; nationality; marital status; children under 18 years of age; moving to another area in the last four years; level of education (general, secondary vocational and higher education); professional group16 (unskilled workers – USW, skilled manual workers – SMW, skilled non-manual workers – SNMW, service workers – SW, office workers and customer service workers – OW, mid-level specialists and officials – MLS, specialists of the highest level of qualification – SHQ, legislators, senior officials, senior and middle managers – LOM; work experience at the current place of work; working at two or more jobs; receiving a pension.
Job characteristics include economic sector, size of company according to the number of its employees, form of ownership, existence of an employment contract.
The group of characteristics of the place of residence includes the region of residence (Central Federal District – CFD, Northwestern Federal District – NWFD, Volga Federal District – VFD, Far Eastern Federal District –FEFD, Southern Federal District – SFD, Ural Federal District – UFD, Siberian Federal District –SFD, and North Caucasian Federal District – NCFD; the number of inhabitants in the settlement, and the unemployment rate in the region of residence of the respondent according to Rosstat.
The estimated logit regression has the following form:
Pi , (y = 1)
(logitCP i, ) = ln(------) = a + exf, (1)
1 -P ij ( У = 1)
where β is the vector of the estimated coefficients calculated using the maximum likelihood method; p ij – the probability of the individual i with the set of characteristics Xj (explanatory variables) to be in the state j (i.e., employment under the conditions of standard working hours).
The probability of employment under standard working hours can be determined as follows:
P tj (У D 1 + ,^ .... 1 + exp(-( a + P X;)) " (2)
The limiting effect of each variable on the probability of employment under standard working hours is found by the formula:
dP ij ( У = 1) dX ,
P ij (1 -P ij ) e
Table 3 presents the results of a logistic regression that assessed the likelihood of being employed under standard working hours compared to employment under other conditions.
Table 3. Factors contributing to employment under standard working hours, 2017 (logit regression)
|
Employment factor (explanatory variable) |
Factor value |
|
|
Average |
Calculated |
|
|
Sex |
||
|
(1 — women) |
0.516 |
0.039 |
|
Age, years |
||
|
15–19 |
0.004 |
n.e. |
|
20–24 |
0.056 |
-0.731* |
|
25–34 |
0.239 |
-0.272 |
|
50–64 |
0.277 |
-0.215 |
|
65–72 |
0.027 |
-0.180 |
|
73+ |
0.007 |
-2.219** |
|
Nationality |
||
|
(1 – not Russian) |
0.104 |
-0.293** |
16 According to the International Standard Classification of Occupations (ISCO-88). Available at: public/english/bureau/stat/isco/isco88/ (accessed: 20.05.2019).
Continuation of Table 3
|
Employment factor (explanatory variable) |
Factor value |
|
|
Average |
Calculated |
|
|
Marital status |
||
|
(1 – single) |
0.422 |
-0.103 |
|
Children |
||
|
(1 – with children under 18) |
0.400 |
0.009* |
|
Moving to another area |
||
|
(1 –yes, for the last 4 years) |
0.015 |
-0.447 |
|
Education |
||
|
Professional |
0.532 |
-0.012 |
|
Higher |
0.339 |
0.259* |
|
Professional group |
||
|
SMW |
0.262 |
0.262 |
|
SNMW |
0.181 |
-0.708*** |
|
SW |
0.057 |
0.361* |
|
OW |
0.193 |
0.212 |
|
MLS |
0.172 |
0.270 |
|
SHQ |
0.060 |
0.322* |
|
LOM |
0.003 |
n.e. |
|
Specific employment period |
||
|
less than one year |
0.138 |
-0.154 |
|
2-5 years |
0.329 |
-0.139 |
|
6-15 years |
0.331 |
-0.069 |
|
26+ |
0.076 |
-0.179 |
|
Working at two or more jobs |
||
|
(1 — I have a second job) |
0.039 |
-0.281* |
|
Receiving a pension |
||
|
(1 — I receive a pension) |
0.195 |
-0.112 |
|
Economic sector |
||
|
Manufacturing |
0.158 |
0.475*** |
|
Construction |
0.074 |
0.638*** |
|
Agriculture |
0.041 |
0.078 |
|
Administration |
0.022 |
0.928*** |
|
Education, science, healthcare |
0.201 |
-0.276* |
|
Army, Ministry of Internal Affairs, security agencies |
0.050 |
-0.391* |
|
Finance |
0.022 |
0.706*** |
|
Energy industry |
0.019 |
0.879*** |
|
Utilities sector |
0.038 |
0.869*** |
|
Other |
0.063 |
0.325* |
|
Company size |
||
|
Microbusiness (no more than 15 people) |
0.285 |
-0.115 |
|
Small business (16-100 people) |
0.419 |
-0.021 |
|
Large business (more than 250 people) |
0.203 |
-0.011 |
|
Form of ownership |
||
|
with state participation |
0.427 |
0.250** |
|
foreign |
0.028 |
-0.261 |
|
other |
0.009 |
-0.877* |
|
Availability of an employment contract |
||
|
(1 — available) |
0.918 |
0.937*** |
|
Region of residence |
||
|
NWFD |
0.106 |
-0.611*** |
|
VFD |
0.220 |
-0.107 |
|
FEFD |
0.048 |
-0.856*** |
|
SFD |
0.119 |
0.023 |
|
UFD |
0.069 |
-0.670*** |
|
CFD |
0.125 |
0.073 |
|
NCFD |
0.038 |
-0.712*** |
|
Settlement, number of inhabitants |
||
|
More than 3,500 but less than 1,000,000 |
0.587 |
0.422*** |
|
over 1,000,000 |
0.081 |
0.508** |
|
(except Moscow and Saint Petersburg) |
0.108 |
0.584*** |
End of Table 3
Employment factor (explanatory variable) Factor value Average Calculated Unemployment rate in the region (1 – above the Russian average) 0.464 -0.056 Number of observations 3014 Dependent variable 0.413 Intersection 0.393 Calculated with the use of: RLMS HSE. Available at: (accessed: 14.05.2019). Note: 1. The logit regression is calculated on the condition that 1 = employment under standard working hours (8-hour working day, 40 hours per week), 0 = employment under other working schemes; 2. All variables are dummy. Assessment is made in respect of the underlying level: comparison for women is made relative to men; for age groups – relative to the group aged 35–49; for single respondents – relative to married ones; for those having children under the age of 18 – relative to persons without adult children; for non-Russians – relative to Russians; for those who moved to another place of residence – relative to those whose place of residence has remained the same over the last four years; for level of education – relative to general education; for professional groups – relative to unskilled workers; for specific work experience – relative to 16–25 years; for the number of jobs – relative to work at one place; for those who receive a pension – relative to those who receive no pension; for the sector of the economy – transport, communications, trade; for the size of the company – medium business (101–250 people); for the form of ownership – private form; for a labor contract – its absence; for the region of residence – Central Federal District; for the settlement – a settlement with population of not more than 3,500 people (i.e. rural area); for the level of unemployment in the region – equal to or below the national average; 3. * denotes statistical significance at the p-value <=0.1; ** – <=0.05; *** – <=0.01.
The results of the logistic regression analysis presented in Table 3 can be interpreted as follows. Among the general points, we point out that, first, a positive (negative) estimate of the coefficient for the variable indicates that an individual with the corresponding characteristic is more (less) likely to be employed under the conditions of standard working hours compared to those who do not have this characteristic, and other things being equal. Second, a higher (lower) calculation factor for a variable indicates its relatively higher (lower) contribution to an individual’s likelihood of being employed under standard working hours. At the same time, comparisons of calculated estimates of coefficients are correct only within the groups of factors. As for the meaningful interpretation of the calculated coefficients for variables, in this case it does not make sense.
As for the meaningful interpretation of the results of the regression analysis, which are presented in Table 3, we note the following. Let us start with the factors related to the individual characteristics of respondents. Thus, among the age groups, the probability of employment under the conditions of standard working hours is the maximum for the group aged 35– 49. However, the lower chances of having such employment are only significant for the groups aged 20–24 and 73+. Nationality is also a significant factor. Russians are more common among those employed under the standard working regime. Higher education reduces the risks of working under conditions different from the standard working hours. The fact of qualification increases the probability of having a job corresponding to the standard model. This statement is primarily true for professionals of the highest level of qualification and for workers in the service sector. A notable exception is skilled non-manual workers, who are less likely to be employed under the standard model than unskilled workers.
Now let us consider the results associated with a group of factors that characterize the place of work. The lowest probability of working under the standard regime is observed among those employed in the public sector of the economy: in education, science, healthcare, as well as in the army and security agencies; the highest – in government bodies. From the point of view of the form of ownership, the risks of employment under non-standard working hours are lower in companies with state participation. The existence of an employment contract directly correlates with employment under the 8-hour day and 40-hour week.
Finally, let us present estimates of the statistical correlation between the probability of employment under standard working hours and the characteristics of the place of residence . Thus, working in rural areas (i.e. settlements with a population of less than 3,500 people) dramatically reduces the possibility of such employment; and working in Moscow and Saint Petersburg increases it. The latter is true for employment in the Central Federal District. In a tense situation in the regional labor market, which is seen, in particular, in the unemployment rate exceeding the average value for the domestic economy, there are the increased risks of working in conditions different from the employment model with standard working hours. However, the coefficient for this variable is not significant.
Next, we shall discuss these results of our empirical study.
Discussion of the empirical research results
From the standpoint of the changes in the economy in general and labor relations in particular, it makes sense to elaborate on the key factors contributing to the employment under standard working hours, which turned to be significant in the regression analysis.
Thus, the marked increase in employment in companies with state participation, CSP [26, p. 81], increases the likelihood of employment under standard working hours. However, from the point of view of labor productivity, this trend rather reduces the competitiveness of the national economy, since labor productivity in private companies is usually higher than in CSP [26, p. 81].
At the same time, employment in education, science, and healthcare has a negative impact on the likelihood of employment under standard working hours. Specific features of working in education, science, and healthcare are manifested in the complexity of accounting of actual time worked. Due to the lack of clear regulations in the labor legislation regarding irregular working hours, this leads to the spread of practices of permanent overtime. According to studies, since the beginning of 2010, due to optimization (reductions), there is an outflow of employees from the fields of education, science, and healthcare [27, pp. 176-178]. But what, in this case, is hidden behind the possible increase in the balance in the use of working hours in the economy?
General negative migration growth (in other words, outflow) in rural areas may contribute to the spread of employment under standard working hours. Regions in which traditionally there is an outflow of rural population include the Far Eastern, Siberian, North Caucasian and Ural federal districts. On the contrary, in the European part of Russia, rural areas have a positive coefficient of migration growth. These are the Northwestern, Central and Southern federal districts17. What is good from the point of view of balance in the use of working hours, damages the potential of uniformity in the development of Russia’s territory.
As we have shown above, working 8 hours a day and 40 hours a week is directly correlated with the existence of an employment contract. In other words, the existence of an employment contract increases the likelihood of being employed under standard working hours. Analysis of the actual data on the prevalence of employment contracts in Russia reveals a tendency toward increasing the share of workers without an employment contract [28, p. 38]. Such workers are classified by official statistics as informally employed. The negative effects of informal employment include a whole range of consequences, from a decrease in certainty in labor relations to an increase in income differentiation18. The observed spread of informal employment reduces the potential for the spread of employment under the conditions of standard working hours. The high level of differentiation of Russian regions in terms of the spread of informal employment does not contribute to the spread of standard working ours either.
Thus, the results of the study generally confirm our basic hypothesis that employment under the standard model is most likely in areas where economic activity is carried out within the framework of legal regulation, in which it is easy to draw boundaries and keep records of working time.
In order to check the stability of the results obtained, it is necessary to reproduce our analysis on the data for a longer time period. We did not set such a task in this paper, but it can be done in the course of future studies.
References Working hours in Russia: employment models and choice factors
- Boulin J.-Y., Lallement M., Messenger J.C., Michon F. (Eds.). Decent Working Time: New Trends, New Issues. Geneva, International Labour Office, 2006. Available at: https://www.ilo.org/wcmsp5/groups/public/@dgreports/@dcomm/@publ/documents/publication/wcms_071859.pdf (accessed: 10.05.2019).
- Zaitsev A. A. Mezhstranovoi analiz otraslevoi proizvoditel'nosti truda v 1991-2008 godakh [Cross-Country Analysis of Labor Productivity broken dobwn by Sectors in 1991-2008]. Moscow: Institut ekonomiki RAN, 2014. Available at: https://inecon.org/docs/Zaytsev_paper_20140424.pdf (accessed: 15.05.2019).
- Gimpel'son V., Kapelyushnikov R. Nestandartnaya zanyatost' i rossiiskii rynok truda. Preprint WP3/2005/05 [Non-Standard Employment and the Russian Labor Market. Preprint WP3/2005/05]. Moscow: GU VShE, 2005. 36 p. Available at: https://www.hse.ru/data/2010/05/04/1216408139/WP3_2005_05.pdf (accessed: 10.05.2019).
- Lee S., McCann D., Messenger J.C. Working Time Around the World: Trends in Working Hours, Laws and Policies in a Global Comparative Perspective. Routledge, 2007. 220 p.
- OECD Reviews of Labour Market and Social Policies. Russian Federation 2011. OECD Publishing. Available at: http://www.oecd.org/pensions/public-pensions/oecdreviewsoflabourmarketandsocialpoliciesrussianfederation.htm (accessed: 20.02.2018).
- Benczúr P., Rátfai A. Economic fluctuations in Central and Eastern Europe: the facts. Applied Economics, 2010, vol. 42, no. 25, pp. 3279-3292.
- Gimpelson V., Kapeliushnikov R. Labor market adjustment: is Russia different? In: Alexeev M., Weber Sh. (Eds.). The Oxford Handbook of the Russian Economy. 2013. Available at: http://www.oxfordhandbooks.com/view/ (accessed: 14.03.2019).
- DOI: 10.1093/oxfordhb/9780199759927.001.0001/oxfordhb-9780199759927-e-012
- Klepikova E.A. Elasticity of demand on the Russian labor market. Voprosy ekonomiki=Economic Issues, 2016, no. 9, pp. 111-128. (In Russian).
- Larin A.V., Maksimov A.G., Chernova D.V. Elasticity of labor demand in relation to wages in Russia. Prikladnaya ekonometrika=Applied Econometrics, 2016, no. 41, pp. 47-61. (In Russian).
- Bobkov V.N., Veredyuk O.V., Kolosova R.P., Razumova T.O. Zanyatost' i sotsial'naya prekarizatsiya v Rossii: vvedenie v analiz: monografiya [Employment and Social Precarization in Russia: Introduction and Analysis: Monograph]. Moscow: TEIS, 2014. 96 p.
- Quinlan M. Precarity and Workplace Well-Being: A General Review in Safety or Profit? International Studies in Governance, Change and the Work Environment. / ed. by Nichols T., Walters D. Routledge, 2017.
- ILO, 2016; Workplace Stress: A Collective Challenge. Available at: https://www.ilo.org/wcmsp5/groups/public/-ed_protect/-protrav/-safework/documents/publication/wcms_466547.pdf (accessed: 14.03.2019).
- Salminen S. Shift Work and Extended Working Hours as Risk Factors for Occupational Injury. The Ergonomics Open Journal, 2010, 3, pp. 14-18.
- Collewet M., Sauermann J. Working Hours and Productivity. IZA Discussion Paper №10722. 2017. Available at: https://newsroom.iza.org/en/archive/research/do-longer-working-hours-decrease-performance/ (accessed: 14.03.2019).
- Overtime and Extended Work Shifts: Recent Findings on Illnesses, Injuries, and Health Behaviors. DHHS (NIOSH) Publication No. 2004-143. U.S. Department of Health and Human Services. Available at: https://www.cdc.gov/niosh/docs/2004-143/pdfs/2004-143.pdf (accessed: 14.03.2019).
- Dinh H., Strazdins L., Welsh J. Hour-glass ceilings: work-hour thresholds, gendered health inequities. Social Science and Medicine, 2017, vol. 176, pp. 42-51.
- Otterbach S., Wooden M., Fok Y.K. Working-Time Mismatches and Mental Health. IZA Discussion Paper No. 9818, March 2016. Available at: http://ftp.iza.org/dp9818.pdf (accessed: 14.04.2019).
- Hamermesh, Daniel S. Workdays, Workhours, and Work Schedules: Evidence for the United States and Germany, W.E. Upjohn Institute for Employment Research Kalamazoo, Michigan, 1996. 173 p.
- Veredyuk O.V. Quality of youth employment in Russia: analysis of job satisfaction assessments. Monitoring obshchestvennogo mneniya: Ekonomicheskie i sotsial'nye peremeny=Public Opinion Monitoring: Economic and Social Changes, 2018, no. 3, pp. 306-323. 10.14515/monitoring.2018.3.16. (In Russian).
- DOI: 10.14515/monitoring.2018.3.16.(InRussian)
- Kodz J. et al. Working Long Hours: A Review of the Evidence. Volume 1 - Main report. Employment Relation Research Series no. 16. 2003. Available at: https://www.employment-studies.co.uk/system/files/resources/files/errs16_main.pdf (accessed: 14.04.2019).
- Golden L. The Effects of Working Time on Productivity and Firm Performance: a Research Synthesis Paper. Geneva: ILO, 2012. Available at: https://www.ilo.org/wcmsp5/groups/public/-ed_protect/-protrav/-travail/documents/publication/wcms_187307.pdf (accessed: 14.05.2019).
- Messenger J.C. (Ed.). Working Time and Workers' Preferences in Industrialized Countries: Finding the Balance. London and New York, Routledge, 2004. 231 p.
- Gimpel'son V., Kapelyushnikov R., Roshchin S. (Eds.). Rossiiskii rynok truda: tendentsii, instituty, strukturnye izmeneniya. Doklad Tsentra trudovykh issledovanii (TseTI) i Laboratorii issledovanii rynka truda (LIRT) NIU VShE [Russian labor market: trends, institutions, structural changes. A report of the Center for Labor Research and the Laboratory for Labor Market Research of the NRU HSE]. Moscow: 2017. 148 p.
- Varshavskaya E. Ya. Russian labor market and the economic crisis of 2008-2009: a time of missed opportunities? Vestnik Omskogo universiteta. Seriya "Ekonomika= Bulletin of Omsk University. Series "Economics", 2012, no. 3, pp. 91-96. (In Russian).
- Killingsworth M. R. Labor Supply. Cambridge University Press, New York, 1983. 493 p.
- Abramov A., Radygin A., Chernova M. Companies with state participation in the Russian market: ownership structure and the role in the economy. Voprosy ekonomiki=Issues of Economics, 2016, no. 12, pp. 61-87. (In Russian).
- Roi O.M. On the main trends of employment in the public sector of the Russian Federation. Vestnik Omskogo universiteta. Seriya "Ekonomika"=Bulletin of Omsk University. Series "Economics", 2018, no. 1 (61), pp. 173-181. 10.25513/1812-3988.2018.1.173-181. (In Russian).
- DOI: 10.25513/1812-3988.2018.1.173-181.(InRussian)
- Veredyuk O.V. Informal employment: structure and risk factors in Russia. Vestnik Sankt-Peterburgskogo universiteta. Ser. 5. Ekonomika=Vestnik of Saint Petersburg University. Series 5: Economics, 2016, no. 4, pp. 33-48. 10.21638/11701/spbu05.2016.402. (In Russian).
- DOI: 10.21638/11701/spbu05.2016.402.(InRussian)
