Wound Image Analysis Using Contour Evolution

Author: K. Sundeep Kumar, B. Eswara Reddy
Journal: International Journal of Image, Graphics and Signal Processing(IJIGSP) @ijigsp
Article in issue: 6 vol.6, 2014.
Free access
The aim of the algorithm described in this paper is to segment wound images from the normal and classify them according to the types of the wound. The segmentation of wounds extravagates color representation, which has been followed by an algorithm of grayscale segmentation based on the stack mathematical approach. Accurate classification of wounds and analyzing wound healing process is a critical task for patient care and health cost reduction at hospital. The tissue uniformity and flatness leads to a simplified approach but requires multispectral imaging for enhanced wound delineation. Contour Evolution method which uses multispectral imaging replaces more complex tools such as, SVM supervised classification, as no training step is required. In Contour Evolution, classification can be done by clustering color information, with differential quantization algorithm, the color centroids of small squares taken from segmented part of the wound image in (C1,C2) plane. Where C1, C2 are two chrominance components. Wound healing is identified by measuring the size of the wound through various means like contact and noncontact methods of wound. The wound tissues proportion is also estimated by a qualitative visual assessment based on the red-yellow-black code. Moreover, involving all the spectral response of the tissue and not only RGB components provides a higher discrimination for separating healed epithelial tissue from granulation tissue.
Wound healing analysis, SVM classification, Contour evolution, KNN classification, Multispectral imaging, Skin erythema, Wound Image Analysis
Short address: https://sciup.org/15013304
IDR: 15013304
Text of the scientific article Wound Image Analysis Using Contour Evolution
Published Online May 2014 in MECS DOI: 10.5815/ijigsp.2014.06.05
In this paper a burn color image segmentation and classification algorithm is proposed. The motivation of this work stems in the fact that it is required as part of an automatic system to give a first assessment about the depth of a burn wound. For a succeeded evolution of a burn injury it is very important to state the first treatment [1]. To choose an adequate one, it is necessary to know the depth of the burn. As the cost of maintaining a Burn Unit is high, it is desirable to have an automatic system to give a first assessment in all the local medical centers, where there is a lack of specialists [2, 3]. The image processing has several advantages when it is applied to give the assessment of skin lesions and ulcers: the image processing techniques are objectives and reproducible. The processing of color image has an important future as the analysis and comparison of color images is a difficult task, and it can be acquire by experience. The fast advances in technology, the Computer Aided Diagnosis (CAD) systems are getting more famous. These days in the field of research the color skin images is limited to two main applications [4]. They are the assessment of the healing of skin wounds or ulcers [5-7], and the diagnosis of pigmented skin lesions such as melanomas [8-10]. Nevertheless, this research is being developed slowly due to the difficulty of translating color human perception into objective rules, analyzable by a computer. That is why; automation of burn wound diagnosis is still an unexplored field. However, in the related literature, there is a research tendency to search objective methods to determine burn depth. This research effort arises to mitigate subjectivity and high experience requirement in visual inspection. In this way, research about the relationship between depth and superficial temperature [11], sometimes employing thermographic images [12] has been done. Other works have tried to evaluate burn depth by using infrared and ultraviolet images, radioactive isotopes, Doppler laser flux measurements [13-15]. These techniques have limitation not only in diagnosis accuracy but also in unallowable economical cost. In spite of that, there is hardly bibliography about burn depth determination by visual image analysis and processing [16, 17]. On the contrary, there is a wide medical bibliography about burn wound diagnosis by means of visual inspection. In the present work, we developed a method to segment burn wounds in digital photographs and to classify them afterwards. In Section II we describe wound assessment. The segmentation part is devoted in Section III. The classification method is presented In Section IV and results are discussed in Section V.
-
II. Wound assessment
The following are the various items to assess the wound and their degeneration strategies.
|
Item |
Assessment |
|
1. Size |
|
|
2. Depth |
Non-blanchable erythematic on intact skin l = the skin loss involving epidermis &/or dermis 2 = damages involving thickness skin loss or necrosis of subcutaneous tissue; may extend down to but not through underlying fascia; &/or mixed partial & full thickness &/or tissue layers obscured by granulation tissue 3 = Obscured by necrosis 4 = Full thickness skin loss with extensive destruction, tissue necrosis or damage to muscle, bone or supporting structures |
|
3. Edges |
|
|
4. Undermining |
|
|
5. Necroti c Tissue Type |
|
|
6. Necroti c Tissue Amoun t |
|
|
7. Exudat es Type |
1 = None |
There are three main types of burn depth like superficial dermal, deep dermal and full-thickness which marks the border of the requirement of grafts.
-
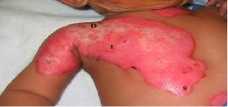
1) Superficial dermal burn – It is characterized by the presence of blisters (usually brown color) and/or a bright red color. So, we have assigned a region in the (V1, V2) plane to each appearance.
-
2) Deep dermal burn – It is characterized by its color as red-whitish, which has dark dots.
-
3) Full thickness – This type of wound is very dangerous to cure and heal.
-
III. Segmentation technique
Segmentation of wound from an image involves in isolating the wound from the image. To identify the Region of interest in wound involves various methods which has been divided into various generations and classified based on region based, boundary filling and pixel classification. The list of various segmentation methods are as follows:
Table 1: Various types of segmentations clustered into various generations and types
|
Generations |
Region Based |
Boundary Filling |
Pixel classification |
|
First |
Growing Method |
Edge Tracing Method |
Intensity threshold |
|
Second |
Graph Search |
Graph Search Target Tracking Multiscale |
C-Means Clustering Multiscale |
|
Third |
Shape Models Rule Based |
Rule Based |
-
A. Contour Evolution Method
The basic idea of active contour models is to evolve a curve so as to minimize a given energy functional in order to produce the desired segmentation and detect objects in the image. They are two categories exist for active contours models: edge-based and region-based. The snake is considered as first approach, it is based on the image gradient to stop the contour evolution in order to identify object boundaries. One benefit of this type of flow is the fact that no global constraints are placed on the image. This method is considered as very sensitive to image noise and highly dependent on initial curve placement. The second approach is based on Mumford– Shah segmentation techniques for stopping term23 and on the level set method for curve evolution. The main advantages in this method are to compare edge-based method which has robustness against initial curve placement and insensitivity to image noise. The interior contours are automatically detected starting with only one initial curve and the initial curve can be considered at anywhere in the image and it does not necessarily surround the objects to be detected. The main goal through applying the active contour method is to detect the homogenous region in the images that represents the wound differently from the healthy skin. Thus, we chose region-based approach and especially the classical and founder model proposed by Chan and Vese and whose implementation is available. To improve the segmentation results the pixel filling step and the wound surfaces using the scale factor previously mentioned were computed.
-
B. Multispectral Imaging System
The second part of this preclinical study is the evaluation of wound healing by processing multispectral images. They were acquired by a multispectral system that covers the visible and the near infrared range of the spectrum [430nm – 780nm]. This system is called as ASCLEPIOS (Analysis of Skin Characteristics by Light Transmission and Processing Image of Spectrum), which is made to developed and validated for dermatological applications in the Le2i laboratory in Dijon27. The system is coupled with software that reconstructs the reflectance cube (hyper spectral cube) from the acquired filtered images. ASCLEPIOS is decomposed in two parts: a light source compartment and a hand-held acquisition device. The illumination compartment houses the light source (Sutter Instrument, model Lambda LS Xenon Arc), spectral selective device. The tenth medium latter is based on band pass interference filters (CVI Melles Griot) which are held on a filter wheel (Sutter Instrument Lambda 10-3, model LB10-NW) yielding a switching times of 40 milliseconds between adjacent filters. The acquisition system is based on a monochromatic CMOS digital sensor (Photon focus Model MV1- D1312l-160-CL) that provides a spatial resolution of 32 pixels/mm-1 and producing an acquisition region of size 32 x 38 mm with a depth of 5 mm. The camera offers a 1.4 Megapixels resolution (1312 x 1082 pixels) and it is integrated into a handheld device to ensure an ergonomic acquisition images. The control of the filter wheel, the data acquisition and the generation of reflectance cube are performed using appropriate software installed on the computer (Figure 2). The proposed segmentation approach is a multi-resolution method, because of the need to attempt to gain a global view of an image by examining it at many different resolution levels. This proposed method is based on a grayscale multi-resolution segmentation algorithm, described by Lifshitz and Pizer [18, 19]. The stack calculates image segments and an image description tree by associating every pixel in an image with a local intensity extremum. The initial color version of this algorithm is described in [20]. In this work we present a transformation to segment accurately any type of burn wound.
-
C. The Stack Approach
In the stack approach the image is described in terms of extremal regions . This description is produced by identifying the extrema in a stack of images in which each higher image is a slightly blurred version of the previous one. Progressively blurring an image causes each extremum to move continuously and eventually to annihilate as it blurs into its background. Following the locations of an extremum across the stack of images forms an extremum path . Intensity change must be monotonic (increasing for dark spots and decreasing for light spots) as one moves along an extremum path from the original image towards images of increased blurring. As a consequence, an extremum region can be defined, in the original image, as formed by those pixels around the extremum point that fit the following condition:
-
- Their intensity is higher or equal to the annihilation intensity for that extremum, if it is a maximum.
-
- Their intensity is lower or equal to the annihilation intensity for that extremum, if it is a minimum.
An extremum annihilates when the blurring is sufficient to make the light or dark spot blur into an enclosing region. The amount of blurring necessary for an extremum to annihilate is a measure of the importance or scale of the extremal region. The intensity of the topmost point on an extremum path is the path’s annihilation intensity. This is the intensity of the isointensity contour that forms the boundary of the associated extremal region. A Gaussian kernel is used as blurring function [18].
-
D. Discrete Image Segmentation
Theoretically, this procedure could be applied as it for continuous images, where to reach a particular intensity from another one there is always a path with every value between them. Therefore, rounding every extremum there will be always any iso-intensity contour with intensity between its initial intensity value and its annihilation intensity. But this does not happen in digital images. Nevertheless this limitation can be easily overcome by looking for a contour, surrounding the extremal point that contains those pixels with the intensity nearer the annihilation one and above it. Additionally, under certain circumstances –mainly when there is not a big difference between the interest object and the background–, a maximum annihilates after too many blurring steps and the annihilation intensity results too high –for a minimum, too low in the case of a maximum–. Consequently the annihilation intensity does not define adequately object boundaries. And so, instead of choosing the annihilation value, we choose the extremum intensity resulting after a defined number of blurring steps. This number is proportional to the extremum value and its changing speed. Finally, due to discreteness of pixel values, at the first step, in the original image, too many extremum values appear. Significant extrema are selected by refusing those with intensity outside a tolerance band around the highest maximum and the lowest minimum. Furthermore, only those extrema that annihilate after a defined number of steps are considered.
-
E. Color Segmentation Applied to Burn Wound Images
To segment color images we first perform a color transformation to HSI coordinates, where distances are more correlated with color change human perception. The following step is to summarize the three coordinate color information for every pixel into an only magnitude. To avoid dependence on lighting conditions, the luminance coordinate is not considered. So, the intensity magnitude characterizing each pixel is form with the saturation coordinate weighed up by a function depending on the color, represented by the hue. The weighing function is:
W (h, hc, α) = cos3 (h-hc/α) (1)
Where hc is the angle of the color we want to emphasize.α is a parameter that chose the range of colors to be segment. We choose this particular weighing function to emphasize the directivity of the cosine function, which results too smooth to be applied as weighing function in our segmentation application. Finally, the complete intensity value assigned to every Pixel for segmentation is:
I(x , y ) = s × w ( h , hc, a ) ( x , y ) (2)
Where s is the saturation component
After segmenting the wound from the image wound analysis must be done and prediction of curability of the wound within stipulated period of days must be made. WIA tool helps in finding out the status of wound by wound status scale with tissue health conditions.
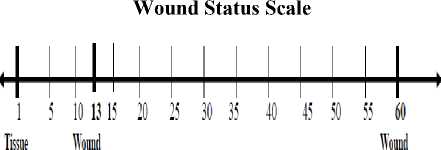
Health Regeneratiro Degeneration
-
IV. Classification part
-
A. Efficacy Measure of Various Classifiers
Classifiers are used to label the wounds and their characteristics and timeline. The wound status based upon various factors for assessment of wound. Wound Image Analysis (WIA) software tool helps in identifying the wound in an image and finding out the region of interest by active contour technique. The below table represents various classifiers and their parameters.
Table 2: Various classifiers performance metrics
B. SVM Classification
The wounds evolution was also studied by applying tissue classification process which was preceded by an unsupervised step of segmentation using JSEG algorithm16. The idea of algorithm was to divide the segmentation process in two steps: color quantization and spatial segmentation. The aim of first step is to limit the number of colors in the image by quantification to a few dominant tones preserving a good natural representation of images. The second step, performed on the quantized image, to be consisted in a spatial segmentation using a homogeneity criterion J which was calculated in a neighborhood around each pixel restricted to generate a J - image where a J value was assigned to each pixel. The lowest values were at the homogeneous regions centers, region boundaries considered as highest ones drew. A method of region growing applied to the J - image provided segmentation of the original image. The tissue
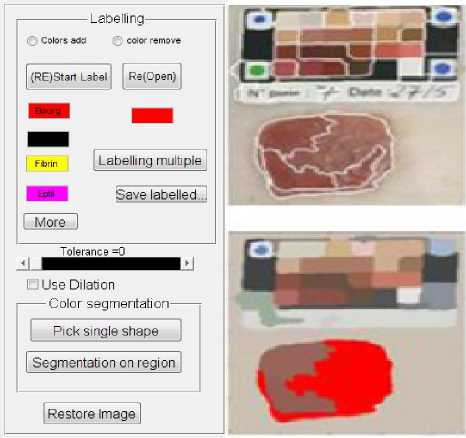
Fig 1: Labeling and pre-segmented Images
C. Classification Procedure.
As it was mentioned above, in the Lab color system, 2 × norms corresponds to perceptual similarity, thus representing the optimal distance metric for that space. That means that this will be a good measure to classify colors into the three groups, each corresponding to one aspect (two of them are of the same group) of burn wound. And to obtain the optimal centers and decision boundaries of the regions corresponding to each group we apply the LBG vector quantization algorithm [22] as it minimizes the overall mean-square classification. The quantize is trained with 96 images 49´49 of burns of the different depths. After the training, the centroids are fixed, and the quantizer is used for classification. The inputs for the classification are 9´9 squares, taken from the segmented part of the image that is supposed to be the burned part. The table below represents the various types of tissues labeled for a wound image and Overlapping scores of various experts for wound image of all types and their average.
Table 3: Various expert opinions for overlapping scores of various tissues of a wound image
|
$1№ |
Tissue Classification* |
Overlapping Scores (%)^ |
||||
|
Expert*1 I* |
Expert*' 2 |
Expert* 3^ |
Expert* 4^ |
Expert*1 5 |
||
|
1^ |
Granulation*1 |
73.2^ |
■4.5 |
54.2^ |
65.3^ |
66.8^ |
|
2 |
Sloughs |
74.6^ |
78.2^ |
56.3*1 |
68.4^ |
67.3 |
|
3 |
Necrosis^ |
85.3^ |
88.6^ |
76.5*1 |
70.3^ |
72.4- |
|
Average*1 |
77.7*1 |
80.4- |
62.33^ |
68^ |
68.8^ |
|
-
V. Experimental results
We apply the segmentation and classification algorithms on various burn images. Those images are digital photographs taken by physicians following a specific protocol [3]. All the images were diagnosed by a group of plastic surgeons, affiliated to the Burn Unit of the Virgen Del Rocío Hospital, from Seville. The assessments were validated one week later, as it is the common practice when handling with burned patients. Two of the images correspond to superficial dermal depth, two to deep dermal depth, and one image full thickness and the remaining is cluster of all the three.
Table 4: ROI Algorithms and their Efficacy
|
Sno |
ROI Algorithms |
Types of Wounds |
||
|
Superficial Dermal |
Deep Dermal |
FullThickness |
||
|
1 |
Stack Approach |
98.85 |
97.5 |
90.2 |
|
2 |
Discrete Image Segmentation |
98.2 |
97.75 |
91.2 |
|
3 |
Color Segmentation |
97.45 |
97.65 |
93.56 |
|
4. |
Active Contour |
99.34 |
99.2 |
99.05 |
-
A. Segmentation Results
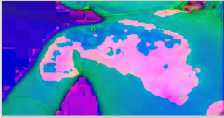
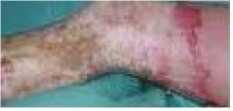
To perform the segmentation, a previous characterization of the hue and saturation component histograms for both normal and burnt skin was needed. This was done in order to fix the parameters hc and in equations (1) and (2). In all the cases, the burn wound was segmented correctly from the normal skin. Fig. 1 to 3 show the segmentation results for one image from each of the three types defined below. Fig 2. A represent original images and Fig. b represent the segmented ones. In the segmented images we have marked with violet color the segmented region on grayscale images.
Superficial
Wound Images Segmented
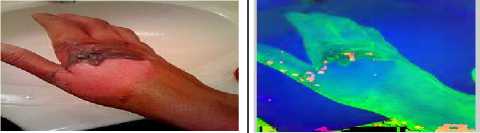
Deep Dermal
Segmented
Full thickness
Segmented
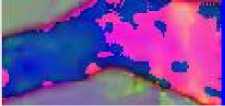
Fig 2: (a) Original Superficial (b) Deep Dermal (c) full thickness
Various algorithms are used to find out region of interest in a wound image by segmenting. Various ROI algorithms and percentage of accuracy of extracting the wound from an image are as follows:
-
B. Classification Results
As mentioned before, the segmented parts of the images were divided into 9´9 squares. The (C1, C2) centroids of these square are calculated and given as inputs to the classifier. A majority criterion is followed to assign a type to the photograph. In Table I the classification results are presented. In this table, the percentage of classified labels in the suitable class among the total number of squares in the wound appears in the last column.
Mixed burn wounds usually have small surface of deep dermal burn. That is why a small percentage of squares are considered as a deep dermal wound. In these types of images it is represented the percentage of squares classified as superficial dermal / deep dermal/full thickness. Nevertheless, wound images6, 7, 8, 9 and 10 should be considered as misclassified.
Table 5: Classified labels for various wound images of various levels
|
Sl no |
Wound Image |
Type of Wound |
Percentage of classified labels |
|
1 |
I1 |
Superficial dermal |
99.2 |
|
2 |
I2 |
Superficial dermal |
98.3 |
|
3 |
I3 |
deep dermal |
94.23 |
|
4 |
I4 |
deep dermal |
95.3 |
|
5 |
I5 |
full thickness |
85.2 |
|
6 |
I6 |
Superficial and deep dermal |
75.4/64.7 |
|
7 |
I7 |
deep dermal and full thickness |
64.3/10.3 |
|
8 |
I8 |
All types |
91.2/34.2/7.6 |
|
9 |
I9 |
All types |
93.8/23.2/3.6 |
|
10 |
I10 |
All types |
86.2/14.2/2.6 |
-
VI. Conclusions and further work
In the present paper a color image segmentation and classification method is proposed for various burn color images. It has been shown its good performance when segmenting and classifying the images into superficial and deep dermal types compared to full thickness images.
Wound Image Analysis Software tool kit works in finding out segmented part of the wound image and analyzing the wound and comparing it with healthy tissues and finding out the wound status by scaling. To enlarge the database and finding out for various learning techniques for various classifiers. For this purpose, we are taking into account the texture of the burns and not only the color information. Exploring various segmenting algorithms and various classifiers for labeling the wound status for WIA toolkit and enhancing t work out various types medical images like MRI scan computed tomography etc.
References Wound Image Analysis Using Contour Evolution
- J.A. Clarke, A Colour Atlas of Burn Injuries, London: Chapman & Hall Medical, 1992.
- C. Serrano, L. Roa and B. Acha, "Evaluation of a telemedicine platform in a burn unit", in Proc. IEEE Int. Conf. on Information Technology Applications in Biomedicine, 1998, pp. 121-126.
- L.Roa, T.Gómez-Cía, B.Acha and C.Serrano, "Digital Imaging in Remote Diagnosis of Burns", Burns, vol. 25, no. 7, Nov. 1999, pp. 617-624.
- W. P. Berriss, S. J. Sangwine, "Automatic Quantitative Analysis of Healing Skin Wounds using Colour Digital Image Processing", www.smtl.co.uk/World-Wide Wounds/1997/July/Berris/Berris.html#perednia1, 1997.
- M.Herbin, F.X. Bon, A. Venot, F. Jeanlouis, M.L. Dubertret, L. Dubertret, G. Strauch, "Assessment of Healing Kinetics through True Color Image Processing", IEEE Trans. on Medical Imaging, vol.12, no.1, 1993.
- M.Herbin, A. Venot, J.Y. Devaux, C. Piette, "Color quantitation through image processing in skin", IEEE Trans. on Medical Imaging, vol. 9, no.3, 1990.
- J. Arnqvist, L.Hellgren, J. Vincent, "Semiautomatic classification of secondary healing ulcers in multispectral images", in Proc. of 9th International Conference on Pattern Recognition, pp. 459-461, Rome (Italy), Nov. 1988.
- R. A. Fiorini, M. Crivellini, G. Codagnone, G. F. Dacquino, G. Libertini, A. Morresi, "DELM Image Processing for Skin-Melanoma early Diagnosis", Proc. SPIE – Int. Soc. Opt. Eng, vol. 3164, pp. 359-370, 1997.
- J. P. Thira, B. Macq, "Morphological Feature Extraction for the Classification of Digital Images of Cancerous Tissues", IEEE Trans. on Biomedical Engineering, vol. 43, no. 10, pp. 1011-1020, Oct. 1996.
- G. A. Hance, S. E. Umbaugh, R. H. Moss, W. V. Stoecker, "Unsupervissed Color Image Segmentation with Application to Skin Tumor Borders", IEEE Engineering in Medicine and Biology, pp. 104-111, Jan/Feb 1996.
- F. J. Wyllie, A. B. Sutherland, "Measurement of Surface Temperature as an Aid to the Diagnosis of Burn Depth", Burns, vol. 17, no. 2, pp. 123-127, 1991.
- R. P. Cole, S. G. Jones, P. G. Shakespeare, "Thermographic Assessment of Hand Burns", Burns , vol. 16, no. 1, pp. 60-63, 1990.
- R. E. Barsley, M. H. West, J. A. Fair, "Forensic Photography. Ultraviolet Imaging of Wounds on Skin", American Journal of Forensic Medical Pathology, vol. 11, no. 4, pp. 300-308, Dec. 1990.
- J. E. Bennett, R. O. Kingman, "Evaluation of Burn Depth by the Use of Radioactive Isotopes – An Experimental Study", Plastic and Reconstructive Surgery, vol. 20, no. 4, pp. 261-272, 1957.
- Z. B. M. Niazi, T. J. H. Essex, R. Papini, D. Scott, N. R. McLean, J. M. Black, "New Laser Doppler Scanner, a Valuable Adjunct in Burn Depth Assessment", Burns , vol. 19, no. 6, pp. 485-489, 1993.
- G. L. Hansen, E. M. Sparrow, J.Y. Kokate, K. J. Leland, P. A. Iaizzo, "Wound Status Evaluation using Color Image Processing", Trns. on Medical Imaging, vol. 16, no. 1, pp. 78-86, Feb. 1997.
- J. Liu, K. Bowyer, D. Goldgof, S. Sarkar, "A Comparative Study of Textures Measures for Human Skin Treatment", Proc. of Int. Conf. on Information, Communications and Signal Processing ICICS'97, pp. 170- 174, Singapur, 1997.
- L.M. Lifshitz, S.M. Pizer, "A Multiresolution Hierarchical Approach to Image Segmentation Based on Intensity Extrema", IEEE Trans. on Pattern Analysis and Machine Intelligence, vol. 12, no. 6, 1990, pp. 529-539.
- J.J. Koenderink, "The structure of images," Biol. Cybern., 1984, 50, pp. 363-370.
- C.Serrano, D.Santos, B.Acha, "Multiresolution Color Segmentation Algorithm with Application to Medical Images", Int. Conf. Signal and Image Processing, Nov. 2000, Las Vegas (USA), pp. 411-415.
- G. Wyszecki and W.S. Stiles, Color Science: Concepts and Methods, Quantitative Data and Formulae (New York: Wiley, 1982).
- Linde, Y. and Buzo, A. and Gray, R.M, "An algorithm for vector quantizer design", IEEE Trans. On Communications, vol.28, no. 1, pp. 84-95, 1980.
