X-ray diffraction analysis of crystalline and amorphous rare earth (III) (Y, La, Eu) complex
 (Y, La, Eu) complex")
Author: Gerile N., Alata H., Ruxia D., Lian H., Lijuan Z., Tegus O.
Journal: Вестник Бурятского государственного университета. Химия. Физика @vestnik-bsu-chemistry-physics
Article in issue: 2-3, 2016.
Free access
Acylaminocarboxylato-Rare earth complex were prepared by chemical reaction method in aqueous solution. Structure and properties of the complexes were analyzed by X-ray diffraction analysis. It was shown that complex has both crystalline and amorphous states. Сhemical compositions of the rare earth complexes were determined. Comparison of three complexes shows that lanthanum complexes tend to easily crystallize, europium complexes tend to vitrify easily.
Chemical method, rare earth elements, x-ray diffraction, structure, amorphous
Short address: https://sciup.org/148316654
IDR: 148316654 | UDC: 54.062 | DOI: 10.18101/2306-2363-2016-2-3-69-74
Рентгеновский анализ кристаллов и аморфных комплексов (Y, La, Eu) (III)
Ациламинокарбоксилато-редкоземельные комплексы были получены методом химической реакции в водном растворе. Структура и свойства комплексов были проанализированы с помощью рентгеновской дифракции. Было показано, что комплексы имеют как кристаллическое, так и аморфное состояния. Химические составы редкоземельных комплексов были определены. Сравнение трех комплексов показывает, что комплексы с Лантаном имеют тенденцию легко кристаллизоваться, комплексы с Европием, как правило, легко стеклуются.
Text of the scientific article X-ray diffraction analysis of crystalline and amorphous rare earth (III) (Y, La, Eu) complex
A series of acylaminocarboxylato-Rare earth (III) (Y, La, Eu) Complex were prepared by chemical reaction method in aqueous solution (Y, La, Eu) complex. The composition and structure of rare earth complex were analyzed by using elemental analysis and X-ray diffraction analysis. The results of elemental analysis show that the rare earth complexes form M(C 10 H 20 NCO 3 ) 3 (M=Y, La, Eu) molecular structure. X-ray diffraction results show that the Crystalline compounds exhibit clear peaks in XRD patterns, and the glassy state complexes show broad peak characteristic for amorphous state.
Experimental
The preparation methods of ligands and complexes are referred to the literature [1, 2]. The elemental (CHN) analyses were performed using Perkin-Elmer model
2400II. Table 1 shows the calculated and measured values of C, H, N elemental analysis for crystalline and glassy state rare earth complexes. The water content in the Complexes was examined by Karl fischer titration method. In addition, the chemical composition of the rare earth (III) complexes was determined using 13C NMR Nuclear magnetic resonance (NMR) spectroscopy. As can be seen from Table 1, the measured and calculated values of these elements are within the allowable error range. Furthermore, the results of elemental analysis and 13C NMR analysis results are consistent, and the chemical composition of the rare earth complexes can be determined to be [CH 3 (CH 2 ) 6 CONHCH(CH 3 )COO] 3 M∙xH 2 O (M is Y, La, Eu; x is 1, 2) .
Table1
Elemental analysis of the Rare earth Solid complexes
|
Metal complexes |
Calculated value % |
Measured value % |
||||
|
C |
H |
N |
C |
H |
N |
|
|
Y(oct-ala) 3 ·2H 2 O crystalline |
51.64 |
8.35 |
5.48 |
51.62 |
8.38 |
5.46 |
|
Y(oct-ala) 3 ·H 2 O glassy |
52.86 |
8.34 |
5.60 |
52.63 |
8.36 |
5.64 |
|
La(oct-ala) 3 ·H 2 O crystalline |
49.55 |
7.81 |
5.26 |
49.43 |
7.73 |
5.49 |
|
La(oct-ala) 3 ·H 2 O glassy |
49.55 |
7.81 |
5.26 |
49.49 |
7.75 |
5.52 |
|
Eu(oct-ala) 3 ·2H 2 O crystalline |
47.68 |
7.77 |
5.06 |
47.62 |
7.73 |
5.09 |
|
Eu(oct-ala) 3 ·H 2 O glassy |
48.81 |
7.65 |
5.18 |
48.97 |
7.68 |
5.17 |
Results and discussion
Fig. 1 shows WAXD patterns of crystalline and glassy state rare earth complexes, in the test range of 2θ = 0°~60°. Fig. 1(a) and (b) for the Y(oct - ala)3 diffraction spectrum, (c) and (d) is La (oct - ala)3 diffraction spectrum, (e) and (f) is Eu(oct-ala)3 diffraction spectrum. The glassy yttrium, lanthanum, europium complexes Containing one water molecule show broad amorphous diffraction peaks, complexes comprising two water molecules (among them only Lanthanum complex contains one water molecule) show sharp crystalline diffraction peaks. The flattest baseline and the highest peak are seen in the Lanthanum complex. On the other hand, for the europium complex, the baseline is waved to the largest extent and the peak intensity is the lowest. Comparison of three complexes shows that lanthanum complexes have a trend to easily crystallize, europium complexes tend to vitrify easily. The broad scattering curve appeared at around 2θ = 23°~26° originates from the methylene–methylene entanglement interaction and indicates the loss of in-plane ordering, i.e. disordered alkyl-chains. These profiles are independent of the method of formation of the glassy state (precipitation from solution or annealing treatment), but depend on the central metals. The peak halfwidths increase in the order of Y(oct-ala)3 (peak half-width = 7.7o) (fig. 1(b)) < La(oct-ala)3 (peak half width = 8.4o) (fig. 1(d)) < Eu(oct-ala)3 (peak half width = 10.2o) (fig. 1(f)). This order reflects the magnitudes of the disordering of the glassy states and follows the order of the rare earth atomic numbers. However, there is direct relationship with the glass transition temperatures (the lower transition temperatures are observed at 49, 50 and 55oC, for europium, yttrium, and lanthanum complexes, respectively).
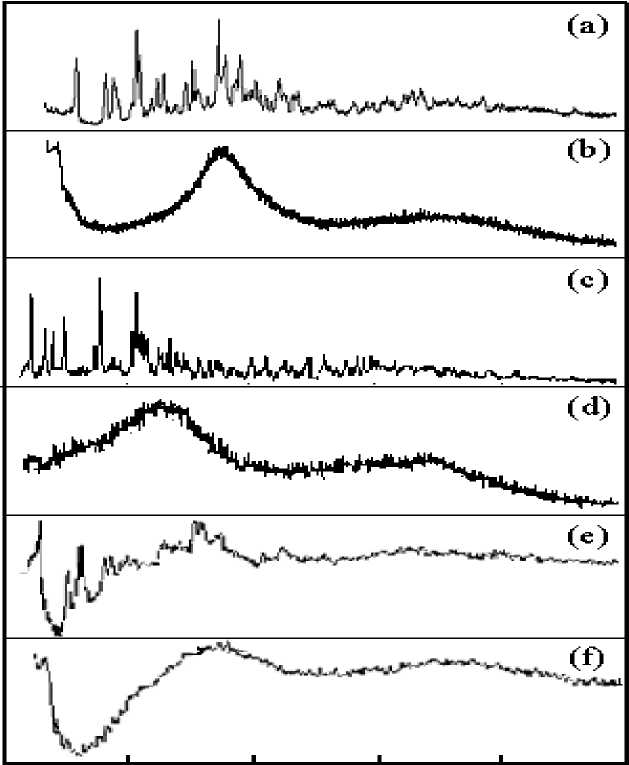
Ю 20 30 40 50 60
Fig. 1. WAXD patterns of metal complex (a) crystalline Y(oct-ala) 3 ∙2H 2 O; (b) glassy Y(oct-ala) 3 ∙H 2 O; (c) crystalline La(oct-ala) 3 ∙H 2 O; (d) glassy La(oct-ala) 3 ∙H 2 O; (e) crystalline Eu(oct-ala) 3 ∙2H 2 O; (f) glassy Eu(oct-ala) 3 ∙H 2 O
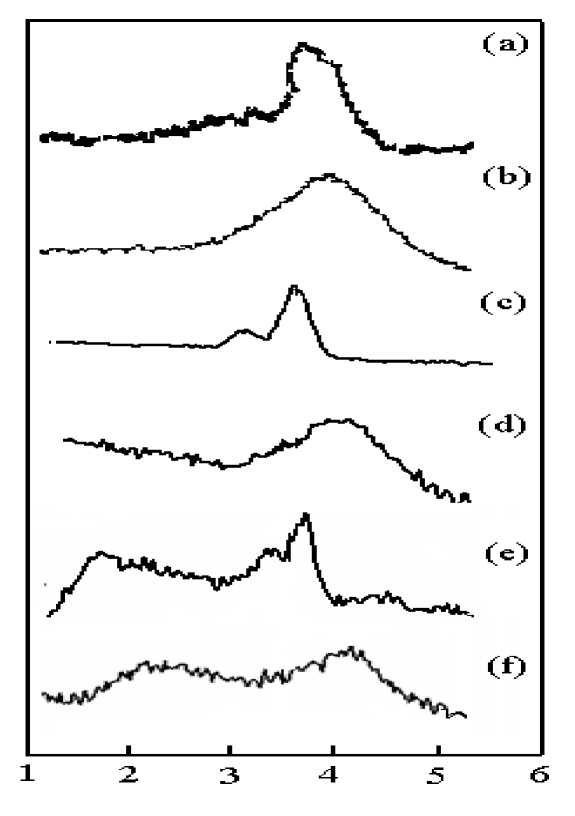
Fig. 2. SAXS patterns of metal complexes (a) crystalline Y(oct-ala) 3 ∙2H 2 O; (b) glassy Y(oct-ala) 3 ∙H 2 O; (c) crystalline La(oct-ala) 3 ∙H 2 O; (d) glassy La(oct-ala) 3 ∙H 2 O; (e) crystalline Eu(oct-ala) 3 ∙2H 2 O; (f) glassy Eu(oct-ala) 3 ∙H 2 O
Table 2
The d-spacing estimated from SAXS profiles
|
Metal complexes |
2 6 / ◦ |
d/nm |
|
Y(octnt) 3 ·2H 2 O crystalline |
3.35 |
2.5 |
|
Y(oct-ala) 3 ·2H 2 O crystalline |
3.37 |
2.4 |
|
Y(oct-ala) 3 ·H 2 O glassy |
4.07 |
2.2 |
|
La(octnt) 3 ·H 2 O crystalline |
3.30 |
2.5 |
|
La(oct-ala) 3 ·H 2 O crystalline |
3.38 |
2.5 |
|
La(oct-ala) 3 ·H 2 O glassy |
4.09 |
2.1 |
|
Eu(octnt) 3 ·H 2 O crystalline |
3.40 |
2.6 |
|
Eu(oct-ala) 3 ·H 2 O crystalline |
3.50 |
2.5 |
|
Eu(oct-ala) 3 ·H 2 O glassy |
4.10 |
2.2 |
Small angle X-ray scattering (SAXS) was performed to confirm the cyclical nature of the metal complexes. The SAXS profile is expected to provide information on supramolecular structures in solid states. Fig. 2 shows the SAXS patterns of crystalline and glassy state rare earth complexes in the test range of 2θ = 0°~10°. From fig. 2 we can see that crystalline complexes display a Bragg reflection based sharp diffraction peak, and the glassy state metal complexes show amorphous diffraction peak width. The SAXS test results are listed in Table 2. From the SAXS results, the d-spacing's for the glassy states are 2.1~2.2 nm, which are significantly smaller than those for the crystalline states (the d-spacings for the crystalline states are 2.4~2.6 nm). SAXS analysis reflects the short range order and disorder characteristics of the rare earth complexes. The extension of the diffraction peak of the glassy state shows that the glassy state is essentially an over cold liquid, and its structure is characterized by short range order and long range disorder.
Acknowledgements
This work is supported by The Natural science fund project in Inner Mongolia (2014MS0211); Inner Mongolia talent development fund (2014); Inner Mongolia normal university scientific research funding (2013 YJRC001).
References X-ray diffraction analysis of crystalline and amorphous rare earth (III) (Y, La, Eu) complex
- Gerile Naren, Rie Masuda, Masayasu Iida, Masafumi Harada, HiromichiKurosu, Toshiharu Suzuki and Takayoshi Kimura, Formation of molecular glasses and the aggregation in solutions for lanthanum (III), calcium (II), and yttrium (III) complexes of octanoyl-DL-alaninate // Dalton Trans. - 2008. - V.13. - P. 1698-1709.
- Gerile Naren, Ami Yasuda, Masayasu Iida, Masafumi Harada, Toshiharu Suzuki and Masako Kato, Aggregation in methanol and formation of molecular glasses for europium(III) N-acylaminocarboxylates: effects of alkyl chain length and head group // Dalton Trans. - 2009. - V. 28. - P. 5512-5522.
