XRD analysis on soot and ash from coal combustion

Author: Vanchinkhuu J., Bayanjargal E.
Journal: Вестник Бурятского государственного университета. Химия. Физика @vestnik-bsu-chemistry-physics
Article in issue: 2-3, 2016.
Free access
Products such as soot and ash emitted from coal combustion in heating stove for traditional Mongolian ger and small houses have been analyzed. The amorphous phase in soot and ash is identified by using the method of quantitative analysis based on the Rietveld method. The crystalline phases in soot and ash are mainly formed by graphitic carbon (rhombic, R3 (146), a=2.45Å, c=10.04Å, V=52.47Å3, Z=6)). Soot and ash are composed of crystal structure of elements (S, Ca, Fe, Na, Si, Al, Mg) included in combust coal and chemical compounds (CaSO4, SiO2, Fe2O3, CaSO4∙2(H2O), MgSO4∙6(H2O) formed in combustion process as well as the graphitic carbon. The results are checked by SEM-EDS analysis. By using the Debye-Scherrer equation the average crystallite size of carbon ball giving clearer XRD pattern is estimated. The results of analysis show that the content of amorphous phase in soot is greater than that of ash. Also, the temperature is the key factor formation of crystalline and amorphous phase.
Soot, ash, coal combustion, coal composition, amorphous and crystalline phase, structural analysis
Short address: https://sciup.org/148316649
IDR: 148316649 | UDC: 538.953 | DOI: 10.18101/2306-2363-2016-2-3-18-25
Рентгено-структурное исследование продуктов горения угля
Были исследованы образцы саж и зол, осаждаемых из продуктов горения углей, сжигаемых в малогабаритных обиходных печурках юрт и домиков. Количественное содержание аморфной фазы саж и зол было определено методом Ритвельда, В кристаллической саже и золе была обнаружена графитовая структура углерода (ромбическая, R3 (146), a=2.45Å, c=10.04Å, V=52.47Å3, Z=6)). Кроме того, в продуктах горения углей содержатся химические элементы (S, Ca, Fe, Na, Si, Al, Mg) в виде кристалликов соединений (CaSO4, SiO2, Fe2O3, CaSO4∙2(H2O), MgSO4∙6(H2O)), возникших в процессе горения графического углерода. Эти результаты были проверены методом SEM-EDS анализа. Средний размер кристаллической ячейки определен рентгеноспектральным методом, используя формулы Дебая- Шеррера. По количеству аморфной части сажи было больше, чем аморфной части золы. Основную роль при образовании аморфных и кристаллических фаз играет температура.
Text of the scientific article XRD analysis on soot and ash from coal combustion
In many resources on combustion products, the soot or the graphitic carbon is specified both “black carbon” and “elemental carbon”. The reason that different terms are used for soot is the lack of generally accepted terms for it. These names are given in consistent with determination and research method of soot. Particularly, the term “black carbon” is mainly used in determining it by optical methods and this term implies that the soot particulates are absorbing material for visible light. But, the term “elemental carbon” is used in chemical determinations. However, all study accept for the dispersed “stuff” termed as these names is the main constituent of soot. That is the soot is dispersed system [1].
Inevitable consequence of combustion is emission of smoke. Smoke is a medium (multiphase system) consisting of more than one phase or components as namely different gases, liquid drops and solid particulates. The solid and liquid phases of smoke are condensed on the surface of barrier when they reach to relatively cold range. The red like color of flame, observed in wood and coal combustion is generated by thermal radiation from soot particulates and this becomes the indication that the soot is formed outside combustion. It should be noted that the smoke is the effect of incomplete combustion.
The primary seeds of soot particulates are the compounds of polycyclic aromatic hydrocarbons. As for composition, soot is inhomogeneous and its substantial part is composed of carbon whereas the percentage up to 10 is made of hydrogen. The ratio of carbon and hydrogen atoms in soot ranges 1-8. This ratio increases linearly with its diameters. This tells us that hydrogen atoms settle down on the surface of soot particulate [2]. The average density of soot is 2 g/cm3 Aerodynamic diameter of soot particulate is small, but its specific surface is high. So it can be used as an absorber [3]. It is claimed that substances in soot are contained in either crystal or amorphous phase in some references [3-4].
This article is addressed to elemental and structural analysis on soot and ash emitted from coal combustion.
S ampling
Soot is collected on chimney surface as a result of inertial and condensation settlement when smoke from combustion is ascending. The magnitude of soot settled on collecting surface depends on type and composition of fuel, fuel quantity, combustion regimes, as well as on climate and weather conditions. The soot and ash analyzed in this article are emitted from coal combustion in heating stove which is widely used for residential Mongolian ger and small houses. To collect high amount of soot, it is required to combust much more fuel in this type of stove because the combustion in the stove is nearly complete.
We used chimney of five sections, each of which has 0.67 m length. The soot settled on surface of each section was removed and collected. By the way, we enumerate the sections starting from the highest one descending as shown on fig. 1.
-1 = 1
n= 2
n= 3
n= 4

Fig. 1. Sketch of stove, chimney and numbering of chimney sections
The mass of soot on sections
Table 1
|
Section number, n |
1 |
2 |
3 |
4 |
Base layer |
|
m, g |
54.35 |
95.61 |
43.17 |
58.82 |
90.53 |
There is not only settled soot on the last section, but also small amounts of fly ash can be found. The soot on the surface in this section burns down since the surface is intensively heated during the active combustion. The ash from this section was not analyzed because we assumed that its composition was the same as the bottom ash. Instead, we analyzed the sample from bottom ash.
After taking out the easily removed soot from the surface, also the soot layer, rather fixed in surface is left. Soot from this layer is specified as the base layer through this article.
XRD analysis on soot and ash
We have analyzed the samples of soot and ash, collected as mentioned in the previous section, by using the XRD analysis to identify composition of crystalline and amorphous phases. We used X-ray diffractometer MAXima_X XRD-7000.
In experiment of analysis, we used X-ray tube with copper anode which has characteristic line Cu kα1 = 1.5406 Å at 40 kV voltage and 30 mA current. Through the experiment, Bragg’s angle is fixed in the range of 2θ = 50÷800 with step size of ∆2θ = 0.020 and a scan time per step is 1.2 s.
The data processing is executed by the software X’Pert HighScore Plus v2.0a which has databases ICSD and ICDD-PDF2, internationally accepted for XRD pattern analysis of crystal composition. The results of qualitative analysis for crystalline phases are given in Table 2. And the corres-ponding XRD patterns are shown in fig. 2.
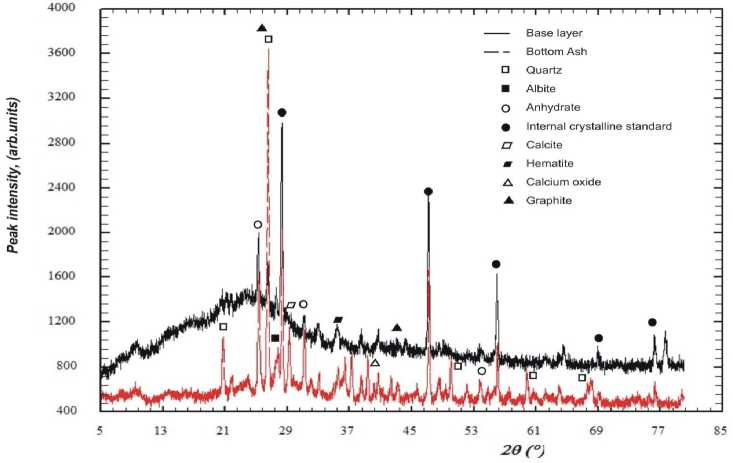
Fig. 2. XRD pattern for base layer and bottom ashTable 2
Results of qualitative analysis for crystalline phases on soot and ash
|
Entry Ref. number in ICDD databases |
Mineral name |
Chemical formula |
Crystallographic data |
|
00-037-1496 |
Anhydrate |
CaSO 4 |
Orthorhombic, Bmmb (63), a=6.99Å, b=7.00Å, c=6.24Å, V=305.60Å3, Z=4 |
|
00-046-1045 |
Quartz |
SiO 2 |
Hexagonal, P3221 (154), a= 4.91Å, c=5.40Å, V=113.01Å3, Z=3 |
|
00-076-0603 |
Hematite |
Fe 2 O 3 |
Rhombohedral, R-3c (167), a=5.03Å, c=13.74Å, V=301.75Å3, Z=6 |
|
00-0741905 |
Gypsum |
CaSO 4 2(H 2 O) |
Monoclinic, C12/c1 (15), a=5.68Å, b=15.18Å, c=6.52Å, β=118.380, V=494.61Å3, Z=4 |
|
00-024-0719 |
Hexahydrate |
MgSO 4 6(H 2 O) |
Monoclinic, A2/a (15), a=24.44Å, b=7.21Å, c=10.11Å, β=98.280, V=1766.12Å3, Z=8 |
|
00-026-1079 |
Graphite |
C |
Rhombohedral, R3 (146), a=2.45Å, c=10.04Å, V=52.47Å3, Z=6 |
|
00-081-0464 |
Goethite |
FeO(OH) |
Orthorhombic, Pbnm (62), a=4.60Å, b=9.95Å, c=3.02Å, V=138.64Å3, Z=4 |
|
00-086-2339 |
Calcite |
Ca(CO 3 ) |
Rhombohedral, R-3c (167), a=4.98Å, c=17.12Å, V=368.31Å3, Z=6 |
|
00-009-0466 |
Albite |
NaAlSi 3 O 8 |
Monoclinic, C12/m1 (12), a=8.14Å, b=12.78Å, c=7.16Å, α=β=900, γ=87.670, V=664.84Å3, Z=4 |
|
00-078-0649 |
Calcium oxide (Lime) |
CaO |
Cubic, Fm-3m (225), a=4.80Å, V=110.94Å3, Z=4 |
The amount of crystal and amorphous phases in soot and ash is identified by the quantitative analysis method based on the Rietveld method which is widely used in crystal structure analysis. In this method, data processing is done by the Rietveld method.
To determine the actual content of crystalline and amorphous phases correctly we used the method of standard addition. In this method, the definite amounts of internal crystalline standards are added purposely to the samples to be analyzed and XRD patterns of the obtained samples are analyzed with the quantitative phase analysis based on the Rietveld refinement method. In this analysis, we chose the NIST 640c (Si, 99.99%, 320 mesh) as the internal crystalline standard phase.
When sample contains т crystalline phases as well as amorphous phases of A amount, there is the relation between the contents of crystalline and amorphous phases as following:
У ™
— л — д П
<—fi=i where: X´i - the actual amount of crystalline phase numbered with i in samples, In fact, X´i and A quantities are correspondingly expressed by following relations [5]:
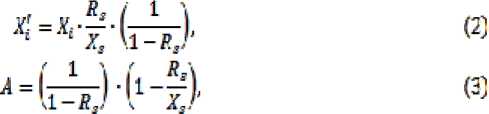
where: R s - definite amounts of internal crystalline standards added to samples, X s -the amount of internal crystalline phase in samples determined via the Rietveld quantitative phase analysis. As the same with X i , this quantity is expressed in references [5, 6] as follows:
№
Л[ 7,7'3}-(ZM?^*
where: s i - scale factor of peak intensity corresponding to i- th crystalline phase, Z -number of formula units per unit cell for crystalline phase, M - mass of formula unit, V - unit cell volume.
Table 3
Results of quantitative XRD phase analysis on soot and ash
|
Minerals and phases |
Chemical formula |
Number of samples and corresponding amount of crystalline and amorphous phases [%] |
|||||
|
Ash |
Base layer |
IV layer |
III layer |
II layer |
I layer |
||
|
Anhydrate |
CaSO 4 |
10.492 |
3.716 |
9.307 |
6.836 |
6.287 |
5.418 |
|
Quartz |
SiO 2 |
18.881 |
0.528 |
2.489 |
|||
|
Hematite |
Fe 2 O 3 |
2.128 |
2.602 |
||||
|
Gypsum |
CaSO 4 2(H 2 O) |
0.444 |
0.859 |
2.400 |
4.835 |
||
|
Hexahydrate |
MgSO 4 6(H 2 O) |
2.566 |
4.099 |
||||
|
Graphite |
C |
3.855 |
3.321 |
2.572 |
4.782 |
||
|
Goethite |
FeO(OH) |
5.872 |
4.565 |
||||
|
Calcite |
Ca(CO 3 ) |
5.380 |
|||||
|
Albite |
NaAlSi 3 O 8 |
9.828 |
|||||
|
Calcium oxide |
CaO |
2.822 |
|||||
|
Amorphous phase |
50.470 |
89.297 |
85.192 |
84.882 |
82.865 |
80.397 |
Systematic error should be minimal to refine the results of the qualitative phases analysis based on the Rietveld method. The results are given in Table 3.
We can estimate the crystallite size giving the XRD pattern by using the Debay-Scherrer formula. Particularly, we chose the sample with the amorphous phase of small amount within the samples to reduce the background noise. In estimation for crystallite size of graphite, the peak with Miller’s index (002) at Bragg’s angle ~26.440 is used. Evaluating the half-width of spectral line corresponding to the peak, the crystallite size is estimated as d ~ 28.1 µm at λ = 1.541874 Å, and at shape factor of 0.9.
The SEM-EDS analysis was done on soot and ash. The SEM image for soot is shown in fig. 3 and the corresponding spectrum given by EDS analysis is in fig. 4 as representative of the analysis. From this spectrum we see the same elements appeared on XRD patterns.
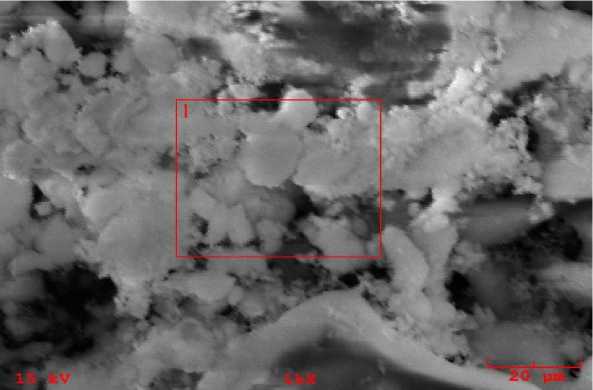
Fig. 3. The SEM image for soot
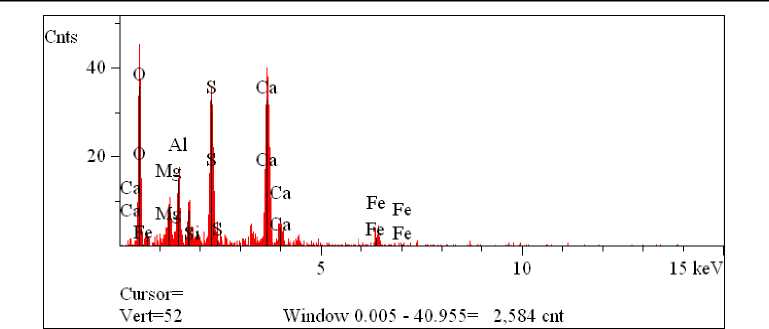
Fig. 3. The SEM-EDS spectrum for soot
RESULTS, DISCUSSIONS AND REMARKS
It is clearly seen that the soot is composed of crystal structure of elements (S, Ca, Fe, Na, Si, Al, Mg) included in combust coal and chemical compounds (CaSO 4 , SiO 2 , Fe 2 O 3 , CaSO 4 ∙2(H 2 O), MgSO 4 ∙6(H 2 O) formed in combustion process as well as the graphitic carbon form of crystal structure (Rhomb, R3 (146), a=2.45Å, c=10.04Å, V=52.47Å3, Z=6). This result is firmly compatible with other research results [7]. As the settling altitude for soot increases, the amount of calcium anhydrate in soot tends to decrease whereas the amount of gypsum in soot to increase. However, the amounts of graphite in soot differ in each section and the quantity ranges in 3-5%. Amount of amorphous phase in soot is greater than that of amorphous phase in ash. Yet, it decreases obviously with the altitude of section and this shows that temperature is significant factor on formation of phases. While the highest temperature, 1200oC in combustion is observed on the surface of burning coal, the temperature in fourth section is yet 500oC or less. Thus, we can conclude that such amorphous phases in soot are formed because of sudden cooling of smoke gases from the active combustion region. The iron oxides appeared in analysis results are supposed to be caused by corrosion of chimney surface since hematite is contained in the base layer. However, goethite appears only in soot of upper section. Then, it is concluded that the iron oxides are originated from not only the iron contained in combust coal but also from oxidation on surface. Consequently, appearance of iron in bottom ash demonstrates clearly that iron is contained in incombustible part of coal, but the amount of iron oxides in soot from the upper level section indicates that iron of combustible compound form in coal forms the iron oxides when it condenses on surface in the level of high humidity air. From the amount of crystalline phases estimated by quantitative phase analysis it is seen that main part of iron in coal is associated to combustible compound in a coal. The calculated values of criteria factors for the Rietveld refinement are correspondingly in the range of R exp = 3.14÷5.15, R wp = 4.16÷6.11, R p = 3.29÷4.82, G o F = 1.40÷2.21. This confirms that quantitative results via Rietveld refinement are acceptable.
It should be noted that the peaks on XRD patterns given by quartz and graphite are undistinguishable. Since content amount of these crystalline phases in samples is relatively small as well as they are close to each other, the peaks other than highest one are undistinguishable from the peaks of other structure. The XRD pattern of synthetic graphite has four characteristic peaks such as 26.80, (002), 100%; 42.30, (100), 11%; 44.50, (101), 9%; 54.90, (102), 6% in the Bragg’s angle range 2θ = 5o÷60o (for the listed numbers here, the first number is the Bragg’s angle corresponding to given peak, the second is the Miller’s index for plane giving the peak and the third is the relative intensity of crystalline phase). As well, the XRD pattern of -quartz in room temperature has also four characteristic peaks namely 20.80, (100), 22%; 26.60, (101), 100%; 50.10, (112), 14%; 59.90, (211), 9% in the Bragg’s angle range of 2θ = 20o÷60o. On the XRD pattern for soot, we worked, the first peak of graphite and the second of quartz are observed in overlap. To identify these peaks we used the peaks of high intensity given in another range.
References XRD analysis on soot and ash from coal combustion
- Gelencsér A. Carbonaceous Aerosol. - Springer. - 2004. - 349 p.
- Furutani H., Tsuge S. and Goto S. The dependence of Carbon/Hydrogen Ratio on Soot Particle Size // SAE Technical. - 1992. - Paper 920689.
- Law C. K. Combustion physics. - Cambridge University Press. - 2006. - 742 p.
- Lu P., Li C. et al. Research on soot of black smoke from ceramic furnace flue gas: Characterization of soot // J. of Hazardous Material. - 2012. - V. 199-200.- P. 272-281.
- Snellings R., Мachiels L., Mertens G. and Elsen J. Rietveld refinement strategy for quantitative phase analysis of partially amorphous zeolitizedtuffaceous rocks // Geologica Belgica. - 2010. - V. 13(3). - P. 183-196.
- Hill R. J., Howard C. J. Quantitative phase analysis from neutron powder diffraction data using the Rietveld method // J. Appl. Cryst. - 1987. - V. 20. - P. 467-474.
- Minjigmaa A., Zolzaya Ts., Bayanjargal E., B. Davaabal, Temuujin J. Characterization of ash pond ashes from 3rd thermal power plant by SEM/EDX and XRD methods // Mongolian Journal of Chemistry. - 2013. - V. 14(40). - P. 61-65.
