Yield contributing characters of wheat under normal and heat stress conditions

Author: Bala P., Sikder S., Azad A.K.
Journal: Журнал стресс-физиологии и биохимии @jspb
Article in issue: 1 т.20, 2024.
Free access
This study was conducted to identify yield and yield contributing attributes of wheat genotypes in response to heat stress. In this respect, eight wheat genotypes viz., Pavon-76, Prodip, BARI Gom-25, BARI Gom-26, BAW-1143, BAW-1146, BAW-1147 and BAW-118 were used as study materials. The experiment was evaluated in relation to heat tolerance in field condition by seeding them at November 27 (normal), December 17 (late) and January 7 (very late growing condition) over two successive years. Spike length, spike number per plant, floret number per spike and grain number per spike, floret/spike, spike dry weight and individual seed weight (seed size), grain yield, biological yield and harvest index were observed highest at normal growing condition. At late and very late growing heat stress conditions, all the genotypes showed reduced performance in those parameters at different magnitudes. Heat tolerant genotypes had higher relative values in those attributes than the MHT and heat sensitive genotype at late growing condition. Late and very late growing heat stress conditions increased the sterility in all the genotypes. HSI calculated in stress environments to assess their stress potential on the basis of grain yield. The HSI values of Prodip, BAW-1146, BAW-1147, BAW-1148 and Pavon-76 were higher than 1.0, indicating that these genotypes were susceptible to heat stress. The HSI values of the remaining three wheat genotypes indicate their various levels of tolerance to high temperature. Among them BARI Gom-25, BARI Gom-26 and BAW-1143 were tolerant to heat stress.
Heat stress, wheat, yield related characters
Short address: https://sciup.org/143182398
IDR: 143182398
Text of the scientific article Yield contributing characters of wheat under normal and heat stress conditions
Wheat ( Triticum aestivum L.) is a cereal crop, which belongs to the family Gramineae has grown worldwide for edible grains. Among cereals, wheat used by more than 36% of the world's population. Wheat has been grown in many countries for its versatile nature in adaptation and utility in innumerable ways (Singh et al. , 2020). Different yield related characters were identified as contributing to heat tolerance in wheat. The most responsive yield components are grain number per spike, grains per spikelet, grain weight, rate of grain filling, biomass at harvest (Zhong-hu and Rajaram 1994). In addition to these characters, other physiological characters like chlorophyll retention, stem reserves mobilization (Blum et al. 1994, Sikder and Paul 2010), canopy temperature depression (Reynolds et al. 1994; Sikder and Paul 2010) and stomatal conductance (Reynolds et al., 1994) have been associated with performance of irrigated wheat under high temperature level which would be used as to identify comparatively tolerate genotypes. Heat stress due to late planting is the main reason for the lower yield per unit area in wheat (Hura, 2020; Tahir et al. , 2022). Heat stress during post-anthesis (grain-filling stage) affects availability and translocation of photosynthates to the development of kernels and starch synthesis and deposition within the kernel, thus resulting in lower grain weight and altered grain quality (Mohammadi et al. 2004). It has been observed that each degree rise in ambient temperature reduces the yield by 3-4% (Mishra 2007). In this regard, the present study was carried with the aim out to identify the wheat genotypes with tolerance to late planting heat under genotype by environment interactions, yield traits under different planting regimes.
MATERIALS AND METHODS
The experiment was conducted in the research field of Crop physiology and Ecology Department, Hajee Mohammad Danesh Science and Technology University, Dinajpur, Bangladesh from November to April of 2011-12 and 2012-2013. Eight genotypes viz. Prodip, BARI Gom-25, BARI Gom-26, BAW-1143, BAW-1146, BAW-1147, BAW-1148 and Pavon-76, was used as
experimental materials. The experimental design was a split plot with three sowing dates. Three main plots were considered as treatment plots. Each main plot was subdivided into three replication plots each of 4×2.5 m2 containing all the eight genotypes assorted randomly. Seeds were sown on 27 November (Normal), 17 December (Late) and 7 January (Very late). Three irrigations were applied at CRI, flowering and grain filling stage. In each year, there were 9, 8 and 8 harvests for normal, late and very late growing conditions, respectively with equal intervals of 10 days and the first harvest was taken at 20 days after sowing (DAS). At each harvest, the plants were cut off at the ground level and the tops were separated into leaves, stem and panicle (if present).The harvested plant parts were kept in an electrical oven at about at 70º C for 72 hours and the dry weights of these parts were taken by an electrical balance and expressed in grams. Different yield characters were measured in following ways:
Number of spikes per plant
Number of spikes counted from ten random selected plants in each plot at harvest and the mean value was calculated.
Spike characteristics
Ten spikes were collected randomly from each plot and mean value was calculated to record the spike characteristics.
-
1. Spike length (excluding awn) -was measured manually using scale.
-
2. Number of spikelets per spike- number of florets per spike and spikelet, number of grains per spike and spikelet were counted manually and floret sterility (%) was calculated by using the following formula (Sikder 2011).
-
3. Then the collected spikes were dried in an oven at 70º C for 72 hours. After drying the spikes were weighed and grains were separated from husk and weighed.
Floret sterility (%) = [1-(No. of kernels/spike)/ (No. of florets/spike)] ×100
Spikelets spike-1
Total number of spikelets spike-1 was calculated and averaged from ten randomly selected plants from each
plot.
Number of kernel per spike
Number of kernel per spike was counted manually. Ten spikes were selected randomly from each plot and the average number of kernel per spike was calculated.
Seed size
From each plot a sub-sample of thousand grains were taken randomly from dried samples and the total weight was recorded by an electric balance. From the grain weight average seed size was calculated.
Biological yield and grain yield
The samples were collected from an area of 1 meter ×1 meter from the centre of each plot by cutting the plant at the ground level and was collected in a cloth bag . The samples were dried in the sun, threshed and cleansed and dry weights of grain, straw and husk were recorded. The biological yield and grain yield were expressed in ton per hectare (t/ha). Grain yield was also adjusted to 12% moisture content.
Biological yield (t/ha) = straw yield + seed yield+ husk
Harvest index
Harvest index was calculated as the ratio of grain yield to biological yield (Donald and Hamblin 1976) and expressed in percentage. The harvest index was worked out as indicated below.
HI (%)= Grain Yield/Biological Yield × 100
Heat susceptibility index
Heat susceptibility index (S) was calculated for yield as described by Fischer and Maurer (1978).
S = (1- Y/Yp) / (1- X/Xp)
Where,
Y = Yield of a genotype in a stress environment
Yp = Yield of a genotype in a stress-free environment
X = Mean of Y of all the genotypes
Xp = Mean of Yp of all the genotypes.
(S < 1.0, stress tolerant and S > 1.0, stress susceptible)
Statistical analysis
The data were analyzed by partitioning the total variance with the help of computer by using MSTAT-C
computer package (Russell, 1994). The treatment means were compared using Duncan’s Multiple Range Test (DMRT) (Duncan, 1955) at P≤0.05. Correlation and Regression analysis was also done and level of significance was tested with t-test (Singh and Choudhary 1985).
RESULTS AND DISCUSSION
Spike length
The spike length of eight wheat genotypes at different growing conditions is presented in Tables 1 and 2 for 2011-12 and 2012-13, respectively. Under normal growing condition, the highest spike length was found in BAW 1143 (11.21cm and 12.17 cm for first and second year, respectively). Pavon-76 obtained the lowest value of spike length (9.80cm) for first year and 9.85 cm was in second year.
Under very late growing condition, HT genotype BAW-1143 showed the highest spike length (9.88 cm and 9.90 cm for first and second year, respectively) which was statistically similar with the other HT genotypes (BARI Gom-26, BARI Gom-25 and Prodip). HS genotype Pavon-76 had the lowest spike length (6.42cm and 7.50 cm for first and second year, respectively).
Under late and very late growing conditions, the spike length of all the genotypes was significantly more reduced compared to normal and late growing conditions. But the magnitudes of reduction were different among the genotypes.
Spike length was reduced when it was grown in high temperature and high temperature resulted in smaller organs. Hossain et al. (2012a) found that in stress conditions all the genotypes had shorter spikes. It was due to low air and soil temperature from sowing to vegetative stages of the normal sowing crop and high temperature to reproductive stages of the late and very late sowing conditions. This reduction was occurred due to high temperature as it reduces the life span of wheat. Number of spikes per plant
The number of spikes per plant of eight wheat genotypes at different growing conditions is shown in Tables 3 and 4 for first and second year, respectively. The interaction effect of growing conditions and genotypes significantly influenced the spike number per plant.
Under normal growing condition, HT genotype BAW-1143 had the highest spike number per plant (7.53 and 7.63 for first and second year, respectively), which was statistically similar to BARI Gom-26, BARI Gom-25 and Prodip for both the years. Genotypes BAW-1146, BAW-1147 and BAW-1148 were statistically similar for both the years. However, Pavon-76 attained the lowest spike number (4.70 and 5.02 for first and second year, respectively).
Under late growing condition, HT genotype BAW-1143 had the highest spike number per plant (7.12 and 6.53 for the first and the second year, respectively), which was statistically similar to BARI Gom-26 for first year and for second year it was at par with all genotypes except Pavon-76. Pavon-76 attained the lowest spike number (4.11and 4.45 for the first and second year, respectively).
At very late growing condition, the spike number per plant of all the genotypes was decreased. In this heat stress condition, the HT genotype BAW-1143 attained height number of spike per plant (6.60 and 5.72 for the first and second year, respectively). Whereas, genotype Pavon-76 had the lowest number of spike per plant (3.72 and 3.74 for the first and second year, respectively). At this heat stress condition, all the genotypes reduced their number. But these values were highest in Pavon-76 (20.85% and 25.50 % for the first and second year, respectively).
The economic yield of most cereals is determined by the number of productive spikes. Number of spikes depends on the genotype and on the conditions to which the crop is exposed during growth. The general hypothesis is that plants in their initial stages of development may adapt more easily to their environment.
The significant difference in number of spikes among genotypes is the genetic background of the varieties and the conditions to which the crop is exposed during growth. Late planting suffered mostly due to a drastic reduction in ear. Hossain et al. (2011) observed that number of spikes of wheat genotypes was reduced in Late sowing date and very late sowing date due to low temperature stress at the tillering stage (vegetative stage).
Results from other studies showed that spike number per plant was not significantly influenced by late sowing (Hasan et al. 2007). Hu and Rajaram (1994) reported that ear number per plant was less sensitive while the yield, grain per ear, biomass and plant height were more sensitive to high temperature. Shanahan et al. (1990) stated that heat tolerant genotypes were associated with productivity under extreme temperature.
Number of florets per spikelet
Results showed that number of florets per spikelet varied significantly by the combined effect of sowing times and genotypes (Tables 5 and 6) for the first year and the second year, respectively). Under normal growing condition, there were no significant differences among
However, the HT genotype BAW-1143 had the highest floret number per spikelet (4.98 for first year and 4.90 for second year) and the lowest in Pavon-76 (4.15 for first and 4.17 for second year).
At late growing condition, floret number per spikelet in genotypes Prodip, BARI Gom-25, BARI Gom-26, BAW-1143 and BAW-1146 were statistically similar but it was highest in BAW-1143 (4.75 for first year and 4.78 for second year) and genotype Pavon-76 had the lowest value (3.75 for first year and 3.76 for second year).
Under very late growing condition, all the genotypes reduced their floret number per spikelet at different degrees. But only the HS genotype Pavon-76 significant reduced their floret number per spikelet (3.20 for first year and 3.29 for second year).
Reduction from normal to late growing condition Pavon-76 showed the highest value (21.69% and 21.10% for first and second year, respectively). Genotype BAW-1143 reduced the lowest (13.65% and 11.63% for first and second year, respectively).
In relative performance to normal growing condition, HT genotypes BAW-1143, BARI Gom-25, BARI Gom-26 and Prodip showed the higher relative value for florets number per spikelet (86.35% to 80.85% and 88.37%to 81.09% for the first and second year, respectively).
This trial extremely reduced by delayed planting. Significant reduction in floret number per spikelet in wheat was reported by Shpilar and Blum (1991). A similar response has been reported for wheat by Mohammad et al. (2011).
Number of florets per spike
The interaction effect of growing condition and genotype on floret number per spike was significant for both the years. The floret number per spike of eight genotypes at different growing conditions is shown in Table 7 and 8 for the first and second year, respectively. Under normal growing condition, BAW-1143 had the highest floret number per spike (92.50 and 92.22 for the first year and second year, respectively) Statistically similar data was found in genotypes BARI gom-25, BARI gom-26 and Prodip (89.88, 90.13; 89.21 for the first year) and in second year it was 89.03,91.31 and 86.87 respectively). The lowest value was found in HS genotype Pavon-76 (72.09 and 73.27 for the first and second year, respectively).
Under late growing condition all the wheat genotypes showed reduced floret number per spike compared to normal growing condition. At this growing condition, the floret number per spike BAW-1143 (87.02 and 88.72 for the first and second year, respectively) had the highest floret number per spike and Pavon-76 showed the lowest value (64.10 and 62.04 for the first and second year, respectively).
Under very late growing condition, the floret number per spike of all genotypes (both HT and the HS) significantly reduced compared to normal and late growing conditions. The reduction of floret number per spike of HT genotypes BAW-1143, BARI Gom-26, BARI Gom-25 and Prodip were lower compared to HS genotype. At this heat stress growing condition, the HT genotype BAW-1143 attained the highest floret number per spike (75.55 and 77.16 for the first and second year, respectively) while the HS genotype Pavon-76 had the lowest floret number spike (48.56 and 50.50 for the first and second year, respectively). In this heat stress condition, HS genotype Pavon-76 showed the highest (32.64) reduction for both the first and second year. Other MHT genotypes reduced at the same rate such as BAW-1146 (32.54% and 26.50% for the first and second year respectively), BAW-1147 (31.56% and 25.06% for the first and second year, respectively).
In relative performance HT genotype BAW-1143, BARI Gom-25, BARI Gom-26 and Prodip attained higher relative values for both the years (81.68% to 71.98% and 83.67% to 73.18% for the first and second year, respectively; Figure 1) compared to HS genotypes Pavon-76 and MHT genotypes BAW-1148 (67.36% to 71.65% and 71.65 % to 70.64% for the first and second year, respectively).
Spike condition is one of the yield components that have most affect on grain yield. Floret per spike extremely reduces by delayed planting. Significant reduction in floret number per spike in wheat was reported by Shpilar and Blum (1991). A similar wheat response has been reported for winter wheat by Blue et al. (1990). Floret per spike showed significant variations among the genotypes of wheat (Mohammad et al. 2011).
Number of grains per spikelet
The number of grains per spikelet of eight wheat genotypes at different growing conditions is shown in Tables 9 and 10 for the first and second year, respectively. Results showed that the growing conditions significantly influenced grain number per spiklet. Under normal growing condition, the heat tolerant genotypes BAW-1143, BARI Gom-26, BARI Gom-25 and Prodip performed better compared to the MHT genotypes BAW-1146, BAW-1147, BAW-1148 and HS genotype Pavon-76 for both the years. In this growing condition, genotype BAW-1143 attained the heigher number of grains per spikelet (3.23 and 3.30 for the first and the second year, respectively) which was followed by BARI gom-26 BARI gom-25 and Prodip in both the years (3.15, 3.16, 3.10 and 3.13, 3.05, 3.08 for the first and the second year, respectively) and the lowest number of grains per spikelet was in Pavon-76 (2.60, 2.63 for the first and the second year, respectively).
Under late growing condition, number of grains per spikelet was reduced in HT, MHT and HS genotype. Genotype BAW-1143 attained the highest grain number per spikelet (3.13 and 3.16 for first and second year, respectively) and it was the lowest in Pavon-76 (2.40 and 2.44 for first and second year, respectively).
Under very late growing condition, both the HT and HS genotypes showed much reduced their grain number per spikelet compared to normal and late growing condition. This reduction was not statistically significant but there were wide variations among the different genotypes 8.05 to 12.69% and 8.54 to 12.93% for the first and the second year, respectively).
In this heat stress condition, all the four HT genotypes showed statistically higher grain number per spikelet compared to HS genotype Pavon-76.
In relative performance HT genotypes BAW-1143, BARI Gom-26, BARI Gom-25 and Prodip attained higher relative value in grain number per spikelet for both the years (87.31% to 91.95% and 90.30 % to 91.46% for the first and the second year respectively).
The yield reduction of wheat under high temperatures is associated with a less number of grains/spike and smaller grain size (Gibson and Paulsen, 1999). In late and very late conditions, higher temperature during anthesis and maturity period reduced the number of grains spikelet-1.
Floret sterility
Results of floret sterility with interaction effect of growing conditions and genotypes is shown in Tables 11 and 12 for first and second year, respectively. In normal growing condition, the HS Pavon-76 had comparatively higher (41.05% and 36.93 % for first and second year, respectively) floret sterility than the heat tolerant genotypes BAW-1143, BARI Gom-26, BARI Gom-25 and Prodip. Therefore, the late and very late growing condition increased the sterility in all the genotypes (both the HT and HS). But the degree of increment among the genotypes was varied. These increments were significant for all the genotypes. In case of relative change to normal sowing, the HS genotypes Pavon-76 had higher value compared to the HT genotypes BAW-1143, BARI Gom-26, BARI Gom-25 and Prodip
There were wide variations in floret sterility among the eight genotypes. This was due to their genetic character. Late growing post-anthesis heat stress condition increased the sterility in all the genotypes. But the degree of increment was higher in the HS genotype (Pavon-76) and MHT genotypes (BAW-1146, BAW-1147 and BAW-1148) compared to the heat tolerant genotypes (BAW-1143, BARI Gom-26, BARI Gom-25 and Prodip). At late planting wheat floret fertility was increased because stress during microsprogenesis is due to loss of pollen viability. Similar results were observed in several grain crops (Djanaguiraman et al.
2014). High temperature causes structural and functional abnormalities in reproductive organs, which leads to failure of fertilization or premature abortion of seed (Saini and Aspinal (1982). Late sowing showed higher grain abortion than the optimum sowing because of comparatively higher temperature at the grain filling stage. The decreased floret fertility may be due to poor pollen tube growth, leading to unsuccessful fertilization. Higher temperature affects translocation of nutrients to the developing pollen grains, leading to loss of pollen viability (Hess and Hesse 1994).
Seed size
The individual seed size of eight wheat genotypes at different growing conditions is presented in Table 13 and 14 for the first and second year, respectively. The interaction effect of growing conditions and genotypes statistically influenced the individual grain size. Heat tolerant genotypes attained higher grain size than the heat sensitive genotypes in both the growing conditions. Under normal growing condition, BAW-1143 had the highest grain size (49.90 mg/grain and 49.95 mg/grain for the first and second year, respectively)) and Pavon-76 obtained the lowest grain size (41.40 mg/grain and 41.42 mg/grain for the first and the second year, respectively). Genotypes BARI Gom-26, BARI Gom-25 and Prodip attained statistically similar grain size but in the second year it was slightly higher than the first year because at second year the temperature was lower than first year and yield was higher.
At late and very late growing conditions, all the genotypes significantly reduced their grain size compared to normal growing condition. In this heat stress growing condition, again the HT genotype BAW-1143 had the highest seed size and HS genotype Pavon-76 showed the lowest grain size. BARI Gom-26, BARI Gom-25 and Prodip gave statistically similar grain size at heat stress condition .Though all the genotypes reduced their grain size at heat stress condition but the degree of reduction varied among the genotypes. Comparatively HT genotypes (BAW-1143, BARI Gom-26, BARI Gom-25 and Prodip) showed lower reduction than the heat sensitive genotypes BAW-1146, BAW-1147, BAW-1148 and Pavon-76 .
Regarding reduction for individual seed size, the HT genotypes had lower value than the HS ones. Seed size of wheat genotypes decreased when exposed to heat stress due to high temperature stress (Hossain et al. 2012a and 2012b).
Reduced grain size under heat stress condition might be due to the rapid reduction in grain growth duration. Net effect of heat stress in the grain filling period was lower grain weight due to the reduction in grain filling period, grain filling rate or combined effect of both (Tashiro and Wardlaw, 1989).
Delayed sowing shortens the duration of each developmental phase, which ultimately reduces grain filling period and lowers the grain weight (Spink et al., 2000).
Grain yield
Grain yield of eight wheat genotypes at different growing conditions is shown in Tables 15 and 16 for the first and second year, respectively. The interaction effect of growing conditions and genotypes significantly influenced the grain yield. HT genotype BAW-1143 showed statistically highest grain yield, whereas HS genotype Pavon-76 had the lowest grain yield in each growing condition. The highest grain yields of BAW-1143 were 4.5, 3.82, and 2.61 t ha-1 at the normal, late and very late growing conditions, respectively for the first year. And second year these were 4.80, 3.87 and 2.75 t ha-1 at the normal, late and very late growing conditions, respectively. Whereas, the lowest grain yields of Pavon-76 were 3.15, 2.62 and 1.13 t ha-1 at the normal, late and very late growing conditions, respectively for the first and at the second year these were 3.25, 2.65 and 1.16 t ha-1 at the normal, late and very late growing, respectively. Genotypes BARI Gom-26, BARI Gom-25 and Prodip attained statistically similar grain yield in each the growing conditions at first year. In second year statistically similar grain yields were found in genotypes BARI Gom-25 and Prodip.
At late growing condition, all the genotypes showed reduced grain yield but the magnitude of reductions were different among the genotypes. Comparatively HT genotypes BAW-1143, BARI Gom-26, BARI Gom-25 and Prodip showed lower reduction in grain yield than the MHT genotypes BAW-1146, BAW-1147 and BAW-1148 and HS genotype Pavon-76.
At very late growing condition, the grain yield of all the genotypes was reduced more. Comparatively HT genotypes BAW-1143, BARI Gom-26, BARI Gom-25 and Prodip (42.00% to 50.97 and 42.71% to 50.59% for the first and second year, respectively) showed lower reduction of grain yield than the MHT genotypes and HS genotype Pavon-76.
Regarding relative performance, HT genotypes BAW-1143, BARI Gom-26, BARI Gom-25 and Prodip also attained higher relative grain yield (49 to 58 % for both the year) than the HS genotypes Pavon-76.
In the present study, yield components were significantly affected by growing conditions. In high temperature, the yield reduction was found the higher in all genotypes compared to optimum sowing. Results from other studies showed that in case of late sowing climate and soil moisture were unfavourable (high temperature, low relative humidity in the air and low soil moisture) for crop production, which ultimately affected crop growth and yield (Hossain et al., 2012 d). This assumption is also supported by Grigorova et al., (2011) who stated that the combined effects of drought and high temperature on physiology, growth, water relations, and yield are significantly higher than the individual effects. Bhatta et al., (1994) reported that some genotypes of wheat showed stability in grain yield between optimum and late planting. In sub-tropical climates like Bangladesh, excess radiation and high temperatures are often the most limiting factors affecting plant growth and final grain yield (Wahid et al., 2007; Hossain et al., 2009; Nahar et al., 2010; Hossain et al., 2011; Sikder, 2011 and Hakim et al., 2012).
However, genetic effects are not independent of environmental effects; most genotypes do not perform satisfactorily in all environments. When an interaction between a genotype and the environment occurs, the relative ranking of genotypes for yield often differs when genotypes are compared over a series of environments and/or years (Al-Otayk, 2010).
In Bangladesh, early wheat faces high temperature stress at the vegetative stage and late sowing wheat is affected at two stages: germination by low temperature stress (˂10ºC) and at the reproductive stage by high temperature (˃25ºC), which ultimately affects grain yield (Hossain et al., 2011; 2012a).
A negative linear relationship between grain yield and mean temperature was found in the present study (Figure 1). The results; therefore, show the dramatic effect to high temperature. This decline was associated with a decrease in grain yield from 0.50 t/ha by increasing 1ºC temperature in first year and in second year it was 0.343 t/ha. Grain yield was reduced by 3-4% per spike for each 1ºC rise in average mean air temperature above the optimum (15ºC) (Wardlaw et al., 1989).
Biological yield
Growing conditions and genotypes interacted significantly to govern the biological yield results are presented in Tables 17 and 18 for the first and second year, respectively. Irrespective of growing conditions there were significant variations among the genotypes. Under normal growing condition, genotype BAW-1148 had the highest biological yield (14.50 t/ha and 14.65 t/ha for the first and second year, respectively) followed by BAW-1147 (14.27 t/ha and 14.51 t/ha for the first and second year, respectively) and BAW-1146 (14.24 t ha-1 and 14.22 t ha-1 for the first and second year, respectively). Genotypes BARI Gom-26, BARI Gom-25 and Prodip showed statistically similar value of biological yield for the first year and in second year, BARI Gom-26 and BARI Gom-25 were statistically similar. In this growing condition, HS genotype Pavon-76 had the lowest biological yield (10.88 t ha-1 and 12.15 t ha-1 for the first and second year, respectively).
Under late growing condition, the genotype BAW-1146 had the highest biological yield (12.76 t/ha) for the first year which was at par with BAW-1147(12.65 t ha-1) and BAW-1148 (11.80 t ha-1) but in second year BAW-1148 (12.75 t ha-1) had the highest value. In this growing condition, HS genotype Pavon-76 also had the lowest biological yield (8.15 t ha-1 and 9.95 t ha-1 for the first and second year, respectively) like normal growing condition.
Under very late growing condition, biological yields of all genotypes were reduced by different magnitude. The genotype BAW-1148 had the highest biological yield (7.96 t/ha) for the first year which was at par with BAW-1147(7.91 t ha-1 a) and BAW-1146 (7.76 t ha-1). In second year BAW-1147 had the highest biological yield
(8.05 t ha-1) which was at par with BAW-1146, BAW-1143 and BAW-1148. In this heat stress growing condition, HS genotype Pavon-76 also had the lowest biological yield (5.03 t ha-1 and 5.15 t ha-1 for the first and second year, respectively).
From the observed data it was found that at very late growing condition, the biological yield of all the genotypes was significantly reduced at different magnitudes. This reduction was lower (34.52% to 44.45% and 33.74 % to 44.05% for the first and second year, respectively) in heat tolerant genotypes compared to heat sensitive genotype (56.36 % and 57.61% for the first and second year, respectively).
Higher relative performances were in heat tolerant genotypes to MHT and heat sensitive genotypes.
From the observed data, it was found that at late sowing condition the biological yield of all the varieties are significantly reduced at different degrees. Early sowing resulted in higher straw yield due to more number of tillers. These results are in agreement with those of Matuz and Aziz (1991). Kumar et al., (1994) reported that the straw yield decreased probably due to the fact that plant got unfavorable environment (high temperature) at vegetative stage, as a result crop became thinned and produced less tillers which in turn decreased the straw yield. Bhatta et al . (1994) reported reduced biological yield under high temperature. Hu and Rajaram (1994) concluded that biomass could be considered as a potential criterion for heat tolerance of wheat. Hossain and Teixeira da Silva (2012); Hossain et al. (2012a); Hossain et al. (2012b) Hossain et al. (2012c) and Hossain et al. (2012d) noticed that when wheat was grown from sowing to maturity at high temperatures, phenological development was rapid, leading to poor biomass production and consequently poor biological yield.
Harvest index (HI)
As a useful index of assessing the phytomass converted into useful economic yield, the harvest index was significantly influenced by the combined effect of growing conditions and genotypes and it is presented in Table 19 and 20 for first and second year, respectively. There existed significant variation among the different genotypes in each growing conditions.
Under normal growing condition, the heat tolerant genotypes BARI Gom-26, BARI Gom-25 and Prodip attained statistically similar harvest index. However, BAW-1143 had the highest HI (40.13% and 42.29 % for first and second year, respectively), whereas heat sensitive genotype Pavon-76 showed the lowest HI (28.96% and 29.15 % for first and second year, respectively).
Under late growing heat stress condition the harvest index of all the genotypes were reduced compared to normal and late growing conditions. But the reductions were different among the genotypes.
Under very late growing heat stress growing condition, the harvest index of all the genotypes was reduced compared to normal growing condition. But the degrees of reductions were different among the different genotypes. In this heat stress condition, the HI values for BAW-1143, BARI Gom-26, BARI Gom-25, Prodip, BAW-1146, BAW-1147, BAW-1148 and Pavon-76 were 36.135, 32.03, 31.56, 28.20, 25.17, 24.12, 23.16 and 24.85%, respectively in first year and in the second year the corresponding values were 28.61, 31.87, 32.54, 36.57, 26.72, 24.82, 23.40, and 22.52 %, respectively.
Table 1 : Spike length of eight wheat genotypes under normal, late and very late growing conditions in 2011-12
|
Genotypes |
Spike length (cm) |
Reduction (%) at very late growing condition compared to normal |
||
|
Normal growing condition |
Late growing condition |
Very late growing condition |
||
|
Prodip |
10.35b |
9.25def |
8.40g |
18.84 |
|
BARI Gom-25 |
10.4b |
9.30de |
8.44fg |
10.58 |
|
BARI Gom-26 |
10.5ab |
9.35ce |
8.75eg |
16.67 |
|
BAW-1143 |
11.21a |
10.25b |
9.88bd |
11.86 |
|
BAW-1146 |
10.25b |
8.22g |
7.30h |
28.78 |
|
BAW-1147 |
10.15bc |
8.25g |
7.25h |
28.57 |
|
BAW-1148 |
10.05bd |
8.30g |
7.20h |
28.36 |
|
Pavon-76 |
9.80bd |
8.21g |
7.12i |
27.35 |
|
CV (%) |
5.00 |
|||
Mean followed by same letter(s) did not differ significantly at 5% level of significance
Table 2: Spike length of eight wheat genotypes under normal, late and very late growing conditions in 2012-13
|
Genotypes |
Spike length (cm) |
Reduction (%) at very late growing condition compared to normal |
||
|
Normal growing condition |
Late growing condition |
Very late growing condition |
||
|
Prodip |
11.25b |
10.05ef |
8.92gh |
20.71 |
|
BARI Gom-25 |
11.06bc |
10.25ef |
8.86gi |
19.89 |
|
BARI Gom-26 |
11.17b |
10.12ef |
9.25g |
17.19 |
|
BAW-1143 |
12.17a |
10.87bd |
9.90ef |
18.65 |
|
BAW-1146 |
10.50ce |
8.75gi |
7.65j |
27.14 |
|
BAW-1147 |
10.35df |
8.5hi |
7.62j |
26.38 |
|
BAW-1148 |
10.15ef |
8.47hi |
7.55j |
25.62 |
|
Pavon-76 |
9.85f |
8.27i |
7.50j |
23.86 |
|
CV (%) |
5.21 |
|||
Mean followed by same letter(s) did not differ significantly at 5% level of significance
Table 3: Number of spike per plant of eight wheat genotypes under normal, late and very late growing conditions in
2011-12
|
Genotypes |
Number of spike per plant |
Reduction (%) at very late growing condition compared to normal |
||
|
Normal growing condition |
Late growing condition |
Very late growing condition |
||
|
Prodip |
7.00ab |
6.76b |
5.80ef |
17.14 |
|
BARI Gom-25 |
7.05ab |
6.82b |
5.85ef |
17.02 |
|
BARI Gom-26 |
7.12ab |
6.85ab |
5.90df |
17.13 |
|
BAW-1143 |
7.53a |
7.12ab |
6.60bd |
12.35 |
|
BAW-1146 |
6.70bc |
5.71ef |
5.58ef |
16.77 |
|
BAW-1147 |
6.60bd |
5.62ef |
5.48ef |
16.97 |
|
BAW-1148 |
6.50bd |
5.78ef |
5.28fg |
18.77 |
|
Pavon-76 |
4.70gh |
4.11hi |
3.72i |
20.85 |
|
CV (%) |
6.00 |
|||
Mean followed by same letter(s) did not differ significantly at 5% level of significance
Table 4: Number of spike per plant of eight wheat genotypes under normal, late and very late growing conditions in
2012-13
|
Genotypes |
Number of spike per plant |
Reduction (%) at very late growing condition compared to normal |
||
|
Normal growing condition |
Late growing condition |
Very late growing condition |
||
|
Prodip |
7.05ab |
5.95ad |
5.32bd |
24.54 |
|
BARI Gom-25 |
7.15ab |
6.05ac |
5.35bd |
25.17 |
|
BARI Gom-26 |
7.25ab |
6.15ac |
5.55ad |
23.45 |
|
BAW-1143 |
7.63a |
6.53ac |
5.72ad |
25.03 |
|
BAW-1146 |
6.82ab |
5.83ad |
5.25bd |
23.02 |
|
BAW-1147 |
6.72ac |
5.72ad |
5.15bd |
23.36 |
|
BAW-1148 |
6.55ac |
5.81ad |
5.00bd |
23.66 |
|
Pavon-76 |
5.02bd |
4.45cd |
3.74d |
25.50 |
|
CV (%) |
6.25 |
|||
Mean followed by same letter(s) did not differ significantly at 5% level of significance
Table 5: Number of floret per spikelet of eight wheat genotypes under normal, late and very late growing conditions in 2011-12
|
Genotypes |
No.of floret per spikelet |
Reduction(%) at very late growing condition compard to normal |
||
|
Normal growing condition |
Late growing condition |
Very late growing condition |
||
|
Prodip |
4.75ac |
4.60ac |
3.84eh |
19.15 |
|
BARI Gom-25 |
4.80ac |
4.63ac |
3.88eh |
19.16 |
|
BARI Gom-26 |
4.88ab |
4.68ac |
3.92dh |
19.67 |
|
BAW-1143 |
4.98a |
4.75ac |
4.30bf |
13.65 |
|
BAW-1146 |
4.55ad |
4.35af |
3.65gi |
19.78 |
|
BAW-1147 |
4.43ae |
4.31bf |
3.60hi |
18.74 |
|
BAW-1148 |
4.35af |
4.25bg |
3.55hi |
18.39 |
|
Pavon-76 |
4.15ch |
3.75fi |
3.20i |
21.69 |
|
CV (%) |
7.82 |
|||
Mean followed by same letter(s) did not differ significantly at 5% level of significance
Table 6: Number of floret per spikelet of eight wheat genotypes under normal, late and very late growing conditions in
2012-13
|
Genotypes |
No. of floret per spikelet |
Reduction(%) at very late growing condition compared to normal |
||
|
Normal growing condition |
Late growing condition |
Very late growing condition |
||
|
Prodip |
4.76a |
4.63ab |
3.86fg |
18.91 |
|
BARI Gom-25 |
4.82a |
4.66ab |
3.90eg |
19.09 |
|
BARI Gom-26 |
4.87a |
4.72a |
3.93bg |
19.30 |
|
BAW-1143 |
4.90a |
4.78a |
4.33ad |
11.63 |
|
BAW-1146 |
4.66ab |
4.37ad |
3.85cg |
17.38 |
|
BAW-1147 |
4.52ac |
4.32ad |
3.82cg |
15.49 |
|
BAW-1148 |
4.45ad |
4.27ae |
3.50eg |
21.35 |
|
Pavon-76 |
4.17af |
3.76dg |
3.29g |
21.10 |
|
CV (%) |
6.56 |
|||
Mean followed by same letter(s) did not differ significantly at 5% level of significance
Table 7: Number of floret per spike of eight wheat genotypes under normal, late and very late growing conditions in 2011-12
|
Genotypes |
No. of floret per spike |
Reduction(%) at very late growing condition compared to normal |
||
|
Normal growing condition |
Late growing condition |
Very late growing condition |
||
|
Prodip |
89.21b |
80.78ef |
62.82kl |
29.58 |
|
BARI Gom-25 |
89.88b |
83.78d |
63.83jk |
28.98 |
|
BARI Gom-26 |
90.13b |
85.13d |
64.88j |
28.02 |
|
BAW-1143 |
92.50a |
87.02c |
75.55h |
18.32 |
|
BAW-1146 |
85.22d |
80.60g |
57.49m |
32.54 |
|
BAW-1147 |
82.22e |
77.32g |
56.27m |
31.56 |
|
BAW-1148 |
80.38f |
75.48k |
54.24n |
32.52 |
|
Pavon-76 |
72.09i |
64.10l |
48.56o |
32.64 |
|
CV (%) |
3.27 |
|||
Mean followed by same letter(s) did not differ significantly at 5% level of significance
Table 8: Number of floret per spike of eight wheat genotypes under normal, late and very late growing conditions in 2012-13
|
Genotypes |
No. of floret per spike |
Reduction(%) at very late growing condition compared to normal |
||
|
Normal growing condition |
Late growing condition |
Very late growing condition |
||
|
Prodip |
86.87cd |
81.63ef |
63.57km |
26.82 |
|
BARI Gom-25 |
89.03bc |
84.30de |
64.82kl |
27.19 |
|
BARI Gom-26 |
91.31ab |
86.23cd |
65.91k |
27.82 |
|
BAW-1143 |
92.22a |
88.72bc |
77.16hi |
16.33 |
|
BAW-1146 |
84.58de |
78.31gh |
62.17lm |
26.50 |
|
BAW-1147 |
81.81ef |
76.81hi |
61.31m |
25.06 |
|
BAW-1148 |
80.32fg |
74.98ij |
60.74n |
24.38 |
|
Pavon-76 |
73.27j |
62.04lm |
50.50o |
31.08 |
|
CV (%) |
4.23 |
|||
Mean followed by same letter(s) did not differ significantly at 5% level of significance
Table 9: Number of grains per spikelet of eight wheat genotypes under normal, late and very late growing conditions in
2011-12
|
Genotypes |
No. of grains per spikelet |
Reduction(%) at very late growing condition compared to normal |
||
|
Normal growing condition |
Late growing condition |
Very late growing condition |
||
|
Prodip |
3.05ad |
2.90bf |
2.76dh |
9.51 |
|
BARIGom-25 |
3.10ac |
2.96ae |
2.82cg |
9.03 |
|
BARIGom-26 |
3.15ab |
2.98ae |
2.87bf |
8.89 |
|
BAW-1143 |
3.23a |
3.13abc |
2.97ae |
8.05 |
|
BAW-1146 |
2.85bg |
2.76dh |
2.54gj |
10.88 |
|
BAW-1147 |
2.82cg |
2.73eh |
2.55gj |
11.35 |
|
BAW-1148 |
2.83cg |
2.70eh |
2.50hj |
12.50 |
|
Pavon-76 |
2.60fi |
2.40ij |
2.27j |
12.69 |
|
CV (%) |
5.71 |
|||
Mean followed by same letter(s) did not differ significantly at 5% level of significance
Table 10: Number of grains per spikelet of eight wheat genotypes under normal, late and very late growing conditions in
2012-13
|
Genotypes |
No. of grains per spikelet |
Reduction(%) at very late growing condition compared to normal |
||
|
Normal growing condition |
Late growing condition |
Very late growing condition |
||
|
Prodip |
3.08ab |
2.96ab |
2.77ab |
10.06 |
|
BARIGom-25 |
3.13ab |
2.98ab |
2.84ab |
9.27 |
|
BARIGom-26 |
3.16ab |
3.00ab |
2.89ab |
8.54 |
|
BAW-1143 |
3.30a |
3.16ab |
2.98ab |
9.70 |
|
BAW-1146 |
2.90ab |
2.80ab |
2.57ab |
12.59 |
|
BAW-1147 |
2.94ab |
2.78ab |
2.56ab |
11.72 |
|
BAW-1148 |
2.89ab |
2.73ab |
2.54ab |
12.11 |
|
Pavon-76 |
2.63ab |
2.44ab |
2.29b |
12.93 |
|
CV (%) |
6.77 |
|||
Mean followed by same letter(s) did not differ significantly at 5% level of significance
Table 11: Floret sterility (%) percentages of eight wheat genotypes under normal, late and very late growing conditions in 2011-12
|
Genotypes |
Floret sterility (%) |
Differences of sterility (%) |
||
|
Normal growing condition |
Late growing condition |
Very late growing condition |
||
|
Prodip |
34.85 fi |
35.65hj |
37.74bc |
+3.00 |
|
BARI Gom-25 |
36.20ij |
37.60gi |
40.38cd |
+3.31 |
|
BARI Gom-26 |
35.49ij |
36.73 fi |
42.94 de |
+2.65 |
|
BAW-1143 |
33.84l |
34.62k |
36.32jk |
+2.48 |
|
BAW-1146 |
38.51eh |
39.35de |
40.67b |
+3.17 |
|
BAW-1147 |
36.39jk |
39.50de |
39.58de |
+3.19 |
|
BAW-1148 |
35.62k |
38.91eg |
39.16df |
+3.57 |
|
Pavon-76 |
41.05bc |
41.34bc |
45.43a |
+4.38 |
|
CV (%) |
3.74 |
|||
Mean followed by same letter(s) did not differ significantly at 5% level of significance
Table 12: Floret sterility (%) percentages of eight wheat genotypes under normal, late and very late growing conditions in 2012-13
|
Genotypes |
Floret sterility (%) |
Differences of sterility (%) |
||
|
Normal growing condition |
Late growing condition |
Very late growing condition |
||
|
Prodip |
35.29df |
36.08cf |
38.32be |
+3.03 |
|
BARI Gom-25 |
35.31df |
36.05cf |
37.49bf |
+2.18 |
|
BARI Gom-26 |
35.11df |
36.44cf |
36.75cf |
+1.64 |
|
BAW-1143 |
32.59f |
33.89f |
35.07ef |
+2.48 |
|
BAW-1146 |
37.76bf |
35.10ef |
41.50ab |
+3.74 |
|
BAW-1147 |
34.03ef |
34.85ef |
41.33ab |
+7.30 |
|
BAW-1148 |
35.68df |
35.20df |
42.08ab |
+6.40 |
|
Pavon-76 |
36.93bf |
34.72ef |
44.73a |
+7.80 |
|
CV (%) |
6.55 |
|||
Mean followed by same letter(s) did not differ significantly at 5% level of significance
Table 13: Seed size of eight wheat genotypes under normal, late and very late growing conditions in 2011-12
|
Genotypes |
Seed size(mg/grain) |
Reduction(%) at very late growing condition compared to normal |
||
|
Normal growing condition |
Late growing condition |
Very late growing condition |
||
|
Prodip |
48.00d |
43.55n |
37.25r |
22.40 |
|
BARI Gom-25 |
48.25c |
43.60ij |
37.56h |
22.16 |
|
BARI Gom-26 |
48.60b |
43.70ij |
38.15p |
21.50 |
|
BAW-1143 |
49.90a |
44.30h |
40.00o |
19.84 |
|
BAW-1146 |
47.50e |
43.40j |
36.25s |
23.68 |
|
BAW-1147 |
46.80f |
42.40k |
35.40t |
24.36 |
|
BAW-1148 |
46.50g |
41.80l |
35.00u |
24.73 |
|
Pavon-76 |
41.40m |
38.50p |
30.20t |
27.05 |
|
CV (%) |
1.35 |
|||
Mean followed by same letter(s) did not differ significantly at 5% level of significance
Table 14: Seed size of eight wheat genotypes under normal, late and very late growing conditions in 2012-13
|
Genotypes |
Seed size(mg/grain) |
Reduction(%) at very late growing condition compared to normal |
||
|
Normal growing condition |
Late growing condition |
Very late growing condition |
||
|
Prodip |
48.15ab |
43.57ad |
37.29be |
22.55 |
|
BARI Gom-25 |
48.30ab |
43.62ad |
37.58be |
22.19 |
|
BARI Gom-26 |
48.62ab |
43.73ad |
38.17be |
21.49 |
|
BAW-1143 |
49.95a |
44.32ad |
40.10be |
19.72 |
|
BAW-1146 |
47.56abc |
43.47ad |
36.35ce |
23.57 |
|
BAW-1147 |
46.82ad |
42.45ae |
35.47de |
24.24 |
|
BAW-1148 |
46.52ad |
41.86ae |
35.05de |
24.66 |
|
Pavon-76 |
41.42ae |
38.53ae |
30.24e |
26.99 |
|
CV (%) |
9.29 |
|||
Mean followed by same letter(s) did not differ significantly at 5% level of significance
Table 15: Grain yield of eight wheat genotypes under normal, late and very late growing conditions in 2011-12
|
Genotypes |
Grain yield (t/ha) |
Reduction (%) at very late growing condition compared to normal |
Heat susceptibility index (S) |
||
|
Normal growing condition |
Late growing condition |
Very late growing condition |
|||
|
Prodip |
4.14abcd |
3.52fh |
2.03j |
50.97 |
1.01 |
|
BARI Gom-25 |
4.23abc |
3.68eg |
2.13j |
49.65 |
0.98 |
|
BARI Gom-26 |
4.32ab |
3.71eg |
2.21j |
48.84 |
0.97 |
|
BAW-1143 |
4.50a |
3.82df |
2.61i |
42.00 |
0.81 |
|
BAW-1146 |
4.05be |
3.50fh |
1.95j |
51.85 |
1.02 |
|
BAW-1147 |
3.96be |
3.41gh |
1.91j |
51.77 |
1.02 |
|
BAW-1148 |
3.87cf |
3.36gh |
1.85j |
52.20 |
1.03 |
|
Pavon-76 |
3.15h |
2.62i |
1.13k |
64.13 |
1.27 |
|
CV (%) |
6.93 |
||||
Mean followed by same letter(s) did not differ significantly at 5% level of significance
Table 16: Grain yield of eight wheat genotypes under normal, late and very late growing conditions in 2012-13
|
Genotypes |
Grain yield (t/ha) |
Reduction(%)at very late growing condition compared to normal |
Heat susceptibility index (S) |
||
|
Normal growing condition |
Late growing condition |
Very late growing condition |
|||
|
Prodip |
4.25bc |
3.55fg |
2.10kl |
50.59 |
1.00 |
|
BARI Gom-25 |
4.32bc |
3.70ef |
2.25jk |
47.92 |
0.95 |
|
BARI Gom-26 |
4.38b |
3.75e |
2.31j |
47.26 |
0.94 |
|
BAW-1143 |
4.80a |
3.87de |
2.75i |
42.71 |
0.85 |
|
BAW-1146 |
4.25bc |
3.52g |
2.10kl |
50.59 |
1.00 |
|
BAW-1147 |
4.15c |
3.43g |
1.95lm |
53.01 |
1.05 |
|
BAW-1148 |
3.95d |
3.38gh |
1.87m |
52.66 |
1.04 |
|
Pavon-76 |
3.25h |
2.65i |
1.16n |
64.31 |
1.27 |
|
CV (%) |
3.05 |
||||
Mean followed by same letter(s) did not differ significantly at 5% level of significance
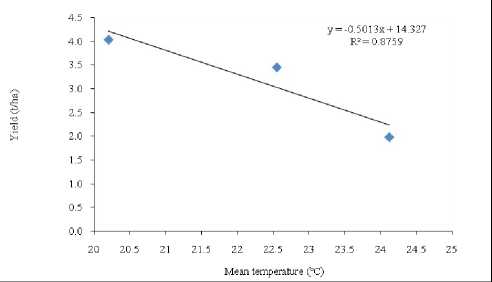
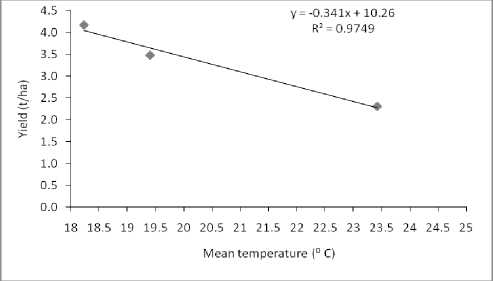
Figure 1. Effect of mean temperature on grain yield (left graph for 2011-12 and right for 2012-13.
Table 17: Biological yield of eight wheat genotypes under normal, late and very late growing conditions in 2011-12
|
Genotypes |
Biological yield (t/ha) |
Reduction(%) at very late growing condition compared to normal |
||
|
Normal growing condition |
Late growing condition |
Very late growing condition |
||
|
Prodip |
12.90bd |
10.01fg |
7.40h |
42.63 |
|
BARI Gom-25 |
12.17ce |
10.15fg |
6.76hi |
44.45 |
|
BARI Gom-26 |
12.23cd |
10.76ef |
6.88hi |
43.74 |
|
BAW-1143 |
11.21cf |
9.56h |
7.31h |
34.52 |
|
BAW-1146 |
14.24ab |
12.76ac |
7.76h |
45.50 |
|
BAW-1147 |
14.27ab |
12.65ad |
7.91h |
44.56 |
|
BAW-1148 |
14.50a |
11.80gh |
7.96h |
45.10 |
|
Pavon-76 |
10.88df |
8.15h |
5.03j |
56.36 |
|
CV (%) |
9.12 |
|||
Mean followed by same letter(s) did not differ significantly at 5% level of significance
Table 18: Biological yield of eight wheat genotypes under normal, late and very late growing conditions in 2012-13
|
Genotypes |
Biological yield(t/ha) |
Reduction(%) at very late growing condition compared to normal |
||
|
Normal growing condition |
Late growing condition |
Very late growing condition |
||
|
Prodip |
13.12b |
11.82de |
7.34gh |
44.05 |
|
BARI Gom-25 |
12.30cd |
11.76de |
7.06h |
42.60 |
|
BARI Gom-26 |
12.26cd |
11.65de |
7.10h |
42.09 |
|
BAW-1143 |
11.35e |
10.52f |
7.52gh |
33.74 |
|
BAW-1146 |
14.22a |
11.75de |
7.86g |
44.73 |
|
BAW-1147 |
14.51a |
12.25cd |
8.05g |
44.52 |
|
BAW-1148 |
14.65a |
12.75bc |
8.00g |
45.39 |
|
Pavon-76 |
12.15cd |
9.95f |
5.15i |
57.61 |
|
CV (%) |
3.85 |
|||
Mean followed by same letter(s) did not differ significantly at 5% level of significance
Table 19: Harvest index (%) of eight wheat genotypes under normal, late and very late growing conditions in 2011-12
|
Genotypes |
Harvest index (%) |
Relative change to normal (%) |
||
|
Normal growing condition |
Late growing condition |
Very late growing condition |
||
|
Prodip |
32.09e |
29.30de |
28.23de |
-12.06 |
|
BARI Gom-25 |
34.75b |
33.65c |
31.56c |
-9.15 |
|
BARI Gom-26 |
35.32b |
34.47b |
32.03c |
-9.31 |
|
BAW-1143 |
40.13a |
37.26b |
36.15b |
-7.41 |
|
BAW-1146 |
28.43de |
27.41de |
25.17fg |
-11.47 |
|
BAW-1147 |
27.74de |
26.96df |
24.12g |
-13.05 |
|
BAW-1148 |
26.67ef |
24.35g |
23.16g |
-13.16 |
|
Pavon-76 |
28.96d |
25.81fg |
22.47fg |
-14.19 |
|
CV (%) |
3.80 |
|||
Mean followed by same letter(s) did not differ significantly at 5% level of significance
Table 20: Harvest index (%) of eight wheat genotypes under normal, late and very late growing conditions in 2012-13
|
Genotypes |
Harvest index (%) |
Relative change to normal (%) |
Differences of harvest index (%) |
||
|
Normal growing condition |
Late growing condition |
Very late growing condition |
|||
|
Prodip |
32.39cde |
30.03ef |
28.61eg |
-11.67 |
-3.78 |
|
BARI Gom-25 |
35.12bd |
31.46de |
31.87de |
-9.25 |
-3.25 |
|
BARI Gom-26 |
35.73bd |
32.19ce |
32.54be |
-8.93 |
-3.19 |
|
BAW-1143 |
42.29a |
36.79b |
36.57bc |
-13.53 |
-5.72 |
|
BAW-1146 |
29.89ef |
29.96ef |
26.72fh |
-10.61 |
-3.17 |
|
BAW-1147 |
28.60eg |
28.00eg |
24.82gh |
-13.22 |
-3.78 |
|
BAW-1148 |
26.96fh |
26.51fh |
23.40h |
-13.20 |
-3.56 |
|
Pavon-76 |
29.15ef |
26.63fh |
22.52h |
-22.74 |
-6.63 |
|
CV (%) |
7.78 |
||||
Mean followed by same letter(s) did not differ significantly at 5% level of significance
Harvest index has been reported as a key parameter for crop yield predictions since it determines the physiological efficiency of the crop to mobilize photosynthates and transport it to organs of economic value (Mushtaq et al. 2011). It is influenced by genotypic and environmental conditions. In the present study, lower HI at late sowing condition was due to lower grain yield and biological yield at the late sowing condition. These results are similar with the findings of Bahar et al. 2011. These results provide a suggestion that harvest index could be used as an indirect selection criterion for wheat genotype under heat stress environments.
Heat susceptibility index (HSI)
HSI calculated separately on the basis of grain yield in different stress environments to assess their stress potential. In this study, the HSI of Prodip, BAW-1146, BAW-1147, BAW-1148 and Pavon-76 were higher than 1.0, indicating that these genotypes were susceptible to heat stress (Tables 15 and 16). The HSI values of the remaining three wheat genotypes indicate their various levels of tolerance to high temperature.
From heat susceptibility index based on grain yield it was found that BAW-1143, BARI Gom-26, BARI Gom-25 and Prodip had lower heat susceptibility (S<1.0) than Pavon-76, BAW-1146 and BAW-1147 (S>1.0) and it was regarded that BAW-1143, BARI Gom-26, BARI Gom-25 and Prodip were comparatively heat tolerant than BAW-1146, BAW-1147, BAW-1148 and Pavon-76.
Among them BARI Gom-25 (HSI =0.98 for first year and HSI = 0.95 for second year), BARI Gom-26 (HSI =0.97 for first year and HSI =0.94 for second year) and BAW-1143 (HSI = 0.81 for first year and HIS = 0.85 for second year) were tolerant to heat stress.
The importance of HSI in agriculture has been designated by several researchers. It sometimes represents a measure of genotypic yield potential under heat stress (Bruckner and Frohberg, 1987). Hossain and Teixeira de Silva (2012) and Hossain et al (2012b) stated HSI to be a measure of yield stability. Therefore, a stress-tolerant genotype as defined by HSI needs not necessarily to have a high yield potential. The ideal wheat genotype should be high yielding under any environmental conditions.
CONCLUSION
Spike length, spike/plant, grain/spike, floret/spike, individual seed size, grain yield, biological yield, harvest index were found higher than late and very late growing condition. HT genotypes showed higher value than MHT and HS genotype in both the year. Floret sterility was increased at late and very late growing conditions, but heat tolerant genotype exhibits lower value.HSI calculated in stress environments to assess their stress potential on the basis of grain yield. In this study, the HSI values of Prodip, BAW-1146, BAW-1147, BAW-1148 and Pavon-76 were higher than 1.0, indicating that these genotypes were susceptible to heat stress. The HSI values of the remaining three wheat genotypes indicate their various levels of tolerance to high temperature. Among them BARI Gom-25, BARI Gom-26 and BAW-1143 were tolerant to heat stress.
CONFLICTS OF INTEREST
The authors declare that they have no potential conflicts of interest.
References Yield contributing characters of wheat under normal and heat stress conditions
- Al-Otayk S. M. (2010). Performance of yield and stability of wheat genotypes under high stress environments of the central region of Saudi Arabia. JKAU: Met., Env. Arid Land Agric. Sci. 21 (1), 81-92.
- Bahar B., M. Yildrin, C. Yuccl. (2011). Heat and drought resistance criteria in spring bread wheat (Triticum aestivum L.) Morpho-physiological parameters for heat tolerance. Scientific Research and Essays. 1(6): 2212-2220.
- Bhatta M. R., J. E. Hernendez and J. S. Lates. (1994). Possibilitiesof selecting wheat with fast grain filling rate for warmer areas . In: Wheat in heat stress environments; irrigated, dry areas and rice-wheat farming system, D. A. Saunders and G. P. Hattel (Eds), CIMMYT, Mexico, D. F. pp. 375-378.
- Blue E. N., S. C. Mason and D. H. Sandar. (1990). Influencing of planting date, seed rate and phosphorus on wheat yield. Agron. J. 82(4): 762768.
- Blum A., B. Sinmena, J. Mayer, G. Golan and L. Shpilar. (1994). Stem reserve mobilization supports wheat grain filling under heat stress. Aust. J. Plant Physiol. 13: 771-781.
- Bruckner P.L., and R.C. Frohberg. (1987). Stress tolerance and adaptation in spring wheat. Crop Sci. 27: 31-36.
- Djanaguiraman M., P. V. V. Prassad, M. Murugan, M. Perumaland, U. K. Reddy. (2014). Physiological differences among sorghum (Sorghum bicolor L. Moench) genotypes under high temperature stress. Envirn Exp. Bot. 100: 43-54.
- Donald C.M. and J. Hamblin. (1976).The biological yield and harvest index of cereals as agronomic and plant breeding criteria. Adv. Agron. 28, 361-405.
- Duncan D. B. (1955). Multiple range and multiple F-tests. Biometrics.11 (1). pp 1-42.
- Fischer, R. A. and R. Maurer. (1978). Drought resistance in spring wheat (Triticum aestivum L.) cultivars. I. Grain yield response. Aust. J. Agric. Res. 29:897-912.
- Gibson L. R. and G. M. Paulson. (1999).Yield components of wheat grown under high temperature stress during reproductive growth. Crop Sci. 39: 1841-1846.
- Grigorova, B., Vaseva, I., Demirevska, K. and Feller, U., (2011). Combined drought and heat stress in wheat: changes in some heat shock proteins. Biologia Plantarum, 55(1), 105-111.
- Hakim M. A., A. Hossain, J. A. T. Silva, V. P. Zvolinsky and M. M. Khan. (2012). Yield, Protein and Starch content of twenty wheat (Triticum aestivum L.) genotypes Exposed to high temperature under late sowing conditions. J. Sci. Res. 4 (2): 477-489.
- Hasan M. A., J. U. Ahmed, M. M. Bahadur, M. M. Hoque and S. Sikder. (2007). Effect of late planting heat stress on membrane thermostability, proline content and heat susceptibility index of different wheat cultivars. J. Natn. Sci. Found. Sri Lanka 35(2): 109-117.
- Hess M. An M Hesse. (1994). Ultrastructural observations on anther tapetum development of reeze-fixed Ledeburia soialis R (Hycinthaceae). Planta. 192, 42-430.
- Hossain A., M. A. Z. Sarker, M. Saifuzzaman, M. M. Akhter, and M. S. N. Mandal. (2009). Effect of sowing dates on yield of Wheat varieties and lines developed since 1998. Bangladesh J. Prog. Sci. Tech. 7, 5-8.
- Hossain A., M. A. Z, Sarker, M.A. Hakim, M.V. Lozovskaya, and V.P. Zvolinsky. (2011). Effect of temperature on yield and some agronomic characters of spring wheat (Triticum aestivum L.) genotypes. Int. J. Agril. Res. Innov. & Tech. 1 (1&2): 44-54.
- Hossain A. And J. A. Teixeira da Silva. (2012). Phenology, growth and yield of three wheat (Triticum aestivum L.) varieties as affected by high temperature stress. Not. Sci. Biol. 4(3): 97-106.
- Hossain A., Lozovskaya M. V. , and Zvolinsky V.P. and Teixeira da Silva J.A.. (2012a) Effect of soil and climatic conditions on yield-related components performance of spring wheat (Triticum aestivum L) varieties in the northern Bangladesh. Natural Sci. J. Fund. Appl. Res. 2 (39): 77-86.
- Hossain A., Lozovskaya M. V., and Zvolinsky V.P. and Teixeira da Silva J.A. (2012b). Effect of soil and climatic conditions on phenology of spring wheat (Triticum aestivum L) varieties in the northern Bangladesh .Natural Sci. J. Fund. Appl. Res. 2 (39): 86-97.
- Hossain A., Teixeira da Silva J. A., Lozovskaya M. V., and Zvolinsky V.P.. (2012c). The effect of high temperature stress on the phenology, growth and yield of five wheat (Triticum aestivum L.) genotypes. Asian Australian J. Plant sci. Biotechno. 6(1): 14-23.
- Hossain A., Teixeira da Silva J. A., Lozovskaya M. V., Zvolinsky V. P., and Mukhortov V.I.. (2012d). High temperature combined with drought affect rainfed spring wheat and barley in south-eastern Russia; Yield, relative performance and heat susceptibility index. J. Plant Breed. Crop Sci. 4(11): 184-196.
- Hu Z. H. and S. Rajaram. (1994). Differential responses of bread wheat characters to high temperature. Euphytica. 72:197-203.
- Hura, T. (2020). Wheat and barley: acclimatization to abiotic and biotic stress. International Journal of Molecular Sciences, 21(19), 7423.
- Kumar R., S. Madan and M.Yunus. (1994). Effect of planting date on yield and quality of duram wheat varieties. Res. J. Haryana Agric. Univ. 24: 186-188.
- Matuz, J. and Aziz, J. S. (1991). The effect of sowing season on Iraqi and Hungarian wheat varieties. Cereal Res. Commun. 18: 41-43.
- Mishra B. (2007). Challenges and preparendness for increasing wheat production in India. J. Wheat Res. 1 (1&2): 1-12.
- Mohammad F., I. Ahmed, N. U. Khan, K. Maqbool, A. Naz, S. Shaheen and K. Ali. (2011). Comparative study of morphological traits in wheat and triticale. Pakistan J. Bot. 43: 1303-1310.
- Mohammadi V., M. R. Ghannadha, A. A. zail and B. Yazdi-Samadi. (2004). Effect of post anthesis stress on head traits of wheat. Int. J. Agric.Biol. 6: 42-44.
- Mushtaq T., S. Hussain, M. A. Bukhsh, J. Iqbal and T. Khaliq. (2011). Evaluation of two wheat genotypes performance of wheat under drought conditions at different Growth stages. Crop and Environ. 2(2): 20-27.
- Nahar N., K. U, Ahmed and M. Fujita. (2010). Phenological variation and its relation with yield in several wheat (Triticum aestivum L.) cultivars under normal and late sown mediated heat stress condition. Not. Sci. Biol. 2 (3): 51-56.
- Reynolds M. P., M. Balota, M. I. B. Delgado, I. Amani and R. A. Fischer. (1994). Physiological and morphological traits associated with spring wheat yield under hot, irrigated conditions. Aust. J. Plant Physiol. 21: 717-730.
- Russell, O. F. (1994). MSTAT-C v. 2.1 (a computer based data analysis software). Crop and Soil Science Department, Michigan State University, USA.
- Saini H. S. and D. Aspiral. (1982). Abnormal sporogenesis in wheat induced by short period of high temperature. Ann. Bot. 49: 835- 846.
- Shanahan, J. F., Edwards, I. B., Quick, J. S., & Fenwick, J. R. (1990). Membrane thermostability and heat tolerance of spring wheat. Crop Science, 30(2), 247-251.
- Shpilar L and A. Blum. (1991). Heat tolerance for yield and its components in different wheat cultivars. Euphytica. 51: 257-263.
- Sikder S. and N. K. Paul. (2010). Evaluation of heat tolerance of wheat cultivars through physiological approaches. Thai J. Agric. Sci. 43(4): 251-258.
- Sikder S. (2011). Physiological basis of heat tolerance in wheat. LAP LAMBERT Acad. Pub. Germany 1-269 pp.
- Singh R. K. and B. D. Chaudhury. (1985). Biometrical methods in quantitative genetic analysis (Revised Ed.). Kalyani publisher, Ludhiana, India. 5-6 pp.
- Singh, P.K., S. Prasad, A.K. Verma, B. Lal, R. Singh, S.P. Singh and D.K. Dwivedi. (2020). Screening for heat tolerant traits in wheat (T. aestivum L.) genotypes by physio-biochemical markers. Int. J. Curr. Microbiol. Appl. Sci., 9(2): 2335-2343.
- Spink J H, Semere T, Sparkes D L, Whaley J M, Foulkes M J, Clare R W, Scott R K. (2000). Effect of sowing date on the optimum plant density of winter wheat. Annals of Applied Sylvester-Bradley R, Scott R K, Clare R W. 1997. The Wheat Growth Guide. London: Home Grown Cereals Authority. 31 pp.
- Tahir, I. Q. R. A., Khan, N. U., Gul, S., Ahmed, S., Andleeb, Y., Habib, A.....& Hussain, I. (2022). Late planting induced heat stress tolerance in wheat. Pak. J. Bot, 54(3), 795-808.
- Tashiro T. and I. F. Wardlaw. (1989). A comparison of the effect of high temperature on grain development in wheat and rice. Ann. Bot. 64: 5965.
- Wahid A., S. Gelan, M. Ashraf and M. R. Foolad. (2007). Heat tolerance in plants; an overview. Environ. Exp. Bot. 61: 199-223.
- Wardlaw I. F. I. A. Dawson and P. Munibi. (1989). The tolerance of wheat to high temperatures during reproductive growth. II. Grain development Aust. J. Agric. Res. 40: 15-24.
- Zhong-hu H. and S. Rajaram. (1994). Differential responses of bread wheat characters to high temperature, Euphytica. 72: 197-203.
