A Comparative Analysis of Extended Low Energy Adaptive Clustering Hierarchy (X-Leach) Routing Protocol
 Routing Protocol")
Author: Peter Maina Mwangi
Journal: International Journal of Wireless and Microwave Technologies @ijwmt
Article in issue: 2 Vol.15, 2025.
Free access
Wireless sensor networks (WSNs) are critical in a wide range of applications, including environmental monitoring, industrial automation, and other areas. However, their effectiveness is frequently restricted due to sensor nodes' low energy resources. The Low-Energy Adaptive Clustering Hierarchy (LEACH) protocol is commonly used to improve energy efficiency in WSNs. Despite its benefits, LEACH has substantial downsides, such as uneven energy distribution and poor cluster head selection, which results in a shorter network lifetime. To address these limitations, we presented the Extended Low Energy Adaptive Clustering Hierarchy (X-LEACH) protocol, which includes enhanced cluster head selection methods and balanced energy utilization. This paper presents a comparative analysis of X-LEACH performance using extensive simulation experiments. The primary aim of this study is to carry a comparative analysis to evaluate X-LEACH's performance across various network scenarios, including sparsely and densely populated nodes, increased number of rounds, and increasing the initial energy of nodes. Critical performance metrics such as the number of dead nodes per round, number of live nodes per round, total remaining energy per round, packet delivery ratio per round throughput per round, and the number of cluster heads formed per round were used. The study analysed the performance of X-LEACH with the traditional LEACH and SEP as the benchmark protocols protocol. Simulation results indicate that X-LEACH significantly improves energy efficiency and network lifespan compared to LEACH and SEP protocols in all the scenarios.
ADTEEN, Base Station (BS), BCDCP, HEED, LEACH, NHRP, MATLAB, PEGASIS, SEP, SHPER, TEEN, X-LEACH, VGA, WSN
Short address: https://sciup.org/15019839
IDR: 15019839 | DOI: 10.5815/ijwmt.2025.02.02
Text of the scientific article A Comparative Analysis of Extended Low Energy Adaptive Clustering Hierarchy (X-Leach) Routing Protocol
Wireless Sensor Networks (WSNs) have become a crucial technology in various sectors, including environmental monitoring, healthcare, smart cities, and industrial automation. These networks consist of multiple sensor nodes that collect data and transmit it wirelessly to a base station, commonly referred to as a sink. Due to the limited energy capacity of the sensor nodes, it is essential to implement routing protocols that extend the network's lifespan and ensure effective data transmission. [1].
Low-Energy Adaptive Clustering Hierarchy (LEACH) is an innovative hierarchical routing technique aimed at enhancing energy efficiency in Wireless Sensor Networks (WSNs). In LEACH, nodes are organized into clusters, with each cluster selecting a leader responsible for collecting and transmitting data to the base station. Although LEACH significantly reduces energy consumption compared to flat routing protocols, it has some drawbacks, including uneven energy distribution among nodes and suboptimal selection of cluster heads, which can ultimately lead to a shorter lifespan for the network. [1, 2]. XLEACH extends LEACH’s capabilities, while SEP introduces improvements tailored for heterogeneous WSNs, where nodes have different energy levels.
While LEACH, SEP, and XLEACH offer improvements in energy efficiency and network longevity, a comprehensive analysis of their comparative strengths, limitations, and performance trade-offs under varying network conditions is lacking. Understanding how these protocols behave in homogeneous versus heterogeneous networks, their impact on energy consumption patterns, scalability, and network stability is critical for optimizing routing solutions in WSNs.
A comparative analysis of these protocols will offer insights into their strengths, limitations, and best-suited application scenarios, particularly focusing on energy consumption patterns, data aggregation efficiency, and adaptability to heterogeneous and homogenous network setups.
The paper aimed to carry out a comparative analysis to evaluate and compare the effectiveness of the Extended Low Energy Adaptive Clustering Hierarchy (X-LEACH), LEACH (Low-Energy Adaptive Clustering Hierarchy), and SEP (Stable Election Protocol) routing protocol in Wireless Sensor Networks (WSNs). This Study seeks to analyze the energy consumption patterns of each protocol to determine their effectiveness in prolonging the network's operational lifetime.
To achieve the study objective the researcher used several performance metrics, which included: the number of cluster heads generated in each round, the number of live nodes, the number of dead nodes, the total remaining energy of the network, the number of packets sent to cluster heads, the number of packets sent to the base station, and overall throughput.
The study carried out simulation experiments using MAT LAB simulator tool. In the study a total of four simulation scenarios were conducted, each consisting of six individual experiments, with varying simulation parameters. Following the experiments, a detailed description of how the simulation output was traced, analyzed, and plotted was provided. The performance of the X-LEACH protocol was compared against the LEACH and SEP protocols, which were used as benchmark techniques. Finally, a comprehensive discussion of the simulation results was presented.
This study offers a comparative analysis of XLEACH, LEACH, and SEP, providing insights into their strengths and limitations in WSN environments. The findings aim to guide researchers and practitioners in selecting the most suitable protocol for specific applications and inspire further protocol development to overcome existing challenges in energy efficiency and network performance.
The remainder of this study is organized as follows: Section 2 reviews related works, Section 3 describes methodology, Section 4 presents results, Section 5 offers a discussion, and Section 6 concludes with future work.
2. Related Works
In this section provides, a review of existing routing protocols in WSNs and comprehensive evaluation of recent comparative studies on energy-efficient routing strategies and in wireless sensor networks.
Younis and Fahmy [3] proposed a "Hybrid Energy-Efficient Distributed Clustering (HEED)" approach aimed at improving network longevity and facilitating rapid growth in homogeneous Wireless Sensor Networks (WSNs). This protocol uses two main criteria to determine the cluster leader: remaining energy and node density. [4]. In this approach, the selection of the cluster leader occurs regularly and is based on a combination of remaining energy and the number of neighboring nodes (node degree). To achieve power balancing, the HEED protocol enhances the original Low-Energy Adaptive Clustering Hierarchy (LEACH) technique by prioritizing remaining energy while using network topology characteristics—such as node degree and distances to neighbors—as secondary factors to resolve ties among potential cluster heads. [5]. The clustering process is divided into iterations, where nodes not covered by a cluster head have their chances of becoming one increased with each iteration. While these energy-efficient clustering techniques allow each node to determine its position within the clustered network autonomously and probabilistically, they do not guarantee an optimal selection of cluster heads.
When the HEED procedure is applied to the nodes, each sensor node randomly selects an integer between 0 and 1. If the number is less than or equal to the node's cluster head (CH) probability, the node will temporarily become a CH and transmit alert signals to its neighboring nodes. The probability of becoming a CH is calculated as follows: [6]:
’ -Г . V Residue v г о b C V го b ^
^тах
In the equation above Eresidue denotes the remaining energy of nodes, EmaxSs maximum power when the battery is full, and Cpoob indicates the basic percentage of the number of cluster leaders which is originally set to 5 %. If there exist multiple candidates for the CH post, the one with the minimum communication cost will be elected. [6].
However, the cluster way of communication is not likely to have a dominant energy efficiency in intra-cluster cases. In addition, the clusters formed in HEED are skewed. [3].
Manjeshwar and Agrawal proposed the Threshold Sensitive Energy Efficient Sensor Network (TEEN) Routing Protocol.[7]. In addition, the cluster leader conveys attributes to its members at every change of a new agreed-upon data packet as discussed in [7]. But the nodes are aware of each other. Triggering their transmitters and transmitting detected data only when some parameter in the attribute set crosses a hard threshold. The node stores the perceived value in a sensed internal variable (SV). These protocols have the advantage of delivering time-sensitive data to the user almost instantly. As a result, the characteristics are broadcasted anew at each group change time, and the user can make adjustments as needed, the technique is highly suited for timeliness-critical data sensing applications. The TEEN protocol has a flaw: [7] if the thresholds are not met, the nodes cannot interact, and the user will not receive any data from the network, even if all the nodes are operational. As a result, this method is not suitable for applications where the user requires regular information. Furthermore, a practical implementation of this strategy must ensure that the cluster is free of collisions.
Power-Efficient Gathering in Sensor Information Systems (PEGASIS) Routing Protocol is proposed. [8]. In PEGASIS data is transmitted in turns from base station to base station. The lifespan of sensor nodes has been extended using a combination of chaotic evolutionary algorithms and fuzzy logic. Three variables, namely density, energy, and centrality, were used to develop fuzzy logic. Combining three of these characteristics helps identify the most suitable nodes as cluster leader candidates, and the suggested genetic technique determines the cluster leader position. PEGASIS overcomes the overhead problem of LEACH by allowing close connection between neighbor nodes [8] The suggested approach has a flaw in that it lacks knowledge of cluster formation and energy utilization. [8]. One disadvantage of PEGASIS is the issue of redundant data transmission. This occurs because, when a node is chosen as the leader, the central station's location in relation to the nodes' power levels is not considered. [9].
According to [10] The Adaptive Threshold Sensitive Energy Efficient Sensor Network (APTEEN) Routing Protocol tries to gather routine data collection and respond to time-sensitive situations, which is an enhancement over TEEN. Once the central station generates the clusters, the group leader distributes the attributes, threshold values, and communication schedule to all nodes. The cluster leader then consolidates the data, leading to energy savings. One of the main advantages of the Adaptive Periodic Threshold-sensitive Energy Efficient Network (APTEEN) over the Threshold-sensitive Energy Efficient Network (TEEN) is that nodes consume less energy. However, its complexity and longer wait times are significant drawbacks.
The Virtual Grid Architecture (VGA) Routing Protocol described by[11], can combine aggregated data and innetwork processing to increase network durability and reduce energy use. The entire design consists of two phases: grouping and data collection and routing. Since the majority of applications require immobile sensors, sensors are grouped in a fixed topology during the clustering phase The leader, also known as a locator aggregator, is responsible for the collection of data inside each cluster. To carry out global or in-cluster data collection, a selected subset of Local Aggregators (LAs) is designated, and the members of this subset are known as Master Aggregators. During the data aggregation phase, several heuristics are proposed to provide a quick, effective, and nearly flawless response. One example of a heuristic is the formation of overlapping groups among the LA nodes, which allows the readings from a group's members to be connected. The main advantage of this protocol is its ability to enhance network resilience while conserving energy. However, the challenge lies in the fact that selecting the appropriate local aggregators as master aggregators is NP-hard.
The Scaling Hierarchical Power Efficient Routing (SHPER) Protocol [12], requires that a central station and a group of uniform sensor nodes must cohabit. The nodes are randomly distributed throughout the designated area of interest. The sensor field is situated at a distance from the central station. Both the central station and the sensor node network are intended to be permanent installations. With its unlimited power supply, the central station can communicate at a high-power level, ensuring that it can reach all network nodes effectively. [12]. The main advantage of this approach is that it facilitates cluster leadership while considering the remaining power of each node. This leads to a more balanced energy distribution and ensures that power depletion occurs more uniformly among the nodes. Furthermore, data forwarding relies on a path selection criterion that accounts for both the available energy of the nodes and the communication costs associated with multiple viable paths. However, it's important to note that this approach does not support node mobility.
The Base-Station Controlled Dynamic Clustering Protocol (BCDCP) is a routing protocol that was developed by Muruganatha et.al. [13], it can construct clusters with the assumption that they will be regularly distributed. To accomplish this, the base station gathers data about the network's current energy state from each node before building the routing path. Using this feedback, the base station determines the average energy consumption of all nodes. The central station then selects a set of nodes with higher energy levels than the average.
The Novel Hierarchical Routing Protocol (NHRP) protocol proposed by [14] can adopt the most appropriate routing technology for the nodes based on how far they are from the central station, the distribution of node density, and the remaining power [14]. A brief examination of the computational cost indicates that the proposed routing protocol is more effective at handling nodes primarily involved in looping, assessment, and assignment operations. Furthermore, each node's initialization step is executed only once during the deployment of the sensor networks. The NHRP is capable of addressing various challenges across different demand scenarios, such as security and energy concerns, by selecting an appropriate threshold value. However, a major limitation of the NHRP is that it does not guarantee that all sensor nodes will join clusters. [14].
Stable Election Protocol (SEP) [16] is a hierarchical routing strategy for heterogeneity WSNs. This protocol utilizes two energy-level nodes, termed normal and advanced, to enhance the stability of the clustering hierarchy process. The SEP (Stable Election Protocol) is a dynamic protocol, meaning that the two types of energy-normalized nodes are deployed randomly. During each cluster head election cycle, nodes self-elect as cluster leaders based on their initial energy compared to that of other nodes, which eliminates the need for global knowledge of residual energy. This approach helps extend the network's lifespan. However, a disadvantage is that cluster heads are selected solely based on their starting energy levels. [17].
Heinzelman et al proposed [18] “Low Energy Adaptive Clustering Hierarchy (LEACH) is a well-known clustering approach”. The LEACH algorithm uses a random rotation of cluster head selection to distribute energy equitably among the nodes in a WSN. [19]. According to [20] “Stable Election Protocol (SEP) improves LEACH by populating a ratio of SNs with more energy than the remaining nodes in the same network, as LEACH is achieved in standardized types of WSNs”. As a result of these enhanced nodes, the network has a diverse node energy distribution. In SEP, election probabilities are calculated by comparing a node's initial energy to that of other nodes in the network. This prolongs the time frame until the initial node dies, which is crucial for some applications that require the sensor network's output to remain consistent. [21]. Because sending gathered data is more expensive in terms of energy resources in an energy-constrained environment, this process limits the lifetime of WSNs.
From the study [22, 21] “LEACH can extend the network lifetime by 15% when compared to the general multihop routing protocol and static clustering method, and the average proportion of relay communication is accomplished by random selection”.
The LEACH technique has several key advantages, including a kind of confidential routing protocol with an exceptional degree of network, which makes cluster members' jobs easier and eliminates the need to retain complex routing information, lowering the amount of routing control information [9].
Furthermore, the LEACH protocol selects cluster heads at random and rotates them so that the increased energy usage is dispersed throughout the network, extending the network's life cycle. [28]. Finally, the LEACH protocol's scalability is arranged. However, LEACH has some limitations which include:
In LEACH, the CH (Cluster Head) selection procedure ignores the node's leftover energy (residual energy function) or location of the CH and BS (Base Station). This method of selecting CHs is ineffective because nodes that are farther from the BS and have lower residual energy are more often chosen as CHs. [1]. As a result, it chooses CH at random, disregarding remaining energy or the elected CH's hop count concerning BS. [29].
There are two shortcomings in energy utilization for cluster heads in the LEACH protocol, which represent an additional constraint. First is the hotspot problem, which occurs as a result of more cluster head tasks that raise their energy consumption. From the study “LEACH protocol proposes a well-planned rotation of the cluster head role among all nodes in a cluster, ensuring that each node serves as a cluster head exactly once during the lifespan of the WSN, but this solution does not address the issue of additional responsibilities”. LEACH aims to balance the long-term energy consumption of all nodes within each cluster. However, this protocol does not consider the increased energy used by nodes during cluster head service. [30].
Sensor nodes broadcast duplicated data to cluster leaders, which is another inefficiency. As a result, the cluster heads are overworked. Faulty node management can result in nodes consuming more energy during cluster head service, as well as providing duplicated data to cluster heads. [30].
LEACH faces the challenge of not knowing how many cluster leaders are present on the network. When a cluster leader fails, the entire cluster becomes ineffective because the data collected by the cluster nodes does not reach its intended destination. Additionally, base clusters are randomly partitioned, leading to an unequal distribution of clusters. [31].
One drawback of the LEACH protocol is that the cluster leader must receive and combine data from its cluster members before sending it to the base station (BS). This process increases energy consumption for both the cluster members and the overall network. Additionally, if the cost for the cluster head increases, the consumption rate of network nodes is affected. [32].
Furthermore, [32] LEACH protocol is well-suited for small to medium-sized wireless sensor networks, but it is not suitable for large networks. In this protocol, the original data is transferred to the cluster head and then relayed to the base station (BS) in a single hop. Therefore, the cluster members, cluster head, and base station must all be within communication range of one another.
In addition, [1] Multiple cluster heads may be placed close to one another in LEACH, which reduces the efficiency of grouping and forces the group members to send to group leaders that are located far away from them. Furthermore, the groups formed by LEACH are uneven, and the group leader is not situated in the center of the member nodes. This unevenness results in higher energy consumption during communications within the cluster, as it increases the overall transmission distance between the nodes and the cluster leader.
The selection of group leader nodes in the LEACH (Low-Energy Adaptive Clustering Hierarchy) protocol has certain flaws. One issue is that extremely large and very small groups may coexist within the network. The algorithm does not effectively account for the varying energy levels of nodes, leading to unreasonable cluster leader selections. Furthermore, the member nodes experience energy loss when a cluster head fails. The algorithm also fails to consider the positions of nodes, ignoring important factors such as residual energy and geographic location, which could impact the stability and effectiveness of the cluster head. [33].
Multiple comprehensives analysis has been conducted over the years on existing routing protocols in WSN. Some reviews include:
Sachin Lalar and Arun Kumar Yadav [26] carried out a comprehensive analysis focusing on various existing routing protocols using various performance metrics energy consumption, data aggregation, scalability, computation overhead, data delivery model, network lifetime, optimal route of the wireless sensor networks and factors that can affect the protocols in WSN. The paper highlights the design tradeoffs between energy and communication overhead savings in some of the routing but simulation experiments were missing to assess key performance metrics of routing protocols, such as energy efficiency, network lifetime, data throughput, latency, packet delivery ratio, and stability period.
Mandeep Kumar and Jahid Ali [27] did Performance Study and Comparative Analysis of Routing Protocols in Wireless Sensor Networks. Their aim was study and compare various routing protocols using Taylor SailFish Optimizer (Taylor SFO) approach. Additionally, the performance of the routing technique is analyzed with throughput, distance, energy, end to end delay as well as Packet Delivery ratio (PDR). The gap with this paper is that methodology section does not clearly explain how the evaluation and simulation were done.
3. Methodology 3.1 Initial Simulation Parameters
A simulation experiment was conducted using MATLAB R2017a to evaluate the performance of X-LEACH and compare it with other routing protocols, such as LEACH and SEP. In this experiment, a wireless sensor network consisting of 100 sensor nodes was distributed over a 100 m by 100 m field, with each node beginning with an energy level of 0.5 J. Table 3.2 summarizes the initial simulation parameters.
3.2 Simulation Scenarios
4. Results4.1 Number of Dead Nodes Per Round in All Scenarios
A total of six simulation experiments were carried out across four distinct scenarios. These scenarios were specifically selected to reflect real-world conditions in wireless sensor network environments, which often encounter energy challenges, particularly in mission-critical situations. In each scenario, we varied the sensor network deployment area, the number of nodes, the number of rounds, the energy levels of the nodes, and the packet sizes. The performance of the proposed technique was then evaluated based on these variations.
The first scenario involved a sparsely populated wireless sensor network consisting of 100 sensor nodes and one central station deployed over a 200m-by-200m area. Each node started with an energy level of 0.5 J. By increasing the deployment area from 100 m by 100 m to 200 m by 200 m, we created larger clusters of nodes, resulting in greater distances between individual sensors. This increased distance means that the communication range between the nodes and their respective cluster leaders, as well as between the cluster leaders and the base station, is considerably greater. As a consequence, more energy is required to transmit data from the nodes to the cluster heads and from the cluster heads to the base station. The sparsity of nodes in such a wireless sensor network can significantly impact energy efficiency. In sparsely populated networks, nodes often have to send data over longer distances to reach neighboring nodes or the base station. This longer transmission requires more energy, leading to increased overall energy consumption. To address these longer communication distances, energy-efficient routing protocols and strategies must be implemented to optimize routing paths and minimize energy expenditure. Additionally, nodes may need to boost their transmission power to compensate for the greater distances. However, higher transmission power levels consume more energy, which can further compromise energy efficiency. Moreover, sparsely populated networks typically offer larger sensing coverage per node. With fewer nodes deployed to cover a larger area, each node must sense a greater portion of the environment, which leads to increased energy consumption during the sensing phase.
The second scenario involved densely populated nodes, in which a wireless sensor network consisting of 200 sensor nodes and one base station was deployed in a 100m-by-100m field. Each node began with an energy of 0.5J, meaning the number of normal nodes increased from 100 to 200. This results in a higher density of nodes within each cluster. Densely populated networks can have both positive and negative effects on the energy efficiency of a wireless sensor network. One advantage of having densely populated nodes is the reduced data transmission distance between nodes, cluster heads, and the base station. This proximity leads to lower energy consumption, as data can be transmitted over shorter distances. Moreover, a higher density of nodes creates opportunities for energy harvesting techniques. With more nodes in closer proximity, it becomes more feasible to implement energy harvesting mechanisms, such as solar panels or energy scavenging devices. This arrangement allows for efficient energy replenishment and decreases reliance on battery power, ultimately improving overall energy efficiency.
The third scenario involved increasing the number of rounds. A wireless sensor network, consisting of 100 sensor nodes and one base station, was deployed in a 100m-by-100m field. Each node had an initial energy of 0.5J and was designed to operate for up to 3000 rounds. Each round in a wireless sensor network includes various activities such as data sensing, processing, communication, and coordination, all of which consume energy at different stages. As the number of rounds increases, the overall energy consumption of the network accumulates over time. It is crucial to manage energy resources effectively to prevent premature depletion and maintain energy efficiency throughout the network's operation. If energy is not managed efficiently, increasing the number of rounds could lead to a reduced network lifetime. Therefore, as the network operates over an extended period, it is important to balance energy consumption during each round to ensure that the network remains functional for the desired duration.
The fourth scenario involved increasing the initial energy of the nodes in a wireless sensor network. This network consisted of 100 sensor nodes and one base station, distributed across a 100m-by-100m field, with each node starting with 1J of energy for 2000 rounds of operation. By providing more energy, the sensor nodes can operate for longer periods without the need for recharging or battery replacements. This extended network lifetime allows the system to function continuously and collect data over a longer duration, enhancing energy efficiency by reducing the need for frequent node replacements or maintenance activities. With additional energy available, the sensor nodes can also participate in more frequent and prolonged data transmission activities. This improvement leads to better data collection, improved coverage, and increased responsiveness of the network.
The results presented below are derived from the average performance of six simulation experiments conducted for each scenario of the X-LEACH routing protocol. Additionally, the simulation data was generated, analyzed, summarized, plotted, and compared with the LEACH and SEP protocols, which were used as benchmarks.
The simulation results showed that the X-LEACH protocol had fewer dead nodes compared to the benchmark protocol. Figure 1 summarizes the number of dead nodes per round for each scenario using the X-LEACH routing protocol.
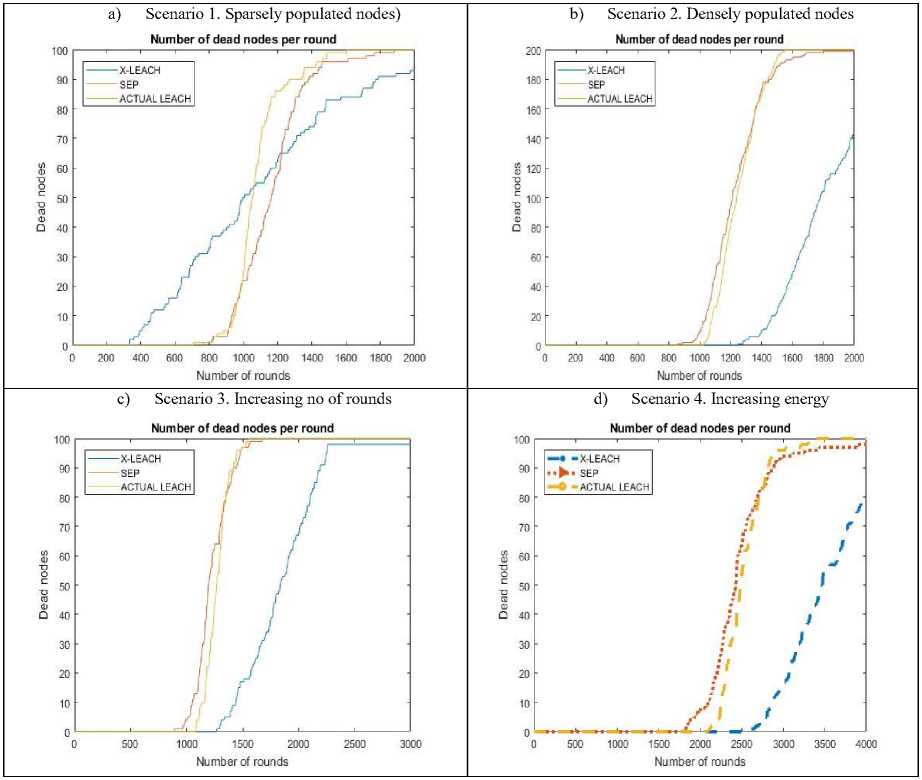
Fig. 1. Number of Dead Nodes per Round in all Scenarios
-
4.1.1 Sparsely Populated Nodes
In the first scenario, we examined a wireless sensor network consisting of 100 sensor nodes and one base station deployed in a 200m-by-200m area. Each sensor node began with an initial energy of 0.5J. By expanding the sensor deployment area from 100m by 100m to 200m by 200m, we created a situation with fewer nodes per unit area, leading to a larger cluster size and a sparsely populated environment. The number of dead nodes in this scenario for the X-LEACH, SEP, and LEACH protocols is illustrated in Figure 1(a). In this scenario, the first node died at 550 rounds for the X-LEACH protocol, at 750 rounds for SEP, and at 700 rounds for LEACH. By the 1000th round, the X-LEACH routing protocol had 50 active nodes remaining, while SEP had 25 and LEACH had only 20. At the end of the simulation, X-LEACH had 95 dead nodes, while both SEP and LEACH had 100 dead nodes each. This indicates that, at the conclusion of the simulation, while all nodes in SEP and LEACH were dead, X-LEACH retained 5 active nodes. A lower number of dead nodes correlates with an increased lifespan for the wireless sensor network. As the sensor deployment area increases, the communication distance between the nodes and the cluster head, as well as between the cluster head and the base station (sink), also increases, resulting in higher energy consumption during communication. Consequently, the number of dead nodes rose for X-LEACH, SEP, and LEACH as the deployment area expanded.
-
4.1.2 Densely Populated Nodes
-
4.1.3 Increasing Number of Rounds
In the third scenario, the researcher aimed to increase the number of rounds to evaluate the performance of the X-LEACH protocol. The maximum number of rounds executed by the X-LEACH protocol was assessed at the end of the simulation. A wireless sensor network comprising 100 sensor nodes and 1 base station was deployed in a 100m x 100m field, with each node starting with an initial energy of 0.5J and a total of 3000 rounds. The number of dead nodes after scenario 2 for X-LEACH, SEP, and LEACH is illustrated in Figure 1(c). The results indicate that, at the end of the simulation, 95 nodes using the X-LEACH protocol had died, whereas all the nodes in both the SEP and LEACH protocols had depleted their energy. This suggests that increasing the number of rounds does not have a significant impact on energy consumption in wireless sensor networks (WSNs).
-
4.1.4 Increasing the Initial Energy of Nodes
The fourth scenario involved increasing the initial energy of the nodes. In this setup, a wireless sensor network consisting of 100 sensor nodes and 1 base station was deployed in a 100m x 100m field. Each node was assigned an initial energy of 1J and was tested over 2000 rounds. The number of dead nodes at the end of the simulation for the X-LEACH, SEP, and LEACH protocols is illustrated in Figure 1(bd). The results indicate that after 2000 rounds, the X-LEACH protocol had 0 dead nodes, while SEP had 10 dead nodes, and LEACH also had 0 dead nodes. By the end of the simulation, however, the X-LEACH had approximately 80 dead nodes, SEP had 95 dead nodes, and LEACH had all its nodes dead.
However, the X-LEACH routing protocol still outperformed both SEP and LEACH by the end of the simulation.
In the second scenario, the wireless sensor network consisted of 200 sensor nodes and 1 base station distributed across a 100m-by-100m field, with each node starting with an initial energy of 0.5J. By increasing the number of normal nodes from 100 to 200, each cluster became more densely populated. The number of dead nodes in this scenario for X-LEACH, SEP, and LEACH is illustrated in Figure 1(b). In Scenario 2, it is evident that the first node in the X-LEACH routing protocol died after 1,300 rounds, while the first node in SEP died at 900 rounds, and in LEACH, it occurred at 1,050 rounds. By the end of the simulation, X-LEACH had 140 dead nodes, whereas all nodes in both SEP and LEACH were dead. This indicates that the X-LEACH protocol outperformed the benchmark protocols, SEP and LEACH, in a densely populated node scenario.
Increased energy availability allows sensor nodes to operate for longer periods without the need for recharging or battery replacement. This extended network lifetime enables continuous functioning and data collection over an extended duration, enhancing energy efficiency by decreasing the frequency of node replacements and maintenance activities. The results indicate that the X-LEACH protocol performs better than the benchmark protocols SEP and LEACH, even when energy levels are increased.
A summary of the number of dead nodes per round simulation results from the protocol is illustrated in Table 1.
Table 1. Simulation Results of the Number of Dead Nodes for all Scenarios.
|
Scenario 1 |
Scenario 2 |
Scenario 3 |
Scenario 4 |
|||||||||
|
§ g s s Ы |
5Л © 45 5» “ CO 5 a |
45 © 5 © |
45 5 © © ° о 5 5 |
© HH |
||||||||
|
5Л 45 3 5 © ей |
я |
Oh CO |
я |
я |
Oh CO |
я |
я |
Он CO |
я |
я |
Oh CO |
|
|
0 |
0 |
0 |
0 |
0 |
0 |
0 |
0 |
0 |
0 |
0 |
0 |
|
|
500 |
10 |
0 |
0 |
0 |
0 |
0 |
0 |
0 |
0 |
0 |
0 |
0 |
|
1000 |
50 |
25 |
20 |
0 |
0 |
25 |
0 |
0 |
5 |
0 |
0 |
0 |
|
1500 |
80 |
95 |
90 |
25 |
185 |
180 |
20 |
97 |
95 |
0 |
0 |
0 |
|
2000 |
90 |
100 |
100 |
140 |
200 |
200 |
70 |
100 |
100 |
0 |
0 |
5 |
|
2500 |
95 |
100 |
100 |
180 |
200 |
200 |
95 |
100 |
100 |
0 |
50 |
60 |
|
3000 |
95 |
100 |
100 |
180 |
200 |
200 |
95 |
100 |
100 |
20 |
95 |
90 |
At the end of the simulation, the number of dead nodes was recorded as follows: 95 for the X-LEACH protocol, 100 for LEACH, and SEP 100 for SEP. Additionally, at the 1000-round mark, the number of dead nodes was 50 for X-LEACH, 25 for LEACH, and 20 for SEP, as observed in scenario 1. This indicates a higher number of dead nodes at the beginning of the simulation. This increase was attributed to the expansion of the sensor network deployment area from 100m x 100m to 200m x 200m. With a larger deployment area, the cluster size becomes larger, resulting in a sparser distribution of nodes. Consequently, the distance between individual sensors increases, leading to greater transmission distances between the nodes and the cluster heads, as well as between the cluster heads and the base station. This increased distance subsequently raises the energy required for data transmission from the nodes to the cluster heads and from the cluster heads to the base station. The sparsity of nodes in a wireless sensor network can significantly impact energy efficiency. In sparsely populated networks, nodes must transmit data over longer distances to connect with neighboring nodes or the cluster head. After the simulation, X-LEACH protocol had a lower number of dead nodes compared to the other benchmark protocols, indicating that it outperformed them.
In scenarios 2, 3, and 4 our proposed X-LEACH outperformed other benchmark protocols including LEACH and SEP as shown in Figure1(a-b). This shows that based on the four scenarios X-LEACH increased the Lifespan of the wireless sensor network.
-
4.2 Number of Live Nodes Per Round in All Scenarios
The results from the simulation scenarios showed that the X-LEACH protocol had a greater number of live nodes compared to the benchmark protocol. Figure 2 summarizes the number of live nodes per round for the protocols.
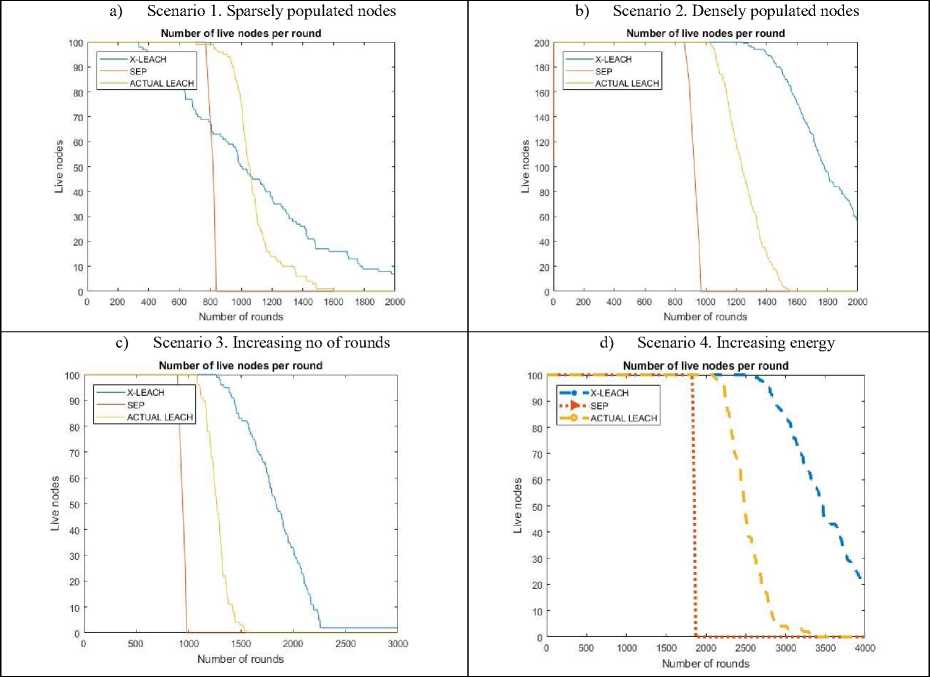
Fig. 2. Number of Live Nodes per Round in all Scenarios
In Scenario 1, where nodes were sparsely populated at the end of the simulation, the number of live nodes in the X-LEACH protocol was 5, while LEACH and SEP had 0 live nodes. At 1000 rounds, the number of live nodes in the X-LEACH protocol was 50, compared to 75 for LEACH and 70 for SEP, as shown in Figure 2(a). This indicates, that there was a higher number of dead nodes at the beginning of the simulation. This increase in dead nodes is attributed to the expansion of the sensor network deployment area from 100 m x 100 m to 200 m x 200 m. As a result, the distance between sensors and their corresponding cluster heads, as well as between cluster heads and the base station, increased. This longer distance led to greater energy consumption for data transmission from the nodes to the cluster heads and from the cluster heads to the base station. However, by the end of the simulation in Scenario 1, the X-LEACH protocol outperformed the other benchmark protocols with a greater number of active nodes. This demonstrates a decrease in energy consumption.
In scenario 2, the nodes were densely populated, with an increase from 100 to 200 nodes within the network deployment area of 100m x 100m. This increased density led to a shorter transmission distance between nodes, cluster heads, and the base station. As a result, data transmission was much faster, which reduced the energy required for transmission. By the end of the simulation, as shown in Figure 2(b), it was observed that the X-LEACH routing protocol had 60 nodes still active, while both SEP and LEACH had 0 nodes remaining. This indicates that the X-LEACH performed significantly better than SEP and LEACH, even in densely populated scenarios.
In scenario 3, the number of rounds was increased from 2,000 to 3,000 in a deployment area of 100m x 100m, while keeping all other parameters constant. Figure 2(c) illustrates that by the end of the simulation, there were 5 live nodes remaining, whereas both the SEP and LEACH protocols had no live nodes left. This demonstrates that an increase in the number of rounds does not enhance the performance of the Wireless Sensor Network. The results indicate that the protocol outperformed the benchmark protocols.
In scenario 4, the initial energy of the nodes was increased from 0.5 joules to 1 joule. At the end of the simulation, which took place over 2000 rounds, the proposed X-LEACH protocol had 100 nodes still operational, while the SEP protocol had 95 active nodes, and the LEACH protocol also had 100 active nodes, as shown in Figure 2(d). This indicates that when sensor nodes have more energy available, they can operate for longer periods without needing a recharge or battery replacement. The extended network lifetime allows for continuous data collection over a longer duration, improving energy efficiency by reducing the frequency of node replacements or maintenance activities. Thus, the X-LEACH outperformed other benchmark protocols, including LEACH and SEP, even if the number of rounds increased.
-
4.3 Total Remaining Energy in All Scenarios
The results from the simulation scenarios showed that the total remaining energy of the X-LEACH protocol was better than that of the benchmark protocol. Figure 3 provides a summary of the number of live nodes per round from the simulation results of the protocol.
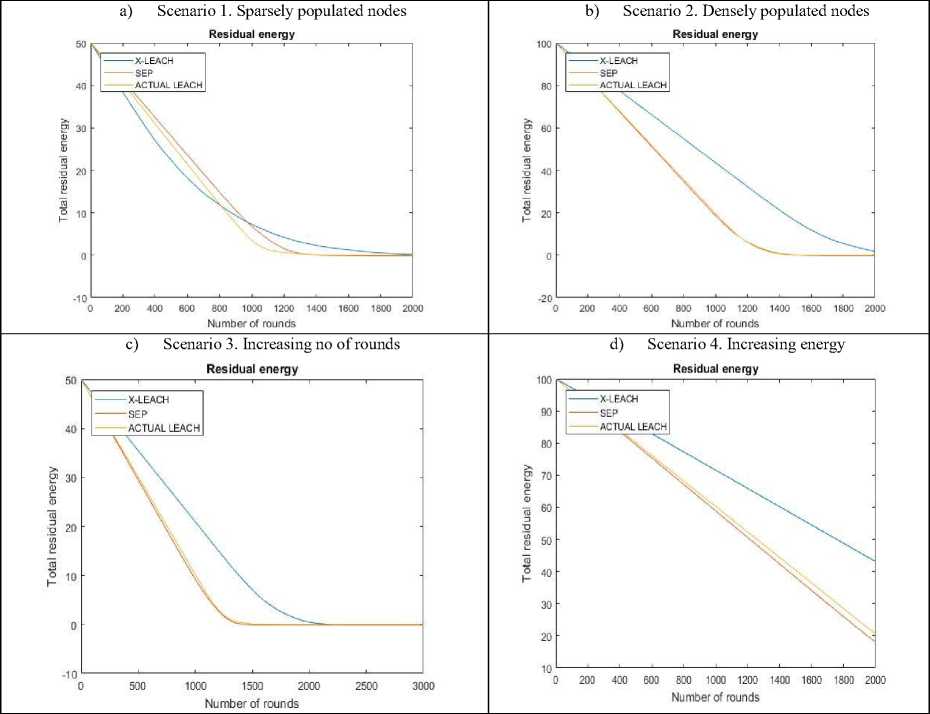
Fig. 3. Total Residual Energy per Round in all The Scenarios
In scenario 1, the nodes were sparsely populated due to an increase in the sensor network deployment area from 100 m x 100 m to 200 m x 200 m. Initially, the energy dissipation rate was higher but it gradually decreased, as illustrated in Figure 3(a). By the end of 1000 rounds, X-LEACH had approximately 10 joules of energy remaining, while SEP also had about 10 joules, and LEACH had around 6 joules left. After the simulation, X-LEACH had roughly 2 joules remaining, whereas SEP and LEACH had depleted all their energy. This difference in energy consumption is attributable to the increased distance between sensors, which led to longer transmission distances between nodes and cluster heads, and the distance between cluster heads and the base station. Consequently, at the end of the simulations, the total remaining energy in the X-LEACH protocol was higher compared to that of LEACH and SEP in scenario 1.
In scenario 2, the network was densely populated, with the number of nodes increasing from 100 to 200 within a deployment area of 100m x 100m. This resulted in a high density of nodes in each cluster, leading to a very short transmission distance between nodes and cluster heads, and the distance between cluster head and the base station. At the end of the simulation, the total remaining energy in the X-LEACH protocol was approximately 2 joules, while SEP and the LEACH protocol had completely exhausted their energy, as shown in Figure 3(b). This demonstrates that the proposed X-LEACH is superior to the other benchmark protocols.
In Scenario 3, where the number of rounds was increased from 2,000 to 3,000, the results indicated that at the end of the simulation, the X-LEACH protocol had a total remaining energy of 2 joules. In contrast, both SEP and LEACH protocols had completely exhausted their energy, as shown in Figure 3(c).
In Scenario 4, the initial energy of the nodes was increased from 0.5 joules to 1 joule. The results demonstrated that by the end of the simulations, the X-LEACH maintained a total remaining energy of 45 joules, while SEP had 18 joules and LEACH had 22 joules.
In all other four scenarios, the X-LEACH consistently outperformed the benchmark protocols, including LEACH and SEP, in terms of total remaining energy.
-
4.4 Data Packet Delivery Ratio
-
4.4.1 Number of Packets Sent to Cluster Head in All Scenarios
The packet delivery ratio (PDR) in a wireless sensor network (WSN) refers to the proportion of packets that are successfully delivered to the total number of packets sent from a source node to a destination node or base station. A high packet delivery ratio indicates a reliable and efficient network, where a significant number of packets reach their intended destinations. PDR is an essential metric for assessing the performance of wireless sensor networks, particularly in applications where reliable data delivery is crucial, such as environmental monitoring, surveillance, and healthcare systems. This metric measures the reliability and effectiveness of packet transmission within the network. It can be evaluated by examining the number of packets sent from nodes to cluster heads and from cluster heads to the base station.
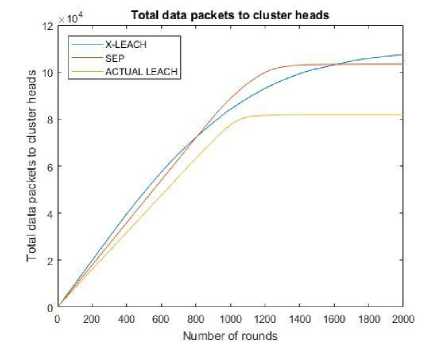
The results of the simulation scenarios revealed that the total number of packets transmitted from the node to the cluster head in the X-LEACH protocol was better than that of the benchmark protocol across all four scenarios. Figure 4 presents a summary of the number of live nodes per round from the simulation results of the protocol.
a) Scenario 1. Sparsely populated nodes)
b) Scenario 2. Densely populated nodes)
c) Scenario 3. Increasing no of rounds
d) Scenario 4. Increasing energy
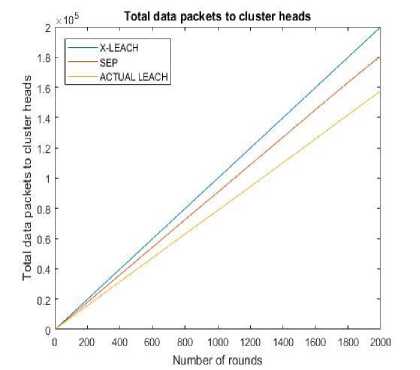
Fig. 4. Number of Packets Sent to Cluster Head in all Scenarios
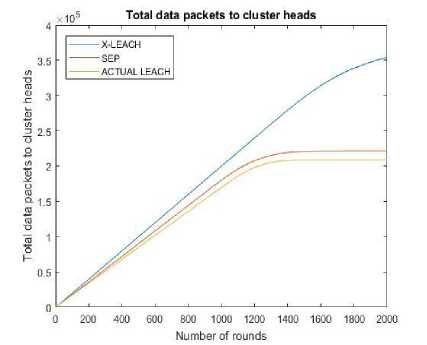
In Scenario 1, where nodes were sparsely populated, the sensor network deployment area was expanded from 100m x 100m to 200m x 200m. The total number of packets transmitted ranged from 700 to 1,400 rounds but gradually increased, as illustrated in Figure 4(a). By the end of the simulation, the X-LEACH protocol had forwarded approximately 110,000 data packets, while SEP forwarded about 105,000, and LEACH forwarded around 82,000 packets to the cluster heads. This increase in packet transmission is attributed to the greater distance between two or more sensors, which lengthens the transmission distance between the nodes and the cluster heads, as well as between the cluster heads and the base station, ultimately leading to higher energy consumption.
In scenario 2, where nodes were densely populated, the nodes increased from 100 to 200 in the network deployment area from 100M*100M. At the end of the simulation X-LEACH had forwarded approximately 3.6*105, SEP 2.25*105, and LEACH 2.1*105 data packets sent to the cluster head this is shown in Figure 4 (b). This indicated that more packets were forwarded to cluster heads when nodes were densely populated because nodes and cluster heads are close to one another. This minimizes the communication distance between nodes and cluster head thus more packets are forwarded.
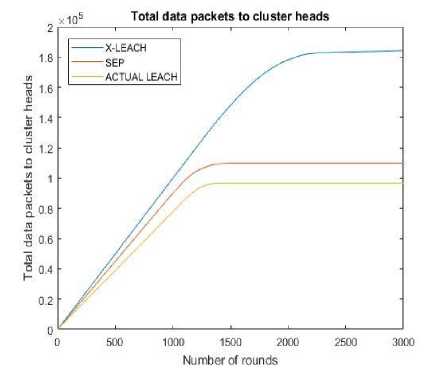
In scenario 3, the number of rounds was increased from 2000 to 3000. At the end of the simulation, X-LEACH forwarded approximately 190,000 data packets, SEP sent around 110,000 packets, and LEACH sent about 95,000 packets to the cluster head, as illustrated in Figure 4 (c). This indicates that the X-LEACH protocol facilitated the transmission of more data packets from nodes to cluster heads compared to the SEP and LEACH protocols.
In scenario 4, the initial energy of the node was increased from 0.5 joules to 1 joule. At the end of the simulation X-LEACH had forwarded approximately 2*105, SEP 1.8*105, and LEACH 1.6 * 105 data packets sent to the cluster head this is shown in Figure 4 (d).
At the end of the simulation, the total number of packets sent from nodes to cluster heads in the X-LEACH protocol was higher compared to both SEP and LEACH across all four scenarios. A high number of packets successfully reaching their designated cluster heads indicates a reliable and efficient network. This is a significant advantage of the X-LEACH protocols against SEP and LEACH.
-
4.4.2 Total number of packets sent to Sink in All Scenarios
The results from the simulation scenarios indicate the total number of packets sent from the cluster head to the sink. In all four scenarios, it is evident that SEP forwarded the fewest packets to the sink, while X-LEACH and LEACH protocols forwarded a greater number of packets. Figure 5 summarizes the total number of packets sent to the sink per round for all four scenarios.
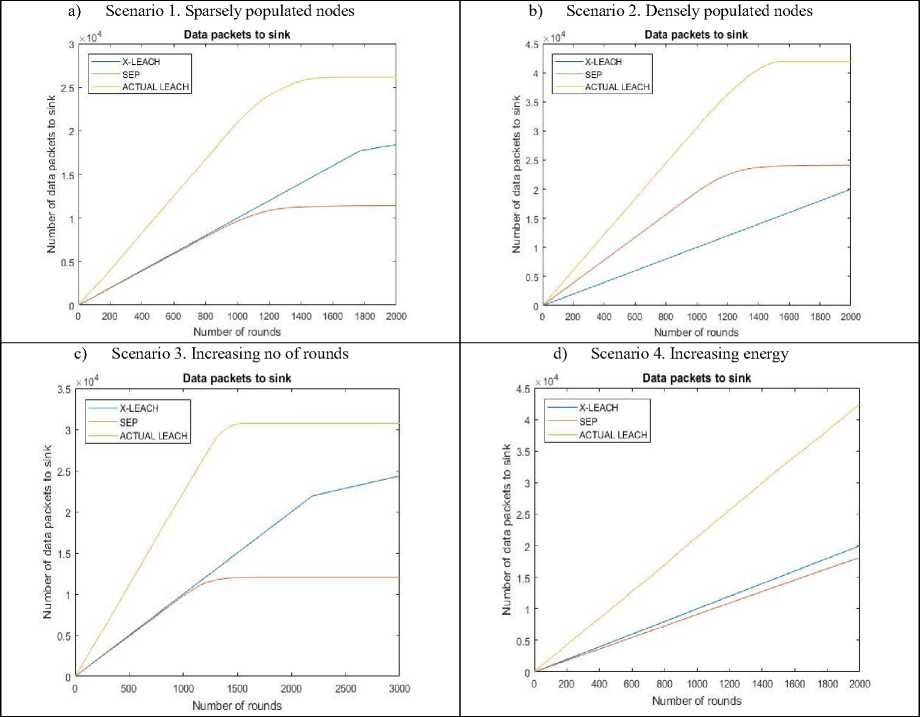
Fig. 5. Total number of packets sent to Sink in all Scenarios
In scenario 1, where the nodes were sparsely populated, the sensor network deployment area was expanded from 100m x 100m to 200m x 200m. By the end of the simulation, the X-LEACH routing protocol transmitted 18,000 packets, while SEP sent 12,000 packets, and LEACH sent 26,000 packets from the cluster head to the base station (sink), as illustrated in Figure 5(a).
In Scenario 2, the nodes were densely populated, the number of nodes increased from 100 to 200 in a network deployment area of 100m x 100m. At the end of the simulation, the X-LEACH routing protocol sent 20,000 packets from the cluster head to the base station (sink), while the SEP protocol sent 24,000 packets, and the LEACH protocol sent 42,000 packets, as shown in Figure 5(b).
In scenario 3, the number of rounds was increased from 2,000 to 3,000. At the end of the simulation, the X-LEACH routing protocol sent 24,000 packets from cluster heads to the base station (sink), while SEP sent 12,500 packets, and LEACH sent 32,000 packets, as illustrated in Figure 5(c).
In scenario 4, the initial energy of the node was increased from 0.5 joules to 1 joule. At the end of the simulation the X-LEACH routing protocol had 2*104, SEP had 1.75 *104, and LEACH 4.25 *104 number of packets sent from cluster heads to the base station (sink) as shown in Figure 5(d).
At the end of the simulation, the total number of packets sent from cluster head to sink in X-LEACH protocol was few compared to LEACH. This means by minimizing the total number of packets sent from the cluster head to the base station, the protocol reduces energy consumption, prolonging the network's overall lifetime. Also, by reducing the number of packets transmitted to the base station, the X-LEACH protocol can alleviate network congestion and improve scalability. This allows the network to accommodate a larger number of sensor nodes and handle increased data traffic efficiently.
-
4.5 Total Throughput Per Round in All the Scenarios
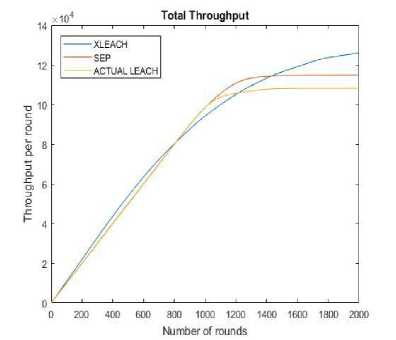
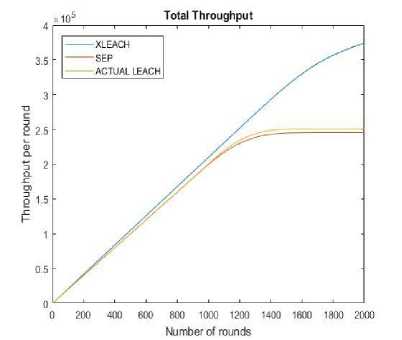
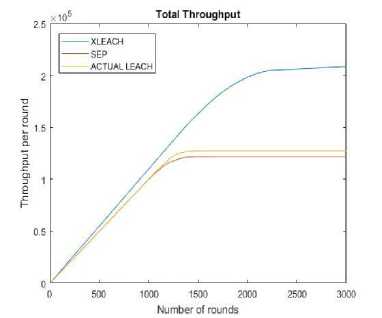
The simulation scenarios showed that the total throughput per round in the X-LEACH protocol outperformed the benchmark protocol in all four cases. Figure 6 presents a summary of the total throughput per round results of X-LEACH, SEP, and LEACH protocols.
At the end of the simulation, the total throughput per round in X-LEACH for scenario 1 was approximately 12 * 104, scenario 2 was 3.8 * 105, scenario 3 was 2 * 105, and scenario 4 was 2.2 * 105 respectively.
a) Scenario 1. Sparsely populated nodes
b) Scenario 2. Densely populated nodes
c) Scenario 3. Increasing no of rounds
d) Scenario 4. Increasing energy
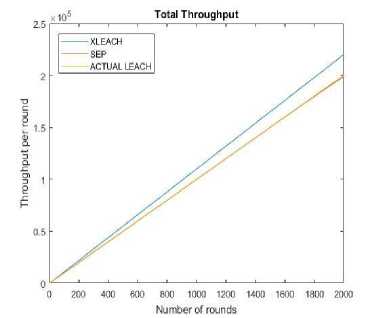
Fig. 6. Total Throughput per Round in all the Scenarios
In scenario 1 where the sensor network deployment area increased from 100M*100M to 200M*200M, the total throughput was less between 700 and 1400 rounds but gradually increased as shown in Figure 6 (a). That is because the distance between two or more sensors is much greater hence increasing the transmission distance between node and cluster heads and cluster heads and base station thus increasing energy consumption and reducing the throughput
In all other three scenarios, scenarios 2,3,4 X-LEACH outperformed benchmark protocols such as LEACH and SEP as shown in Figure 6(b, c, d). A high packet number indicates that there is a reliable and efficient network this is because a significant portion of the packets successfully reach their intended cluster heads in the X-LEACH.
At the end of the simulation, the total throughput per round in the X-LEACH protocol was higher than in both LEACH and SEP across all four scenarios. This indicates that the performance of the network has improved with the X-LEACH routing protocol.
-
4.6 Number of Cluster Heads Formed Per Round in All the Scenarios
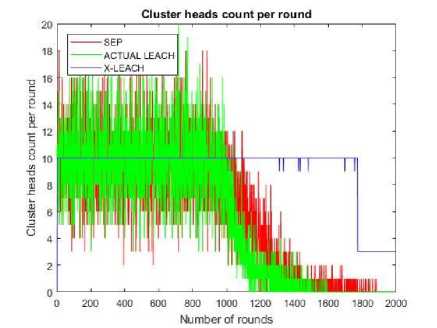
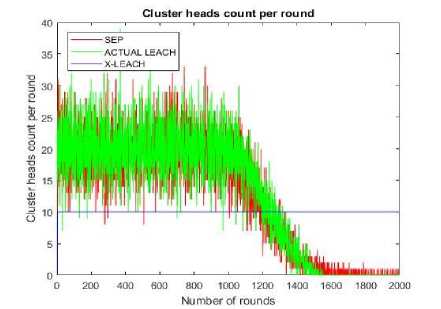
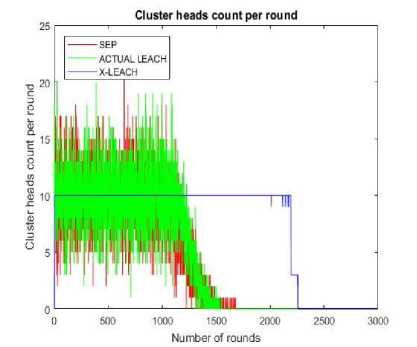
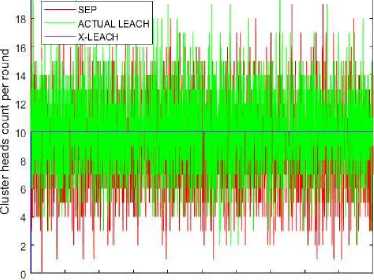
In terms of the number of cluster heads formed per round across all scenarios, the results indicated that the X-LEACH protocol generated a consistent number of clusters in each round. In contrast, the LEACH and SEP protocols produced a non-uniform number of clusters, showing a variability where some rounds had many clusters while others had very few, as illustrated in Figure 7. The graphs demonstrate that in all scenarios, the X-LEACH protocol produced approximately 10 clusters and cluster heads per round, and LEACH and SEP yielded differing numbers of clusters and cluster heads each round.
The simulation results for all scenarios indicate that X-LEACH consistently forms 10 cluster heads per round. In contrast, the number of cluster heads in SEP and LEACH varies across rounds, leading to a non-uniform distribution. Specifically, there are rounds with a higher number of cluster heads and other rounds with fewer. This variability means that in the LEACH and SEP protocols when more clusters are formed, there are fewer nodes in each cluster. Conversely, when there are fewer clusters, more nodes are allocated to each cluster. This phenomenon contributes to increased energy consumption among the nodes. The number of cluster heads formed per round for the simulated algorithms is illustrated in Figure 7(a-d).
a) Scenario 1. Sparsely populated nodes
b) Scenario 2. Densely populated nodes
c) Scenario 3. Increasing no of rounds
d) Scenario 4. Increasing energy
Cluster heads count per round 20 --------i—i-----1--------1--------1--------1--------1--------гл—
0 200 400 600 800 1000 1200 1400 1600 1800 2000
Number of rounds
Fig. 7. Number of Cluster Heads Formed per Round in all the Scenarios
5. Discussion
In this study, simulation experiments conducted from the four scenarios considered the number of dead nodes, number of live nodes, total remaining energy, packet delivery ratio throughput of the network, and number of cluster heads formed per round performance metrics. The results compared the performance of the X-LEACH against LEACH and SEP protocols.
The results from the experiments indicated that, in terms of the number of dead nodes per round, the X-LEACH protocol outperformed both LEACH and SEP. This superior performance can be attributed to X-LEACH's use of the Extended K-Means cluster head selection algorithm, which helps distribute energy consumption more evenly among sensor nodes. As a result, the number of dead nodes in the network is significantly reduced. The primary objective of the Extended Low Energy Adaptive Clustering Hierarchy (LEACH) protocol is to extend the network's lifetime by conserving energy and optimizing the utilization of sensor nodes. As shown in the graph, there are fewer dead nodes in the X-LEACH protocol compared to the actual LEACH and SEP protocols. This implies that X-LEACH has successfully increased the lifetime of wireless sensor networks while reducing energy consumption.
The X-LEACH protocol outperformed both LEACH and SEP regarding the number of live nodes per round. The extended LEACH protocol is designed to enhance energy efficiency and prolong the network's lifespan compared to the original LEACH protocol. By utilizing extended K-Means clustering and incorporating advanced algorithms for selecting cluster heads, energy consumption can be distributed more evenly among sensor nodes. This approach has the potential to increase the number of live nodes in the network, allowing them to operate for longer periods. A higher number of live nodes per round generally indicates improved network coverage. With more nodes actively engaged in data sensing, collection, and forwarding, the network can achieve better coverage and monitoring capabilities.
In terms of total remaining energy per round, the X-LEACH protocol demonstrated superior performance compared to both LEACH and SEP. The X-LEACH protocol aims to enhance energy efficiency relative to the original LEACH protocol by employing an extended K-Means cluster head selection algorithm. This approach allows for a more balanced distribution of energy consumption among sensor nodes. As a result, the total remaining energy of nodes per round is greater in X-LEACH compared to LEACH and SEP. This signifies improved energy conservation, indicating that the energy utilization in X-LEACH is more effective.
The X-LEACH protocol outperformed the benchmark protocols, including LEACH and SEP, in terms of packet delivery ratio and throughput. A high packet delivery ratio and throughput indicate a reliable and efficient network, as a significant portion of the packets successfully reach their intended cluster heads in the X-LEACH protocol.
In terms of the number of cluster heads formed per round, the results indicated that the X-LEACH generated a uniform number of clusters in each round. In contrast, both LEACH and SEP produced a non-uniform number of clusters, with some rounds featuring many clusters and others having very few. The X-LEACH consistently formed 10 clusters and cluster heads per round, while LEACH and SEP varied in the number of clusters and cluster heads each round. This consistency points to a reliable and efficient network, which can be attributed to the uniform number of clusters and cluster heads in the X-LEACH protocol.
6. Conclusion and Future Works
This study aimed to evaluate an extended Low Energy Adaptive Clustering Hierarchy (X-LEACH) routing protocol against the benchmarks of LEACH and SEP using MATLAB Simulator. To compare the performance of X-LEACH, four simulation scenarios were established, with six experiments conducted in each scenario. The network performance metrics used in the simulations included the number of dead nodes per round, the number of live nodes per round, total remaining energy per round, packet delivery ratio per round, throughput per round, and the number of cluster heads formed per round.
The results show that the extended X-LEACH protocol outperformed the LEACH and SEP routing protocols in every scenario.
Future research should focus on evaluating the effectiveness of X-LEACH in dynamic environments where sensor nodes are mobile. Additionally, studies should analyze the protocol's performance in heterogeneous networks composed of nodes with varying energy levels, capacities, and transmission ranges. Finally, efforts should be made to enhance the security features of X-LEACH to protect against potential threats such as eavesdropping and data tampering.
