A Comparative Study on the Performance of Fuzzy Rule Base and Artificial Neural Network towards Classification of Yeast Data

Author: Shrayasi Datta, J. Paulchoudhury
Journal: International Journal of Information Technology and Computer Science(IJITCS) @ijitcs
Article in issue: 5 Vol. 7, 2015.
Free access
Classification of yeast data plays an important role in the formation of medicines and in various chemical components. If the type of yeast can be recognized at the primary stage based on the initial characteristics of it, a lot of technical procedure can be avoided in the preparation of chemical and medical products. In this paper, the performance two classifying methodologies namely artificial neural network and fuzzy rule base has been compared, for the classification of proteins. The objective of this work is to classify the protein using the selected classifying methodology into their respective cellular localization sites based on their amino acid sequences. The yeast dataset has been chosen from UCI machine learning repository which has been used for this purpose. The results have shown that the classification using artificial neural network gives better prediction than that of fuzzy rule base on the basis of average error.
Protein Localization, Classification, Neural Network, Fuzzy Rule Base, Yeast Dataset
Short address: https://sciup.org/15012283
IDR: 15012283
Text of the scientific article A Comparative Study on the Performance of Fuzzy Rule Base and Artificial Neural Network towards Classification of Yeast Data
Published Online April 2015 in MECS
A cell usually contains approximate 1 billion (or 109) protein molecules [1], [2]. These protein molecules reside in various compartments of a cell which usually called “protein subcellular locations”. The information about these subcellular locations helps to know the functions of the cell and the biological process executed by the cells. This information also has been used for the identification of drug targets ([3], [4]). Determining the subcellular localization of a protein by conducting bio-chemical experiments is a laborious and time consuming task. But with the development of machine learning techniques [5] in computer science, together with an increased dataset of proteins of known localization, fast and accurate localization predictions for many organisms have been done successfully. This is due to the nature of machine learning approaches, which performed well in domains where there is a vast collection of data but with a little theory –which perfectly describes the situation in bioinformatics [5]. Among various prokaryotic and eukaryotic organisms, yeast is important because these are widely used in medicine and in food technology field. Biological structure of yeast has also snatched the attention of researchers for many years because of their similarity with human cell.
For predicting the subcellular localization of yeast protein, the first approach has been developed by Kanehisa and Nakai([6],[7]). Horton and Nakai[8] have proposed a probabilistic model where expert has identified those features which learn its parameters from a set of training data. The authors also have implemented and tested three machine learning techniques namely k-nearest neighbor algorithm, binary decision tree, naïve Bayes classifier in yeast dataset and E.Coli dataset[9]. Performance of these three techniques with the Probabilistic method [8] has also been compared and it has been shown that the performance of k-nearest neighbor algorithm is better among these four. Chen Y.[10] has implemented three machine learning classification algorithms: decision tree, perceptron, two-layer feedforward network for predicting subcellular localization site of a protein of yeast and E.Coli dataset. And it is concluded that three techniques has similar performance measure for this two dataset. Qasim, R, Begum, K. Jahan, N. Ashrafi, T. Idris, S. Rahman, R.M. [11], have proposed an automated fuzzy interference system for protein subcellular localization. Bo Jin, Yuchun Tang, Yan-Qing Zhang, Chung-Dar Lu and Irene Weber [12], have proposed and designed SVM with fuzzy hybrid kernel based on TSK fuzzy model and have showed that fuzzy hybrid kernel has achieved better performance in SVM classification. Prediction of protein subcellular localization work has been done in ([13]-[16]). Out of these, support vector machine techniques have been used in ([13]-[15]). A lot of decent work also has been done on webserver design for subcellular prediction ([17]-[20]). Algorithm based on Fuzzy rule base technique is proposed in heart disease and in packet delivery time ([21]-[23]).
Classification is done with some widely used machine learning techniques, like, KNN, multilayered feed forward neural network, SVM etc.([6]-[16]), but most of the work is based on some comparison with other datasets, like E.Coli , fungi etc. They mostly have concentrated on the algorithm, i.e. which algorithm is best suited for classification task of medical datasets. But for a particular dataset, which algorithm is most efficient has not been checked. And that is why the work described in this paper has been taken. Here, a popular and very important protein subcellular localization dataset, yeast, has been taken for classification, and multilayered feed forward neural network and fuzzy rule base technique has been used and compared for classification task. Yeast dataset from UCI machine learning laboratories has been used in this paper. Each input of the dataset corresponds to a protein. The output is the predicted localization site of a protein. After the implementation, performance of the two techniques has been evaluated and compared on the basis of average error.
In this research work, the yeast data set obtained from UCI machine learning repository has been used[24]. The objective of this dataset is to determine the cellular localization of the yeast proteins. Yeast dataset, representing the kingdom of eukaryote, consists of 9 features (8 attributes, 1 sequence-name) .The attributes are mcg, gvh, alm, mit, erl, pox, vac, nuc. Each of the attributes has been used to classify the localization site of a protein which is a score (between 0 and 1) corresponding to a certain feature of the protein sequence. The higher the score is, the more possible the protein sequence has such feature. Proteins are classified into 10 classes, these are cytosolic or cytoskeletal (CYT), nuclear (NUC), mitochondrial (MIT), membrane protein without N-terminal signal (ME3), membrane protein with uncleaved signal (ME2), membrane protein with cleaved signal (ME1) , extracellular (EXC), vacuolar (VAC), peroxisomal (POX), endoplasmic reticulum lumen (ERL).
The paper is organized as follows, in section 1, the importance of this research work and a brief literature review is furnished. In section 2, a brief theoretical introduction is presented about the techniques used in this work with the description of the dataset used. Section 3 deals with the detailed procedure of the work and its result with error calculation. Finally, Section 4 concludes the paper.
-
II .Methodology
-
A. Artificial Neural Network.
Artificial neural network (ANN) follows a computational paradigm that is inspired by the structure and functionality of the brain. The ANN consists of an interconnected group of artificial neurons processing the information to compute the result.
-
B. Multilayered Feed Forward Neural Network
Multilayer Feed-forward ANNs (MLFFNN) is made of multiple layers. It possesses an input and an output layer and also has one or more intermediary layers called hidden layers (fig. 1). The computational units of the hidden layer are known as the hidden neurons or hidden units.
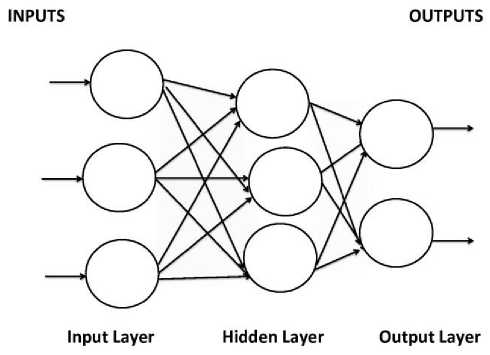
Fig. 1. A Multilayered feed forward neural network
-
C. Fuzzy Inference System
A fuzzy inference system (FIS) is a system that transforms a given input to an output with the help of fuzzy logic (fig. 2).The procedure followed by a fuzzy inference system is known as fuzzy inference mechanism or simply fuzzy inference.
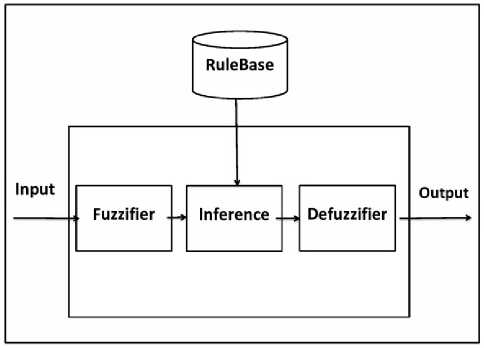
Fig. 2. A fuzzy inference system
The entire fuzzy inference process consists of five steps. These are, fuzzification of the input variables, application of the fuzzy operators on the antecedent parts of rule, evaluation of the fuzzy rules, aggregation of the fuzzy sets across the rules, and defuzzification of the resultant aggregate fuzzy set.
-
D. Fuzzy Membership Function
Fuzzy membership function determines the membership functions of objects to fuzzy set of all variables. A membership function provides a measure of the degree of similarity of an element to a fuzzy set. There are different shapes of membership functions; triangular, trapezoidal, piecewise-linear, Gaussian, bellshaped, etc.
-
a. Trapezoidal Membership Function
It is defined by a lower limit a , an upper limit d , a lower support limit b , and an upper support limit c , where a < b < c < d .
|
0if ( x < a ) or ( x > d ) |
||
|
ц а ( x ) = • |
x — a т , , , ----ifa <= x <= b b - a |
. (1) |
|
1ifb <= x <= d d - x т _ . д ----ifc <= x <= d _ d - c |
-
b. Gaussian Membership Function
It is defined by a central value m and a standard deviation k > 0 . The smaller k is, the narrower the “bell” is.
- ( x - m ) 2 ц а ( x ) = e 2 k k
-
c. Triangular Membership function
It is defined by a lower limit
a
, an upper limit
b
, and a value m, where a
|
0 if ( x <= a ) |
||
|
x — a |
||
|
----if ( a <= x <= m |
||
|
Ц а ( x ) = • |
m - a |
\ (3) |
|
b - x , |
||
|
----ifm < x < b |
||
|
b - m |
||
|
0 ifx <= b |
-
E. Error Analysis
The performance of the two methods of classification has been evaluated by estimated error and average error.
Estimated error (E i ) of an individual instance i is given by (4) :-
Where, Pi is the output class value estimated for a given instance, Ti is the actual output class value for that instance.
Average Error is derived using (5):
n
A =12 Ei n i=1
Where E i is the Estimated error and n is the number of instances.
-
III. Implementation and Result
-
A. Implementation.
-
a. Dataset Preprocessing.
Step 1.
As stated previously, yeast dataset[24] consists of 10 numbers of attributes. At first the first attribute (sequence name) is discarded, as this attribute is not necessary for the classification task.
Step 2.
The output class names are of non-numeric type for example MIT, CYT, VAC etc. These are replaced by numeric value 1, 2, 3 etc. The class names with their replaced numeric values are listed in table 1.
Table 1. Class name and numerical value
|
Class name |
Numerical value |
|
MIT |
1 |
|
NUC |
2 |
|
CYT |
3 |
|
ME1 |
4 |
|
EXC |
5 |
|
ME2 |
6 |
|
ME3 |
7 |
|
VAC |
8 |
|
POX |
9 |
|
ERL |
10 |
Now the dataset consists of 9 attributes, out of which 8 attributes have been taken for input and the last one as class name. All the attributes have been changed to numerical value as furnished in table 1. Now the dataset is ready to be classified using artificial neural network and fuzzy rule base both.
-
b. Classification Using Fuzzy Rule Base.
Step 1.
One Fuzzy Inference System(FIS) with 8 inputs and 1 output has been used.
Step 2.
The range of the input and output variables are first retrieved and then decomposed based on the range of their values. These are furnished in table 2 to Table 8. It is to note that there are 8 attributes .these are mcg, gvh, aln, mit, erl, vac, nuc and pox. Out of these the attributes pox has not been used since this attribute contains 0.00 values in all the data sets.
Table 2. Classification of Attribute 1 (mcg)
|
Range |
Fuzzy set value |
|
0.42 to 0.64 |
Low1 |
|
0.33 to 0.61 |
Low2 |
|
0.40 to 0.73 |
Low3 |
|
0.91 to 0.70 |
Medium1 |
|
0.49 to 0.89 |
Medium2 |
|
0.54 to 0.94 |
Medium3 |
|
0.28 to 0.54 |
High1 |
|
0.28 to 0.80 |
High2 |
|
0.32 to 0.68 |
High3 |
|
0.7 to 0.86 |
Very high |
Table 3. Classification of Attribute 2 (gvh)
|
Range |
Fuzzy set value |
|
0.40 to 0.67 |
Low1 |
|
0.31 to 0.60 |
Low2 |
|
0.39 to 0.63 |
Low3 |
|
0.66 to 0.88 |
Medium1 |
|
0.39 to 0.87 |
Medium2 |
|
0.42 to 0.75 |
Medium3 |
|
0.24 to 0.58 |
High1 |
|
0.32 to 0.82 |
High2 |
|
0.27 to 0.68 |
High3 |
|
0.56 to 0.92 |
Very high |
Table 4. Classification of Attribute 3(aln)
|
Range |
Fuzzy set value |
|
0.45 to 0.66 |
Low1 |
|
0.43 to 0.69 |
Low2 |
|
0.42 to 0.60 |
Low3 |
|
0.30 to 0.47 |
Medium1 |
|
0.36 to 0.58 |
Medium2 |
|
0.33 to 0.58 |
Medium3 |
|
0.21 to 0.42 |
High1 |
|
0.26 to 0.57 |
High2 |
|
0.43 to 0.59 |
High3 |
|
0.38 to 0.58 |
Very high |
Table 5. Classification of Attribute 4(mit)
|
Range |
Fuzzy set value |
|
0.13 to 0.65 |
Low1 |
|
0.13 to 0.43 |
Low2 |
|
0.11 to 0.35 |
Low3 |
|
0.23 to 0.78 |
Medium1 |
|
0.23 to 0.37 |
Medium2 |
|
0.4 to 0.49 |
Medium3 |
|
0.12 to 0.31 |
High1 |
|
0.08 to 0.28 |
High2 |
|
0.10 to 0.49 |
High3 |
|
0.25 to 0.40 |
Very high |
Table 6. Classification of Attribute 5(erl)
|
Range |
Fuzzy set value |
|
0.00 to 0.1 |
low |
|
1.00 to 1.11 |
high |
Table 7. Classification of Attribute 7(vac)
|
Range |
Fuzzy set value |
|
0.22 only |
Low1 |
|
0.22 to 0.34 |
Low2 |
|
0.22 to 0.40 |
Low3 |
|
0.22 to 0.63 |
Medium1 |
|
0.22 only |
Medium2 |
|
0.22 to 0.35 |
Medium3 |
|
0.22 to 0.66 |
High1 |
|
0.22 to 0.40 |
High2 |
|
0.22 to 0.41 |
High3 |
|
0.53 to 0.58 |
Very high |
Table 8. Classification of Attribute 8(nuc)
|
Range |
Fuzzy set value |
|
0.46 to 0.53 |
Low1 |
|
0.47 to 0.68 |
Low2 |
|
0.49 to 0.58 |
Low3 |
|
0.43 to 0.58 |
Medium1 |
|
0.39 to 0.56 |
Medium2 |
|
0.40 to 0.59 |
Medium3 |
|
0.43 to 0.55 |
High1 |
|
0.39 to 0.60 |
High2 |
|
0.40 to 0.54 |
High3 |
|
0.53 to 0.58 |
Very high |
Based on the input and output data, a rule base has been created which has been furnished in table 9.
Now membership function has been applied to all input variables and output variable. Here, four combination of membership function for input and output variables has been applied. The combination has been listed in Table no 10. From table 10, it is to note that the input and output membership functions have been used Gaussian 2 for serial no 1. This means all input 8 attributes, Gaussian 2 membership function has been used for each rule. Similarly, this notation has been used for other rules.
Table 9. Rule base
|
Rule no. |
Rules |
|
1. |
If (att1 is low1) and (att2 is low1) and (att3 is low1) and (att4 is low1) and (att5 is a5) and (att6 is a6) and (att7 is low1) and (att8 is lowc1) then (output1 is class1) (1) |
|
2. |
If (att1 is low2) and (att2 is low2) and (att3 is low2) and (att4 is low2) and (att5 is a5) and (att6 is a6) and (att7 is low2) and (att8 is low2) then (output1 is class2) (1) |
|
3 |
If (att1 is low3) and (att2 is low3) and (att3 is low3) and (att4 is low3) and (att5 is a5) and (att6 is a6) and (att7 is low3) and (att8 is low3) then (output1 is class3) (1) |
|
4 |
If (att1 is medium1) and (att2 is medium1) and (att3 is medium1) and (att4 is medium1) and (att5 is a5) and (att6 is a6) and (att7 is medium1) and (att8 is medium1) then (output1 is class4) (1) |
|
5 |
If (att1 is medium2) and (att2 is medium2) and (att3 is medium2) and (att4 is medium2) and (att5 is a5) and (att6 is a6) and (att7 is medium2) and (att8 is lowc1) then (output1 is class5) (1) |
|
6 |
If (att1 is medium3) and (att2 is medium3) and (att3 is medium3) and (att4 is medium3) and (att5 is a5) and (att6 is a6) and (att7 is medium3) and (att8 is medium3) then (output1 is class6) (1) |
|
7 |
If (att1 is high1) and (att2 is high1) and (att3 is high1) and (att4 is high1) and (att5 is a5) and (att6 is a6) and (att7 is high1) and (att8 is high1) then (output1 is class7) (1) |
|
8 |
If (att1 is high2) and (att2 is high2) and (att3 is high2) and (att4 is high2) and (att5 is a5) and (att6 is a6) and (att7 is high2) and (att8 is high2) then (output1 is class8) (1) |
|
9 |
If (att1 is high3) and (att2 is high3) and (att3 is high3) and (att4 is high3) and (att5 is a5) and (att6 is a6) and (att7 is high3) and (att8 is high3) then (output1 is class9) (1) |
|
10 |
If (att1 is very_high) and (att2 is very_high) and (att3 is very_high) and (att4 is very_high) and (att5 is a5c10) and (att6 is a6) and (att7 is very_high) and (att8 is very_high) then (output1 is class10) (1) |
Table 10. Input and Output membership functions
|
Sl. No. |
Membership function for Input variable |
Membership function for Output variable |
|
1 |
Gaussian2 |
Gaussian2 |
|
2 |
Gaussian2 |
Triangular |
|
3 |
Trapezoidal |
Trapezoidal |
|
4 |
Trapezoidal |
Triangular |
The estimated output has been calculated based on the combination of membership functions as listed in table 10, and, using fuzzy rule base as furnished in Table 9 for all 50 data items. The output has been furnished in table 11.
Based on the actual output(available in the dataset) and estimated output(as calculated), estimated error has been calculated for all input-output membership functions and has been furnished in Table 12.
The average error for each combination of input-output membership function has been calculated which has been furnished in Table 13.
Table 11. Input and Output fuzzy values
|
Index no. |
Best output value in FIS |
Estimated output for Trapezoidal-Triangular combination for input-output membership function |
Estimated output for Trapezoidal-Trapezoidal combination for input-output membership function |
Estimated output for Gaussian2-Gaussian2 combination for input-output membership function |
Estimated output for Gaussian2-Triangular combination for input-output membership function |
|
1. |
0.1 |
0.1 |
0.1 |
0.473 |
0.463 |
|
2. |
0.1 |
0.1 |
0.1 |
0.396 |
0.411 |
|
3. |
0.1 |
0.1 |
0.1 |
0.475 |
0.48 |
|
4. |
0.1 |
0.1 |
0.1 |
0.465 |
0.462 |
|
5. |
0.1 |
0.196 |
0.195 |
0.483 |
0.484 |
|
6. |
0.1 |
0.1 |
0.1 |
0.472 |
0.472 |
|
7. |
0.2 |
0.2 |
0.2 |
0.517 |
0.523 |
|
8. |
0.2 |
0.5 |
0.5 |
0.398 |
0.399 |
|
9. |
0.2 |
0.317 |
0.315 |
0.555 |
0.555 |
|
10. |
0.2 |
0.2 |
0.2 |
0.465 |
0.465 |
|
11. |
0.2 |
0.462 |
0.461 |
0.524 |
0.526 |
|
12. |
0.2 |
0.345 |
0.347 |
0.59 |
0.489 |
|
13. |
0.2 |
0.622 |
0.628 |
0.59 |
0.569 |
|
14. |
0.2 |
0.3 |
0.3 |
0.59 |
0.561 |
|
15. |
0.3 |
0.341 |
0.34 |
0.451 |
0.449 |
|
16. |
0.3 |
0.2 |
0.2 |
0.453 |
0.448 |
|
17. |
0.3 |
0.333 |
0.333 |
0.447 |
0.446 |
|
18. |
0.3 |
0.3 |
0.3 |
0.548 |
0.547 |
|
19. |
0.3 |
0.34 |
0.342 |
0.541 |
0.543 |
|
20. |
0.3 |
0.346 |
0.345 |
0.463 |
0.445 |
|
21. |
0.3 |
0.2 |
0.2 |
0.463 |
0.552 |
|
22. |
0.3 |
0.391 |
0.39 |
0.463 |
0.552 |
|
23. |
0.4 |
0.4 |
0.4 |
0.54 |
0.538 |
|
24. |
0.4 |
0.4 |
0.4 |
0.54 |
0.489 |
|
25. |
0.4 |
0.4 |
0.4 |
0.54 |
0.552 |
|
26. |
0.5 |
0.5 |
0.5 |
0.52 |
0.526 |
|
27. |
0.5 |
0.5 |
0.5 |
0.604 |
0.602 |
|
28. |
0.5 |
0.5 |
0.5 |
0.604 |
0.602 |
|
29. |
0.6 |
0.6 |
0.6 |
0.612 |
0.612 |
|
30. |
0.6 |
0.559 |
0.559 |
0.484 |
0.482 |
|
31. |
0.6 |
0.457 |
0.455 |
0.505 |
0.499 |
|
32. |
0.7 |
0.2 |
0.2 |
0.708 |
0.711 |
|
33. |
0.7 |
0.2 |
0.2 |
0.663 |
0.661 |
|
34. |
0.7 |
0.2 |
0.2 |
0.662 |
0.66 |
|
35. |
0.7 |
0.2 |
0.2 |
0.662 |
0.66 |
|
36. |
0.7 |
0.2 |
0.2 |
0.637 |
0.631 |
|
37. |
0.7 |
0.5 |
0.5 |
0.745 |
0.747 |
|
38. |
0.7 |
0.7 |
0.7 |
0.698 |
0.703 |
|
39. |
0.7 |
0.3 |
0.3 |
0.504 |
0.498 |
|
40. |
0.7 |
0.5 |
0.5 |
0.748 |
0.749 |
|
41. |
0.8 |
0.5 |
0.5 |
0.61 |
0.604 |
|
42. |
0.8 |
0.561 |
0.565 |
0.551 |
0.551 |
|
43. |
0.8 |
0.5 |
0.5 |
0.523 |
0.518 |
|
44. |
0.8 |
0.5 |
0.5 |
0.562 |
0.557 |
|
45. |
0.9 |
0.5 |
0.5 |
0.5 |
0.5 |
|
46. |
0.9 |
0.5 |
0.5 |
0.0.5 |
0.5 |
|
47. |
0.9 |
0.5 |
0.5 |
0.5 |
0.5 |
|
48. |
1.0 |
0.5 |
0.5 |
0.5 |
0.5 |
|
49. |
1.0 |
0.5 |
0.5 |
0.5 |
0.5 |
|
50. |
1.0 |
0.5 |
0.5 |
0.5 |
0.5 |
Table 12. Estimated error for input-output membership function combination
|
Index no. |
Estimated Error for Trapezoidal-Triangular combination for input-output membership function |
Estimated Error for Trapezoidal- Trapezoidal combination for input-output membership function |
Estimated Error for Gaussian2- Gaussian2 combination for inputoutput membership function |
Estimated Error for Gaussian2-Triangular combination for input-output membership function |
|
1. |
0.0 |
0.0 |
3.73 |
3.63 |
|
2. |
0.0 |
0.0 |
2.96 |
3.10 |
|
3. |
0.0 |
0.0 |
3.75 |
3.8 |
|
4. |
0.0 |
0.0 |
3.65 |
3.61 |
|
5. |
0.96 |
0.95 |
3.83 |
3.84 |
|
6. |
0.0 |
0.0 |
3.71 |
3.71 |
|
7. |
0.0 |
0.0 |
1.585 |
1.615 |
|
8. |
1.499 |
1.49 |
0.99 |
0.995 |
|
9. |
0.585 |
0.575 |
1.775 |
1.775 |
|
10. |
0.0 |
0.0 |
1.325 |
1.325 |
|
11. |
1.31 |
1.306 |
1.61 |
1.63 |
|
12. |
0.72 |
0.73 |
1.949 |
1.44 |
|
13. |
2.11 |
2.13 |
1.949 |
1.84 |
|
14. |
0.499 |
0.49 |
1.949 |
1.805 |
|
15. |
0.136 |
0.133 |
0.50 |
0.49 |
|
16. |
0.333 |
0.333 |
0.51 |
0.49 |
|
17. |
0.11 |
0.11 |
0.49 |
0.48 |
|
18. |
0.0 |
0.14 |
0.82 |
0.82 |
|
19. |
0.133 |
0.0 |
0.80 |
0.81 |
|
20. |
0.15 |
0.149 |
0.54 |
0.48 |
|
21. |
0.333 |
0.333 |
0.54 |
0.84 |
|
22. |
0.30 |
0.30 |
0.54 |
0.84 |
|
23. |
0.0 |
0.0 |
0.35 |
0.345 |
|
24. |
0.0 |
0.0 |
0.35 |
0.222 |
|
25. |
0.0 |
0.0 |
0.35 |
0.38 |
|
26. |
0.0 |
0.0 |
0.0.4 |
0.052 |
|
27. |
0.0 |
0.0 |
0.207 |
0.203 |
|
28. |
0.0 |
0.0 |
0.207 |
0.203 |
|
29. |
0.0 |
0.0 |
0.02 |
0.02 |
|
30. |
0.068 |
0.06 |
0.19 |
0.19 |
|
31. |
0.23 |
0.24 |
0.15 |
0.16 |
|
32. |
00.71 |
00.71 |
0.011 |
0.01 |
|
33. |
00.71 |
00.71 |
0.05 |
0.055 |
|
34. |
00.71 |
00.71 |
0.054 |
0.0571 |
|
35. |
00.71 |
00.71 |
0.054 |
0.0571 |
|
36. |
00.71 |
00.71 |
0.08 |
0.0985 |
|
37. |
00.28 |
00.28 |
0.06 |
0.0671 |
|
38. |
0.0 |
0.0 |
0.00 |
0.004 |
|
39. |
0.571 |
0.571 |
0.27 |
0.2885 |
|
40. |
00.28 |
00.28 |
0.06 |
0.070 |
|
41. |
0.375 |
0.375 |
0.23 |
0.245 |
|
42. |
0.298 |
0.293 |
0.3112 |
0.311 |
|
43. |
0.375 |
0.375 |
0.346 |
0.3525 |
|
44. |
0.375 |
0.375 |
0.2975 |
0.3037 |
|
45. |
0.44 |
0.44 |
0.44 |
0.44 |
|
46. |
0.44 |
0.44 |
0.44 |
0.44 |
|
47. |
0.44 |
0.44 |
0.44 |
0.44 |
|
48. |
0.5 |
0.5 |
0.5 |
0.5 |
|
49. |
0.5 |
0.5 |
0.5 |
0.5 |
|
50. |
0.5 |
0.5 |
0.5 |
0.5 |
Table 13. Average error for input and output membership function
|
Sl. No. |
Membership function for Input variable |
Membership function for Output variable |
Average Error |
|
1. |
Trapezoidal |
Triangular |
0.36806 |
|
2. |
Trapezoidal |
Trapezoidal |
0.3751 |
|
3. |
Gaussian2 |
Gaussian2 |
0.92 |
|
4. |
Gaussian2 |
Triangular |
2.59 |
From Table 13, it has been observed that average error calculated using membership function for input variable as Trapezoidal and membership function for output variable as Triangular is minimum. Therefore the inputoutput membership function combination as trapezoidal-Triangular has to be used for classification of yeast data when using fuzzy rule base.
-
c. Classification Using Multi-Layered Feed Forward Artificial Neural Network.
Step 1.
16.
0.3
0.3989
0.329
17.
0.3
0.3121
0.040
18.
0.3
0.2569
0.14
19.
0.3
0.2970
0.01
20.
0.3
0.2764
0.07
21.
0.3
0.3558
0.186
22.
0.3
0.3626
0.208
23.
0.4
0.40680
0.016
24.
0.4
0.4393
0.09
25.
0.4
0.4638
0.15
26.
0.5
0.5002
0.00
27.
0.5
0.5035
0.00
28.
0.5
0.5035
0.00
29.
0.6
0.6093
0.01
30.
0.6
0.6284
0.04
31.
0.6
0.6322
0.05
32.
0.7
0.6951
0.006
33.
0.7
0.7229
0.032
34.
0.7
0.7563
0.080
35.
0.7
0.7563
0.080
36.
0.7
0.7507
0.072
37.
0.7
0.7302
0.0431
38.
0.7
0.7112
0.016
39.
0.7
0.7728
0.104
40.
0.7
0.7071
0.0101
41.
0.8
0.7115
0.11
42.
0.8
0.6794
0.15
43.
0.8
0.6817
0.14
44.
0.8
0.5080
0.365
45.
0.9
0.8808
0.021
46.
0.9
0.8702
0.033
47.
0.9
0.9029
0.003
48.
1.0
0.99
0.01
49.
1.0
1.01
0.01
50.
1.0
1.09
0.09
In order to improve the performance, the feed forward back propagation neural network (8 input node,10 hidden node and 1 output node) has been used.
Table 14. Neural Network characteristics
|
Architecture |
Multilayer feedforward neural network (MLFNN) |
|
Training Method |
Backpropagation training algorithm |
|
Learning method |
Supervised Learning |
|
Activation function |
sigmoid |
It is to note that from 1484 samples, 154 number of samples has been taken for training and 102 number of samples for tested. From those, estimated data and estimated error of total 50 samples have been furnished in Table 15. The average error has been found as 0.3416.
Table 15. Estimated output and Estimated error using MLFFNN
|
Index no. |
Best output value in neural network |
Estimated output |
Estimated Error using ANN |
|
1. |
0.1 |
0.0916 |
0.08 |
|
2. |
0.1 |
0.3117 |
2.116 |
|
3. |
0.1 |
-0.0183 |
1.183 |
|
4. |
0.1 |
0.0774 |
0.22 |
|
5. |
0.1 |
0.4646 |
3.646 |
|
6. |
0.1 |
-0.0085 |
1.085 |
|
7. |
0.2 |
0.3071 |
0.535 |
|
8. |
0.2 |
0.2609 |
0.3045 |
|
9. |
0.2 |
0.3909 |
0.9545 |
|
10. |
0.2 |
0.4819 |
1.409 |
|
11. |
0.2 |
0.2217 |
0.108 |
|
12. |
0.2 |
0.1435 |
0.28 |
|
13. |
0.2 |
0.2452 |
0.225 |
|
14. |
0.2 |
0.2648 |
0.323 |
|
15. |
0.3 |
0.3335 |
0.111 |
-
B. Result.
A comparative study has been made on the basis of average error of fuzzy rule base using Trapezoidal-Triangular (input-output) membership function and neural network. The result has been furnished in table 16.It has been observed that multilayer feed forward back propagation neural network is more preferable than fuzzy rule base. Therefore multilayer feed forward
Back propagation neural network can be used for classification using yeast data.
Table 16. Methodology versus average error
|
Methodology |
Average Error |
|
Fuzzy rule base with Trapezoidal- as input and Triangular membership function for output |
0.36806 |
|
Multilayered feed forward neural network |
0.34158 |
-
IV. Conclusion and Future Scope
In this work, two methods for classifying the yeast dataset have been evaluated using MATLAB. And it is concluded that multilayered feed forward neural network is more suitable for this classification. In fuzzy rule base it has been further observed that Fuzzy rule base with Trapezoidal membership function as input and Triangular membership function for output is preferable than other combination of membership functions. The same technique may be used in other classification problems.
References A Comparative Study on the Performance of Fuzzy Rule Base and Artificial Neural Network towards Classification of Yeast Data
- B. Alberts, D. Bray, J. Lewis, M. Raff, K. Roberts, J.D. Watson, Molecular Biology of the Cell, Garland, New York, 1994.
- H. Lodish, D. Baltimore, A. Berk, S.L. Zipursky, P. Matsudaira, J. Darnell, Molecular Cell Biology, Scientific American Books, New York, 1995
- Z.-P. Feng, An overview on predicting the subcellular location of a protein, Silico. Biol. 2 (3) (2002) page 291–303.
- Q. Cui, T. Jiang, B. Liu, S. Ma, Esub8: a novel tool to predict protein subcellular localizations in eukaryotic organisms, BMC Bioinformatics 5 (1) (2004) 1–7.
- Shavlik, J., Hunter, L. & Searls, D. (1995).Introduction. Machine Learning, 21: 5-10.
- Nakai and Kanehisa . 1991.”Expert system for predicting protein localization sites in gram negative bacteria”,PROTEINS,structure,function and genetics,11:95-110.
- Nakai and Kanehisa 1992, A knowledge base for predicting protein localization sites in eukaryotic cells.Genomics, 14:897-911.
- Horton and Nakai,1996:A probabilistic classification system for predicting of cellular localization of sites of protein.In Proceedings of Fourth International Conference on Intelligent Systems for Molecullar Biology.109-115.St. Louis.AAAI Press.
- Paul Horton , Kenta Nakai, “Better Prediction of Protein Cellular Localization Sites with the it k Nearest Neighbors Classifier”, Proceedings of the 5th International Conference on Intelligent Systems for Molecular Biology, p.147-152, June 21-26, 1997
- Yetian Chen, Predicting the Cellular Localization Sites of Proteins Using Decision Tree and Neural Networks, http://www.cs.iastate.edu/~yetianc/cs572/files/CS572_Project_YETIANCHEN.pdf.unpublished.
- Qasim, R, Begum, K. ; Jahan, N. ; Ashrafi, T. ; Idris, S. ; Rahman, R.M.:” Subcellular localization of proteins using automated fuzzy inference system”, published at Informatics, Electronics & Vision (ICIEV), 2013 International Conference on May 2013,pages 1-5
- Support Vector Machine with the Fuzzy Hybrid Kernel for Protein Subcellular Localization Classification “;Bo Jin, Yuchun Tang, Yan-Qing Zhang, Chung-Dar Lu and Irene Weber; The 2005 IEEE International Conference on Fuzzy Systems;pages 420-423.
- X.-B. Zhou, C. Chen, Z.-C. Li, and X.-Y. Zou;”Improved prediction of subcellular location for apoptosis proteins by the dual-layer support vector machine”; Amino Acids (2008) 35: 383–388.
- Ana Carolina Lorena, André C.P.L.F. de Carvalho:”Protein cellular localization prediction with SupportVector Machines and Decision Trees”; Computers in Biology and Medicine 37 (2007) 115 – 125.
- Jing Huang and Feng Shi, “support vector machines for predicting apoptosis proteins types”; Acta Biotheoretica (2005) 53: 39–47; Springer 2005.
- Ru-Ping Liang, Shu-Yun Huang, Shao-Ping Shi, Xing-Yu Sun, Sheng-Bao Suo, Jian-Ding Qiu:” A novel algorithm combining support vector machine with the discrete wavelet transform for the prediction of protein subcellular localization”; Computers in Biology and Medicine 42 (2012) 180–187.
- K.C. Chou and H.B. Shen, “Euk-Mploc: A Fusion Classifier for Large-Scale Eukaryotic Protein Subcellular Location Prediction by Incorporating Multiple Sites,” J. Proteome Research, vol. 6, no. 5, pp. 1728-1734, 2007.
- H.B. Shen and K.C. Chou, “Nuc-Ploc: A New Web-Server for Predicting Protein Subnuclear Localization by Fusing Pseaa Composition and Psepssm,” Protein Eng. Design and Selection,vol. 20, no. 11, pp. 561-567, 2007.
- K.C. Chou and H.B. Shen, “Large-Scale Plant Protein Subcellular Location Prediction,” J. Cellular Biochemistry, vol. 100, no. 3, pp. 665-678, 2007.
- H.B. Shen and K.C. Chou, “Gpos-Ploc: An Ensemble Classifier for Predicting Subcellular Localization of Gram-Positive Bacterial Proteins,” Protein Eng. Design Selection, vol. 20, no. 1, pp. 39-46, 2007.
- P.S. Banerjee, J.Palchoudhury, S.R. Bhadra Choudhury, “Fuzzy membership function as a Trust Based AODV for MANET”, I.J. Computer Network and Information Security,2013,12,27-34.
- M. Barman, J Palchoudhury, S. Biswas,”A Framework for the Neuro Fuzzy Rule Base System in the diagonosis of heart disease”, International journal of Scientific and Engineering Research,vol-4,Issue 11,November 2013.
- M. Barman, J Palchoudhury, “A Framework for Selection of Membership Function Using Fuzzy Rule Base System for the Diagnosis of Heart Disease”,I.J. Information Technology and Computer Science, vol 5, no. 11,October 2013,pages 62-70..
- UCI machine learning repository,: http://archive.ics.uci.edu/ml.
