A Comprehensive Study on the Development of Forms and Models of Private Education in the People’s Republic of China from 2010 to 2014

Author: Ahmed Alduais, Guoyuan Sang, Meng Deng
Journal: Science, Education and Innovations in the Context of Modern Problems @imcra
Article in issue: 5 vol.8, 2025.
Free access
This paper is based on the median analysis of the data of the Census Bureau for the years 2010-2014. Referring to the 2010-2020 Education Reform and Development Plan, it aimed to investigate the development of special education in the People's Republic of China from 2010 to 2014. By examining the data on the total number of students with special education needs by school, class, graduates and applicants at 5-year intervals; our results showed that there was a significant improvement over the five years, which was compared at the p<.05 level (p = 0.000). However, a number of shortcomings still exist, represented by the imbalance between registered female and male students with special education needs, the uneven distribution of schools between rural and urban areas, and the large gap between the number of G-1 primary school special education students and the number of G-3 secondary school special education students.
Special education, educational development, education reform, special educational needs
Short address: https://sciup.org/16010715
IDR: 16010715 | DOI: 10.56334/sei/8.5.68
Text of the scientific article A Comprehensive Study on the Development of Forms and Models of Private Education in the People’s Republic of China from 2010 to 2014
; RESEARCH ; ARTICLE A Comprehensive Study on the Development of Forms and Models of Private Education in the People’s Republic of China from 2010 to 2014 Ahmed Alduais Doctor Faculty of Education, Beijing Normal University (BNU) Beijing, China, People's Republic of China (PRC) Email: Guoyuan Sang Doctor Institute of Teacher Education Faculty of Education Beijing, China, People's Republic of China (PRC) Email: Meng Deng / / / / Doctor Institute of Teacher Education Faculty of Education Beijing, China, People's Republic of China (PRC) Email: X Doi Serial Keywords special education; educational development; education reform; special educational needs Abstract This paper is based on the median analysis of the data of the Census Bureau for the years 2010-2014. Referring to the 2010-2020 Education Reform and Development Plan, it aimed to investigate the development of special education in the People's Republic of China from 2010 to 2014. By examining the data on the total number of students with special education needs by school, class, graduates and applicants at 5-year intervals; our results showed that there was a significant improvement over the five years, which was compared at the p<.05 level (p = 0.000). However, a number of shortcomings still exist, represented by the imbalance between registered female and male students with special education needs, the uneven distribution of schools between rural and urban areas, and the large gap between the number of G-1 primary school special education students and the number of G-3 secondary school special education students. Citation Alduais A., Guoyuan S., Meng D. (2025). A Comprehensive Study on the Development of Forms and Models of Private Education in the People’s Republic. Science, Education and Innovations in the Context ofModern Problems, 8(5), 658-673; doi:10.56352/sei/8.5.68. / / / / / / / / / / / / / / / / / / / / / / / / / / / / / / / / / / / / / / / / / / / / / / / / / / / / / / / / / / / / / / / / / / / / / / / / / / / / / / Licensed © 2025 The Author(s). Published by Science, Education and Innovations in the context of modern problems (SEI) by IMCRA - International Meetings and Journals Research Association (Azerbaijan). This is an open access article under the CC BY license . Received: 15.11.2024 Accepted: 19.03.2025 Published: 20.05.2025 (available online)
The People’s Republic of China (PRC) has been moving towards an educational reform, as stated in the goals of the Medium and Long-Term Education Reform and Development Plan Outline for 2010–2020, in which ‘the Government of China has established a strategic vision of creating a lifelong learning society and promoting equity and quality at all levels of education’ (UNESCO, 2013, p. 9). It is the dream of the nation to move towards ‘becoming a moderately prosperous society by 2020’ (ibid, p. 1).
According to Deng (2003) and Deng & Guo (2007), since the 1980s there have been attempts to improve special education services in China through inclusion, mainly Learning in Regular Classes (LRC). This promising strategy needs periodic improvement and assessment. Furthermore, Deng, Poon-McBrayer, & Fransworth (2001) believe that the special education in China has undergone positive development into a workable initiative. Multiple factors have considerably affected the development of special education in China since the 1980s : economic conditions, Confucian tradition, Western cultural influences and Socialist ideology prevailing.
The LRC model was introduced by Deng and Pei (2009) as ‘the main strategy to universalize compulsory education for children with special educational needs in China after the 1980s’ (p. 317). This positive view of special education in the PRC is further examined in relation to the required reforms of the LRC model, (Deng & McBrayer, 2012). The noticeable achievement of the LRC and the required implementation steps can be summarised in terms of strengths and weaknesses: education service delivery, school structure, administrative monitoring mechanism and instructional practices for former; inadequate resources, personal preparation, support at the local level and fundamental changes to the examination oriented mainstream education system, for the latter.
In comparison, this picture of special education development in the PRC is not as positively interpreted by outsider researchers. Among the research conducted regarding special education is that of Kritzer (2011; 2012; 2014), who assumes that the current status of special education in China is similar to that in the United States (US) ‘prior to the implementation of the Education for all Handicapped Children Act of 1975’ (2012, p. 57). Kritzer further states that the fast economic growth and success of the PRC is not reflected in the level of progress of special education (ibid, 2012). Kritzer compared special education services in four countries in terms of comprehensiveness, and of these used United States (US) services as the standard model for comparison. The results showed the following ranking for the four countries: (i.e. based on the number of provided services for learners with special educational needs including classes, number of the students in the classes, etc.). They ranked the US as the most comprehensive one, followed by Thailand, China and then India. This difference between the US and the PRC which was significant in Kritzer’s (2012) in terms of special education services seems to be justified by cultural, historical and social differences between the two countries according to Worrell and Taber (2009). They state ‘although there are differences in the timeline of the development of Special Education in China and America, there are many similarities’ and ‘there are compulsory education laws in both countries and both governments make an effort to see that these laws are enforced’ (p. 139).
According to Malinen, Savolainen, & Xu (2012), the development of special education could be also affected by the attitude of teachers themselves, particularly the tendency to uphold inclusive education. They examined this—using the Teacher Efficacy for Inclusive Practices scale (TEIP), which included three variables: efficacy of inclusive education, efficacy in collaboration, and efficacy in managing behaviour. Based on this, the authors believe ‘future pre- and in-service teacher education programs should emphasize developing teachers’ self-efficacy, particularly collaboration skills’ (p. 532). Pang (2010) reviewed education laws in the PRC in comparison with the special education services provided in the US; however, the latter was not held as an ideal. The reviewed educational laws included: Compulsory Education Law (CEL 1986), Compulsory Education Law-Revised (2006), Education Law for the Disabled (1994), People’s Republic Law for the Disabled (1990), Law for the Disabled (1994), Regulations on the Vocational Opportunities for the Disabled (2007) and Development Guideline for the Disabled (2006-2010).
With reference to the above reported research about special education development in the PRC, we intended to examine the development of special education since the execution of the national development plan and for this reason we selected to include the data for 5 years (2010-2014) since the data for the rest years had not been published in public when the study was conducted in October 2016. We emphasise on this on the discussion part to see to what extent our findings are different or similar to the existing problems of special education before 2010. This will give an initial indication about the realisation of the national plan 2010-2020 of education development in China in general and special education in particular. Above all and since we referred to special education development considering insider researchers and outsider researchers, this will be also an addition to the views of outsider researcher on special education development in the PRC (L. Chen, B. Zhong, J. Xu, R.-Z. Li, C.-L. Cao (2016).
Having that said, we propose that the level of special education development between 2010 and 2014 did not contribute to reaching the long-term plan of educational reform and development in the PRC (i.e. referring to the 2010-2020 Development and Reform Plan). Given that we will conduct a statistical analysis for the census bureau data of special education between 2010 and 2014 in the PRC, this would give us an indication for the dream of the PRC towards ‘becoming a moderately prosperous society by 2020’ (UNESCO, 2013, p. 1) of which education in general and special education in particular are major parts of this reform and development plan. Thus, the key hypotheses of this study are:
H 0 : There will be no statistically significant difference between the total number of special education schools, classes, entrants, graduates and enrolled students between 2010 and 2014 at a 5-year intervals; H A : There will be…
H 0 : There will be no a statistically significant difference in the total numbers of enrolled male and female students between 2010 and 2014 at a 5-year interval; H A : There will be…
H 0 : There will be no a statistically significant difference in the total number of schools in urban and rural areas between 2010 and 2012 at a 3-year interval; H A : There will be…
H 0 : There will be no a statistically significant difference in the number of the primary school G-1 and the senior secondary school G-3 enrolled students between 2010 and 2014 at a 5-year interval; H A : There will be… .
MethodSample
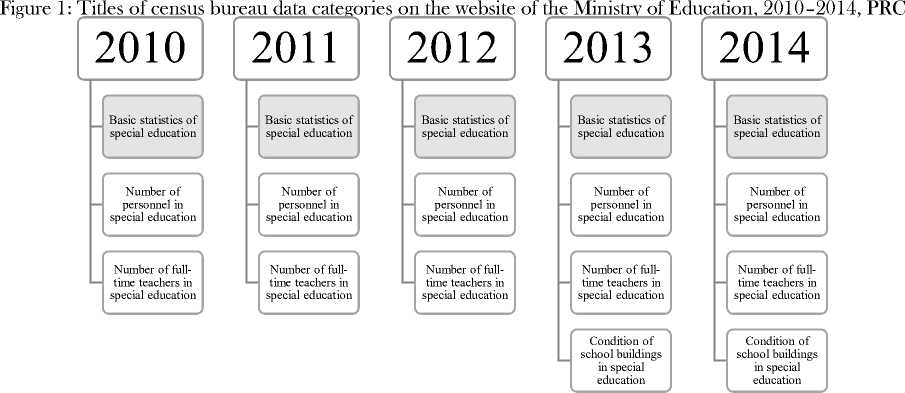
The population of interest in our study is learners with special educational needs. However, we used the database available on the Ministry of Education website for the years 2010, 2011, 2012, 2013 and 2014. The data provided on the website is divided into three sections for the first 3 years and five sections for the last 2 years (see Figure 1 below). Since our aim was to statistically examine the available data to determine an indicator for the development of special education between 2010 and 2014, we used only the basic statistics profiles for each year.
With this in mind, we propose that our results are only indicators for the level of development of special education in the PRC between 2010 and 2014 and thus cannot be generalised and/or used to refer to the overall quality of special education as our tested hypotheses are purely quantitative and direct contact with the special education environment did not take place.
Measures
This study used unobtrusive measures; secondary analysis of census bureau data was the main approach for examining our proposed hypotheses regarding special education development in the PRC between 2010 and 2014. The raw data were presented differently in 2010–2012 and 2013–214. While the areas of special education and school level were used as bases for the total numbers of special education schools, classes, graduates, entrants, enrolment (i.e., Primary School G1-6, Junior Secondary School G-1-3 and Senior Secondary School G-1-3) in the first period (i.e. 2010-2012), region-based statistics were used in the second period (i.e. 2013-2014) (e.g., Beijing, Shanghai). Besides, the total number of female students was also included for all the five years period. Additionally, the total number of schools in urban as compared with rural areas was integrated as well. The table below illustrates the presentation of the census bureau data retrieved from the website.
Table 1: Presentation census bureau data available on the website of the Ministry of Education, 2010–2014, PRC
Year Presentation of special education statistics
|
Criterion |
Details Sub-details |
|
2010 Educational system |
Primary School |
|
Junior Secondary School |
|
|
Senior Secondary School |
|
|
Vocational and technical schools |
|
|
Types of disorders |
Visual impairment |
|
Hearing impairment |
|
|
Intellectual disability |
|
|
Other disability |
|
|
Urban vs. rural areas |
Urban areas |
|
County seats and towns |
|
|
Rural areas |
|
|
Gender |
Female and Male |
|
2011 |
Educational system |
Primary School |
|
Junior Secondary School |
||
|
Senior Secondary School |
||
|
Vocational and technical schools |
||
|
Types of disorders |
Visual impairment |
|
|
Hearing impairment |
||
|
Intellectual disability |
||
|
Minority students |
||
|
Other disability |
||
|
Urban vs. rural areas |
Urban areas |
|
|
County seats and towns |
||
|
Rural areas |
||
|
Transitional schools Urban-rural transitional areas |
||
|
County-town transitional areas |
||
|
Gender |
Female and Male |
|
|
2012 |
Educational system |
Primary School |
|
Junior Secondary School |
||
|
Senior Secondary School |
||
|
Vocational and technical schools |
||
|
Types of disorders |
Visual impairment |
|
|
Hearing impairment |
||
|
Intellectual disability |
||
|
Minority students |
||
|
Other disability |
||
|
Urban vs. rural areas |
Urban areas |
|
|
County seats and towns |
||
|
Rural areas |
||
|
Transitional schools Urban-rural transitional areas |
||
|
County-town transitional areas |
||
|
Gender |
Female and Male |
|
|
2013 |
Regions |
Region-based statistics |
|
Gender |
Female and Male |
|
|
2014 |
Regions |
Region-based statistics |
|
Gender |
Female and Male |
Design
A non-experimental design was used in this study. In notational form, it can be depicted as:
XO
XO
XO
XO
XO where:
X= the unobtrusive measure (i.e., census data for 5 years)
O= special education in the PRC between 2010–2014
Lines= each line stands for 1 year: 2010, 2011, 2012, 2013 and 2014
The main assumption for this design is that there will be a statistically significant difference over the 5 years, especially in 2010 and 2014. The total number of schools, classes, entrants, enrolled students and graduates would be significantly different in 2014 as compared with 2010.
Procedure
The data were retrieved on December 20, 2016 from the website of the Ministry of Education, PRC
. The available data are for 5 years, from 2010 to 2014.
Data from the census are presented in tables, reflecting the total number of special education schools, classes, graduates, entrants, and enrolled students in terms of either the special education area (e.g. visual impairment), school level (e.g. primary school), or region (e.g. Beijing). Detailed numbers were also provided for each grade level of the enrolled students, the female students, the urban versus the rural areas and the transitional schools as well (i.e. from urban to rural or vice versa).
The total number of schools, classes, graduates, entrants, enrolled students, gender differences and schools in rural vs. urban areas including county-town areas were considered as comparable variables for measuring the special education development in the PRC between 2010 and 2014, taking into consideration that in addition to the noticeable rise of the total number of these in following year, there will be an additional, considerable difference between the years 2010 and 2014.
Results
We retrieved census bureau data about special education in the PRC over 5 years, 2010 –2014. Our selected data were restricted to basic statistics of special education schools, classes, graduates, entrants, enrolment, gender, urban and rural areas. Minitab (17), a descriptive and inferential statistical tool, was used to analyse the data. To increase the validity and reliability of our analysis, we first conducted a descriptive statistical analysis of the total numbers as per illustrated in table 3.
Table 2: Descriptive statistics for the examined special education variables between 2010 and 2014
|
Variable |
Mean |
SD |
Minimum |
Maximum |
Range |
|
Schools |
1851.8 |
119.4 |
1706.0 |
2000.0 |
294.0 |
|
Classes |
17950 |
1460 |
16263 |
19894 |
3631 |
|
Graduates |
50299 |
5401 |
44194 |
58941 |
14747 |
|
Entrants |
66269 |
2593 |
64086 |
70713 |
6627 |
|
Enrolled |
342322 |
114979 |
140408 |
425613 |
285205 |
|
Male |
255300 |
16559 |
235580 |
278356 |
42776 |
|
Female |
137917 |
6004 |
132532 |
147257 |
14725 |
|
Urban |
860.7 |
96.3 |
750.0 |
925.0 |
175.0 |
|
County seats and towns |
821.3 |
48.2 |
771.0 |
867.0 |
96.0 |
|
Rural |
93.33 |
7.51 |
89.00 |
102.00 |
13.00 |
|
Urban-rural transitional |
87.7 |
75.9 |
0.0 |
133.0 |
133.0 |
|
County-town transitional |
182.3 |
158.2 |
0.0 |
283.0 |
283.0 |
|
Primary-Grade 1 |
47196 |
1361 |
45138 |
48570 |
3432 |
Figure 2: Probability plots for the examined special education variables between 2010 and 2014
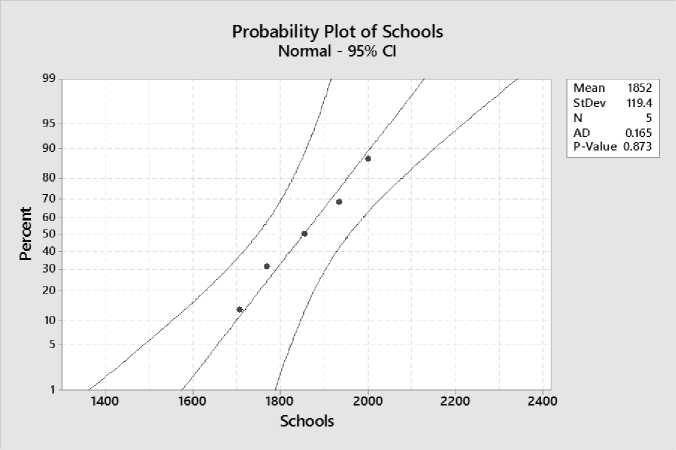
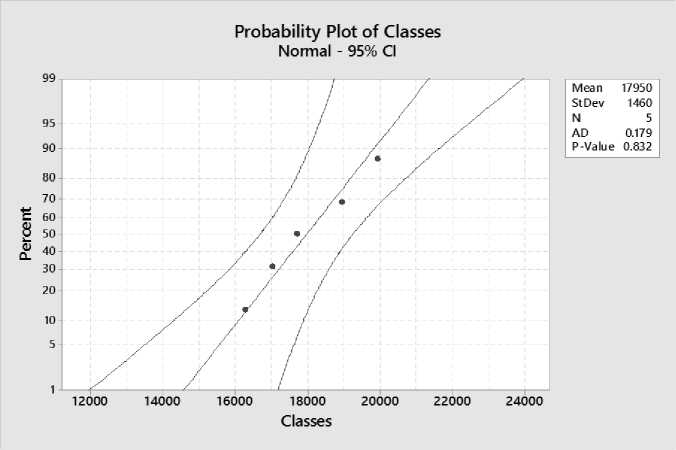
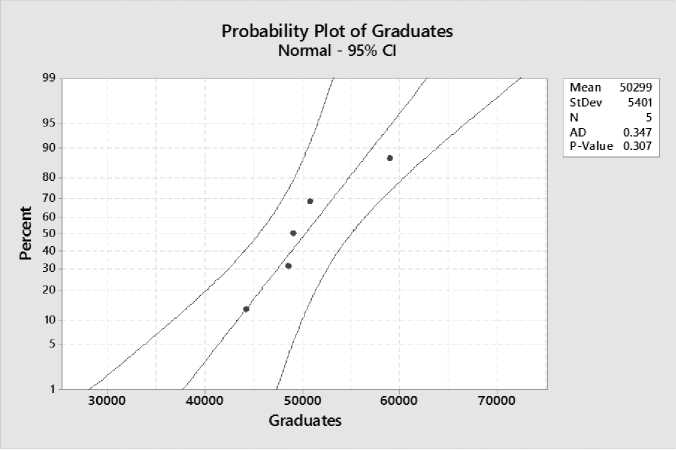
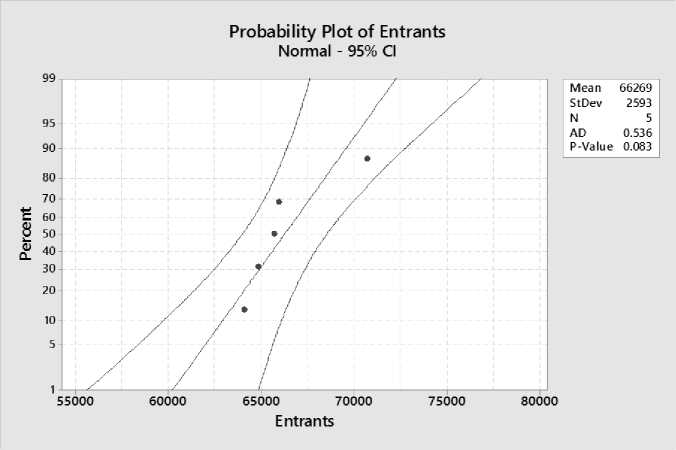
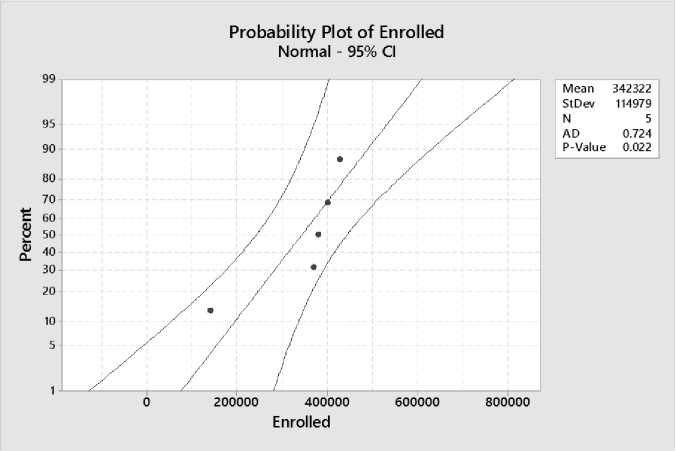
Having confirmed that our prediction could lead to plausible findings (i.e. referring to table 3 where the range columns is indicating calculated differences in the measured variables for special education development in the PRC between 2010 and 2014), we then went further to measure the distribution of the census among the 5 years that were compared. To achieve this, probability plots were generated comparing the normality of the distribution of the total numbers of schools, classes, graduates, entrants and enrolled students with special educational needs in the PRC between 2010 and 2014 at a 5-year interval. Therefore, the normal distribution appears to fit the sample data fairly well, and the inserted data can be used to estimate differences and determine the development of special education at a 5-year interval. It seems that the gradual increase in these factors, except that for the enrolled students, indicates development in special education in the PRC between 2010 and 2014.
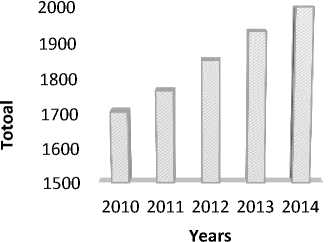
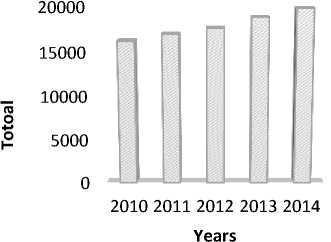
To clarify the differences over the 5 years in terms of special education development, we generated a bar chart for each variable (Figure 3 a-d).
Figure 3 (A-D): Special education schools, classes, graduates and entrants between 2010–2014
о о
2010 2011 2012 2013 2014
о о
2010 2011 2012 2013 2014
Years
Years
Figure (3A) illustrates the number of special education schools in the PRC between the years 2010 and 2014 at a 5-year interval. As can be seen from the bar chart, the number of special education schools increased gradually from 1706 in 2010 to 2000 schools in 2014. Overall, this significant increase in the number of special education schools between 2010 and 2014 is an initial indication of the development of special education in the PRC in the same period.
Figure (3B) shows the number of special education classes in the PRC between the years 2010 and 2014 at a 5-year interval. It is clear from the presented data that the number of special education classes increased from 16263 in 2010 to over 19800 classes. This represents increase in enrolment opportunities over this period of time for students with special needs. Additionally, this may also provide a possible opportunity for development of the quality of special education by decreasing the number of students in the classes owing to the increased number of available classes.
Figure (3C) demonstrates the number of special education graduates in the PRC between the years 2010 and 2014 at a 5-year interval. There is a clear fluctuation in the number of graduates with special educational needs. The largest number of graduates was over 58,900 in the year 2010. Conversely, the lowest number of graduates was that in the year 2011, with less than 45,000. While the difference between the total number of graduates in the years 2010 and
2014 might indicate a policy towards improving the quality of special education, it could also indicate school dropout by students with special educational needs due to unknown reasons, which are out of the scope of this paper.
Figure (3D) compares the number of special education entrants in the PRC between the years 2010 and 2014 at a 5-year interval. As shown above, the number of entrants clearly peaked in 2014, as compared with those in 2010, and there were insignificant increases in the number of entrants in 2011, 2012 and 2013. The difference between the number of entrants in 2010 and 2014 is approximately 6000 in favour of the latter. In general, this indicates positive progress toward achieving the goals of the government of the PRC to achieve education for all, including those learners with special educational needs.
Figure 4: Special education enrolment in the PRC at a 5-year interval, 2010-2014
380000 ra
2010 2011 2012 2013 2014
Years
Figure 4 shows the enrolment of special education students in the PRC between the years 2010 and 2014 at a 5-year interval. We can see that the number of enrolled students with special educational needs dramatically decreased between the years 2010 and 2013, with a difference of about 6000 students in favour of the former. With this in mind, we can also see that this number gradually increased from this low to reach over 39,000 students. There is a high possibility that there was major conflict during the first year of the application of the 2010–2020 plan of improving education, which had a high enrolment. This perhaps led the PRC government to decrease the number of enrolment to avoid the problems faced during the first year. Having minimised such problems, the policy of education for all was restarted in 2014, where the number of enrolled students with special educational needs was satisfactorily higher than those in the previous 3 years (2011, 2012 and 2013) and where the total number of enrolled students remained levelled (i.e. this particular point is examined further in the discussion section).
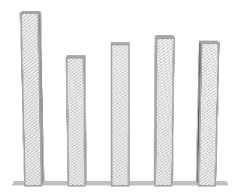
Figure 5: Distribution of the number of schools, classes, graduates and entrants in special education in the PRC between 2010 and 2014 at a 5-year interval
Distribution of the number of special education schools, classes, graduates and entrants
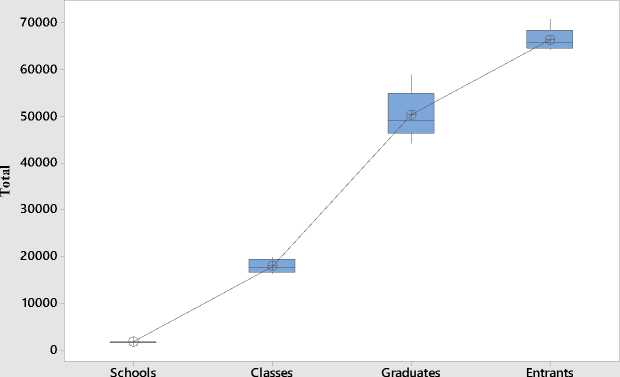
We also predicted that the development of special education in the PRC between 2010 and 2014 could be illustrated statistically under the assumption that establishing more special educational schools leads to more classes. This in turn leads to more graduates and entrants. Figure 5 depicts in comparison the distribution and variability of the number of schools, classes, graduates and entrants in special education in the PRC between 2010 and 2014 at a 5-year interval. We can see that there was a normal distribution and variability, where establishing several schools is the lowest level. This in turn led to a higher number of classes. The increased number of classes resulted in a larger number of graduates and entrants. It seems logical that the number of entrants is represented at the highest level, as it is not required for all entrants to graduate in the same year as compared with being enrolled in the same year.
Figure 6: Development of special education in the PRC between 2010 and 2014 through significance and interaction among the total number of schools, classes, graduates and entrants
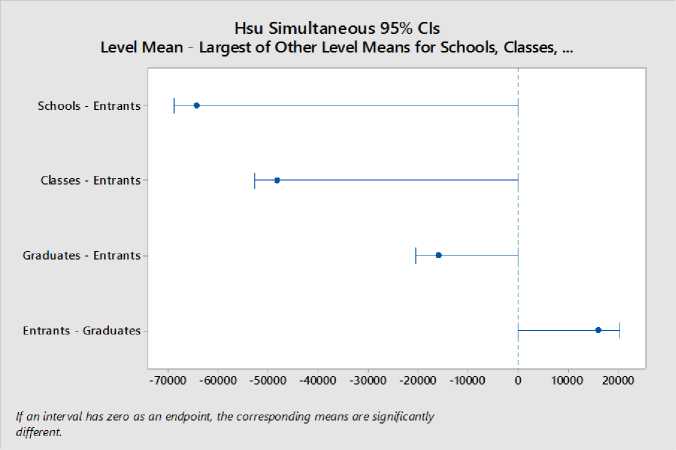
To further examine the development of special education in the PRC between 2010 and 2014 at a 5-year interval in terms of total number of schools, classes, graduates and entrants of learners with special educational needs, we conducted a one-way ANOVA between subjects. There was a significant development during the 5 years that were compared (p = 0.000). Post-hoc comparisons using the Hsu test indicated that the mean score for the total number of schools during this period is (M = 1851.8, SD = 119.4) as compared with the higher number of classes (M= 17950, SD = 1460). However, the mean of the total number of graduates is (M= 50299, SD= 5401) as compared with the higher number of entrants (M: 66269, SD: 2593). Taken together, these results suggest that there was a minor yet significant development in special education in the PRC in terms of the total number of schools, classes, graduates and entrants. Specifically, our results suggest that when there was an increase in the number of special education schools and thus number of classes, this led to increasing the number of entrants and graduates. However, it should be noted that there must be a greater increase the number of special education schools to see a more significant development in special education. It should be noted that the quality of this increase and development is out of the scope of our tested variables here and the paper as well.
Figure 7: Total number of female and male enrolled students in special education between 2010 and 2014
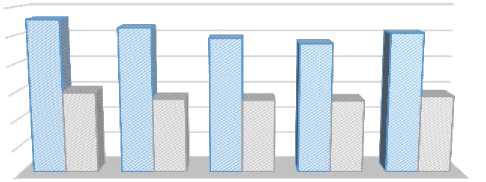
2010 2011 2012 2013 2014
Male Female
Another variable of the special education development in the PRC between 2010 and 2014 is gender. Figure 7 is a comparison between the number of female and male special education students in the PRC between 2010 and 2014 at a 5-year interval. It shows that the number of male students with special educational needs gradually decreased between the years 2011, 2012 and 2013 in favour of the former (i.e. 2010). This number experienced an increase in 2014 to reach a level close to that in 2010. This situation applies also to the number of female students, which slightly decreased during the years 2011, 2012 and 2013. Similar to the male students, this number recovered in the year 2014. In contrast, the number of the male students with special educational needs is significantly higher than the number of the female students with special educational needs during the 5 years that were compared. Overall, there seems to be two male students for each female student. This indicates that either the total number of females in the PRC, in general, is lower than that of the males, or that the tendency towards education is more negative for female students (i.e. See the discussion section where we have tried to relate this to population census in terms of gender difference).
Figure 8: Comparison of enrolled female and male students in special education between 2010 and 2014
Comparison of femal and male number of special education enrollment
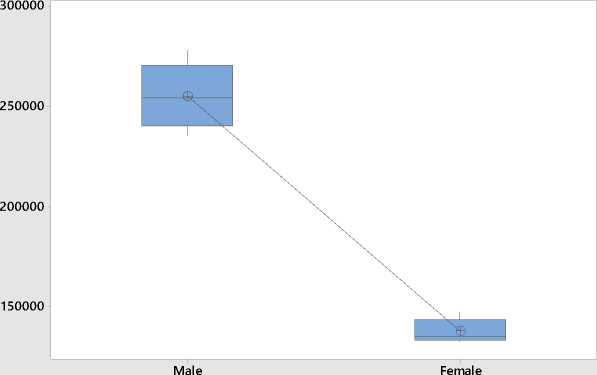
Additionally, to examine the significance between these two values, we performed a two-way ANOVA on the total number of enrolled female and male students with special educational needs for each of the 5 years that were compared (2010–2014) to examine the gender significance, i.e., the intensity of male students. There was a significant difference between total number of enrolled male and female students, ( F = 4.64, p = .000). This was supported by the mean for enrolled male students (M= 255300, SD= 16559) in comparison with the mean for the total number of enrolled female students (M= 137917, SD= 6004), which clearly indicates that there seems to be no balance between the enrolled number of male and female students with special educational needs in the PRC between the years 2010 and 2014.
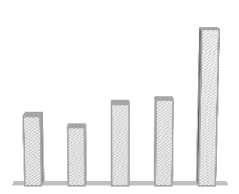
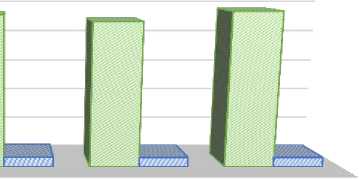
Figure 9: Special education schools in rural versus urban areas in the PRC between 2010 and 2014
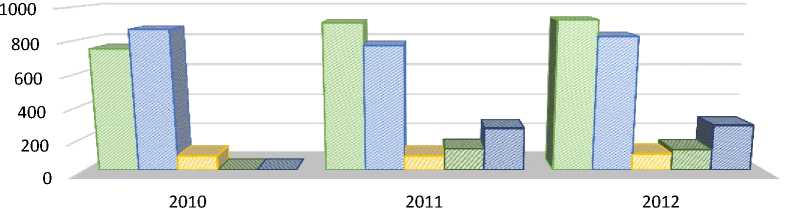
Urban County seats and towns Rural Urban-rural transitional County-town transitional
An additional variable is the distribution of special education schools in urban and rural areas in the PRC between the years 2010 and 2014. However, it should be noted that only the data for 3 years are available in the website. Figure 9 shows the distribution of special education schools in rural versus urban areas in the PRC between 2010 and 2012 at a 3-year interval. As illustrated by the above bar chart, the number of special education schools in the urban area, county-seats and towns is much higher than that in the rural areas. More importantly, while the number of schools in the urban areas was less than that in the county seats and towns in the year 2010, it increased in the following years to become slightly higher than those in the country-seats and towns in the years 2011 and 2012. The number of special education schools in rural areas levelled off during the years 2010 and 2011, but gradually increased in the year 2012 (102 schools) as compared with only (89) schools in 2010 and the same number in 2011.
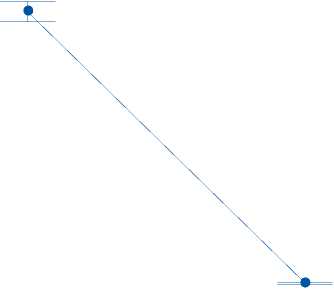
Figure 10: Special education schools in rural versus urban areas in the PRC between 2010 and 2014
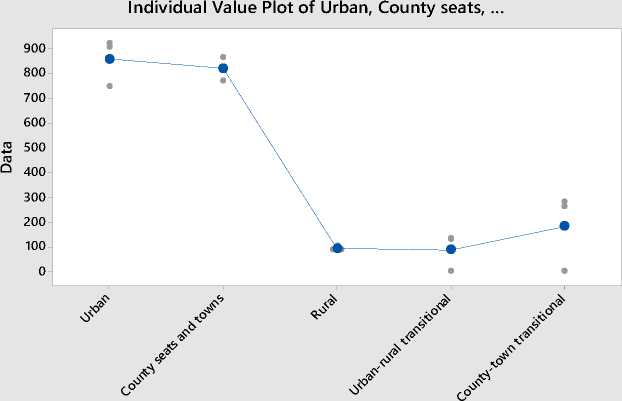
Factor N Mean Grouping
Urban 3 860.7A
County seats and towns 3 821.3A
County-town transitional 3 182.3B
Rural 3 93.33B
Urban-rural transitional 3 87.7
Means that do not share a letter are significantly different.
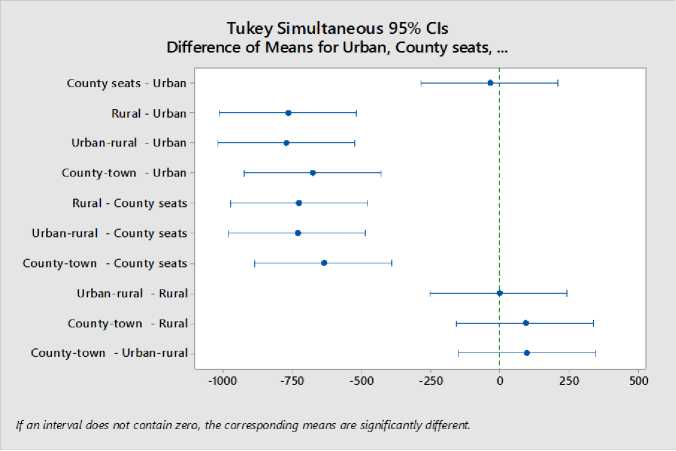
Moreover, we completed a one-way between subject ANOVA to examine the effect of the difference between the total number of special education schools in the rural and urban areas in the PRC on the comprehensive development of special education between 2010 and 2012 at a 3-year interval. There is a significant difference between the number of the schools (p = 0.000). Post-hoc comparisons using the Tukey test indicated that the mean score for the total number of schools in the urban areas is (M = 860.7, SD = 96.3) as compared with that in the rural areas (M= 93.33, SD = 7.51). Additionally, the mean for the special educational schools in the county-seats and towns is (M= 821.3, SD= 48.2). Moreover, the mean of the total number of special education schools in terms of transition is (M= 182.3, SD= 158.2) for the county-town transitional schools as compared with the urban-rural transitional (M= 87.7, SD= 75.9). Taken together and regarding the above interval plot, these results propose that the minor yet significant realised development of special education in the PRC based on the analysed data in terms of the total number of schools, classes, graduates and entrants shows unbalanced distribution for the number of schools between the rural and urban areas regardless of any claim that the intensity of the population is higher in the case of the latter. Specifically, and with reference to the line plot (Figure 10) 1 , our results assume that there was an immense difference between the number of special education schools in the urban and county-seats and towns, which are shown as the highest level in the line plot as compared with the lowest levels: rural, urban-rural transition and countytown transition.
1 17 ???
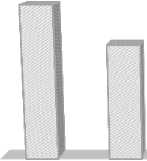
Figure 11: Enrolment in G-1 primary school and G-3 senior secondary schools between 2010 and 2014
2010 2011
2012 2013 2014
Primary-Grade 1
Senior Secondary- Grade 3
In addition to the examined variables above, we also proposed that there will be a significant statistical difference in the number of G-1 primary and G-3 senior secondary school students. Figure 18 shows the comparison of the number of enrolled G-1 primary school special education students and G-3 senior school students in the PRC between the years 2010 and 2014 at a 5-year interval. As depicted in the bar chart, the total number of G-1 primary students fluctuated between over 45,000 and 48,000 students. This is also applicable to the number of G-3 senior secondary school students, which levelled off to less than 3000 students—except for the year 2012, where it increased to over 3100 students. It seems that there were 16 G-1 students for every G-3 student, except in the years 2012 and 2013, where this number gradually decreased to 15 G-1 (i.e. primary school) students for each G-3 (senior high school) student.
Figure 12: Enrolment in G-1 primary school and G-3 senior secondary school between 2010 and 2014
Interval Plot of first primary school and third senior secondary school enrollment 95% CI for the Mean
Primary-Grade 1
Senior Secondary- Grade 3
Individual standard deviations are used to calculate the intervals.
Further, a one-way ANOVA was run to examine the difference between the total numbers of the enrolled G-1 and G-3 special education students in the PRC between the years 2010 and 2014 at a 5-year interval. There is a significant difference between the two groups (p= 0.000). Post-hoc comparisons indicated that the mean score for the total number of G-1 primary school students is (M = 47196, SD = 1361) as compared with that of G-3 of the senior secondary schools (M= 2968.4, SD = 125.3).
Discussion
The results of this study were partially contrary to our initial predictions. Though the first two alternative hypotheses did not hold true for all subgroups, the last two were totally accepted. First, the prediction of a significant development of special education in the PRC that could be measured through the total numbers of schools, classes, graduates, entrants and enrolled students was validated for the subgroups of schools, classes and entrants, but not graduates and enrolled students. Second, there was a statistically significant difference between the number of male and female students in terms of enrolment. Third, the distribution of special education schools showed a significant difference in favour of the urban areas. Last but not least, the difference in the primary school enrolled students in G-1 and the senior secondary school in G-3 is also highly statistically significant.
There are four possible interpretations of such outcomes. First, there seems to be a clear tendency towards achieving the 2010–2020 plan regarding development of education in the PRC including special education and inclusion issues. The number of schools reflected a strategy to establish more special education classes as well. This outcome confirms that the basic special education learning environment was achieved (i.e. this infer is based on the realised statistical differences among the five compared years in terms of special education schools, classes, enrolment, etc.) and was different between 2010 and 2014. Additionally, the results regarding the graduates and enrolment also support the previous inference that there was a focused strategy by the PRC government to continue implementing the 2010–2020 plan of educational reform and development. The strategy of enrolling many students with special learning needs in the year 2010 was concurrent with many graduates in the same year—possibly indicating the start of the experimental stage of the educational development and reform. Moreover, the noticeable decrease in the number of both enrolled and graduated students with special educational needs in the year 2014 might be supporting evidence for this point. The focus of educational development seems to be moving from quantity and inclusion towards quantity, inclusion and quality. Clear evidence for this inference is found in the number of entrants which continued to increasee — accompanied by selective enrolment and criterion-based graduation.
In the second case, the assumption that there is a significant difference between men and women in terms of population in the PRC, thus resulting in a larger number of enrolled male students in the special education schools would match our results. However, (UNESCO, 2013) shows that the population difference between men and women is only 3.8% in favour of men. Moreover, there is no significant difference in the literacy rate between men and women, though it is 3% greater in the case of men. We also did not discover any statistics marking the difference between male and female students with special educational needs. With this in mind, we assumed that there might be social and/or psychological factors causing female learners with special educational needs to avoid school enrolment, thus preferring other forms of education (non-governmental schools), or private education (homeschooling), or zero education, owing to an inability to afford any of the previous two options and to appear in public school for social and psychological factors.
In the third case, we proposed that the reason behind the outcome is that the demographic distribution of the population might be much larger in urban areas, including county and town areas. In (UNESCO, 2013), it is stated in the key socio-economic indicators that the difference between the total population in urban and rural areas is only 4.4% of the total population in favour of the rural areas — indicating that more population is located in the rural areas. However, over 18% of the total population in the rural areas includes domestic migrants, which moderately increases the total population in the urban areas. Taken together, the significant difference between the numbers of special education schools in the compared years remains an arguable issue in our findings—suggesting less enrolment, entrants of learners with special educational needs and/or avoidance or negligence of education in rural areas. Additionally, our findings did not support the conclusion that the greater total number of learners with special educational needs in the urban areas resulted in establishing more special education schools in these areas.
In the fourth case, we predicted that the number of learners with special educational needs will increase between 2010 and 2014, reaching a significant difference in the year 2014. The range remained the same as there was only one senior secondary school G-3 student for each 15/16 G-1 primary student. There seems to be no clear finding or prediction for the reason behind this difference. If it had been related to quality and assurance, then we assume at least a minor difference would have been noticed among the 5 years that were compared. Alternatively, perhaps this consistency was owing to positive attitudes regarding primary school and junior secondary school attendance, with the expectation to dropout the last level; then, this would be another concern, possibly threating the effective development of special education in the PRC. We propose that both factors might be contributing to such an outcome, in addition to the fact that the compulsory education levels in the PRC do not include the senior secondary school level (Wang, 2007; 2009; Wang and Xing, 2016).
Given this, a number of implications could be possibly inferred out of these outcomes and their possible interpretation. Among these is that the PRC government is attempting to towards more access of special education but there are still gaps mainly between urban and rural areas that could possibly decreased by issuing specific policies—providing more funds and preferences to underdeveloped yet developing areas. In this regard, several studies (e.g. UNESCO, 2007) (Regional Preparatory Workshop on Inclusive Education East Asia) have reported the efforts of the government towards providing access to and an improved quality of education to all. Among these efforts are those issuing regulations enforcing free special education for all disabled children and promoting a zero rejection strategy. This objective looks more or less like the objectives in the national plan 2010-2020—indicating repetition of same objectives without complete realisation of earlier objectives.
Conclusions
Regarding the 2010–2020 plan of educational reform and development in the PRC, we conducted a nonexperimental study measuring the development of special education in the PRC between 2010 and 2014. We used an unobtrusive measure, secondary analysis of census data retrieved from the PRC Ministry of Education website. Our analysis indicated significant yet minor development of special education in the PRC between 2010 and 2014. For example, there was a statistically significant difference between the number of schools in 2010 and 2014. Conversely, there was a large gap in the distribution of the schools in rural and urban areas, with fewer schools in the rural areas as compared with the large number of special education schools in the urban areas and towns.
