A Feasibility Study for Developing a Computerized Adaptive Version of Verbal Ability Test for Gulf Student

Author: Mohammed Al Ajmi, Siti Salina Mustakim, Samsilah Roslan, Rashid Almehrizi
Journal: International Journal of Education and Management Engineering @ijeme
Article in issue: 6 vol.14, 2024.
Free access
Employing Computerized Adaptive Testing (CAT) to evaluate verbal ability symptoms proves advantageous over traditional tests by delivering heightened measurement precision and reducing the testing burden. The CAT-Verbal Ability, developed from a large sample of 2689 participants in Gulf countries, underwent meticulous item bank development, ensuring unidimensionality, local independence, and investigating differential item functioning (DIF). The CAT-Verbal Ability item bank has high content validity, is unidimensional, locally independent, and does not have DIF; these outstanding psychometric qualities were confirmed by CAT simulations that were based on real data. With just 14 items needed, CAT simulations showed a high degree of measurement accuracy (r=0.73). In addition to being a psychometrically sound instrument, the proposed CAT-Verbal Ability demonstrated acceptable marginal reliability, criterion-related validity, sensitivity, and specificity. This makes it an efficient assessment method that reduces testing burden while maintaining information integrity, and it also saves time.
Computerized adaptive testing, verbal ability, item response theory, three-parameter logistic model, marginal reliability
Short address: https://sciup.org/15019553
IDR: 15019553 | DOI: 10.5815/ijeme.2024.06.04
Text of the scientific article A Feasibility Study for Developing a Computerized Adaptive Version of Verbal Ability Test for Gulf Student
The academic community has shown a keen interest in the development and implementation of psychometric measures for assessing various cognitive abilities and processes, particularly verbal ability [1,2]. Psychometricians and researchers have devoted significant efforts towards creating reliable and valid measures for assessing verbal abilities, which have been acknowledged as crucial determinants of academic and occupational success [3].
The study of verbal ability has been motivated by its strong ties to complex cognitive processes, such as problemsolving, critical thinking, and decision-making [4]. As such, it has garnered significant attention from the psychometric community, leading to the creation and refinement of various standardized tests and assessments [5]. Furthermore, the application of psychometric principles and techniques has greatly contributed to understanding the underlying constructs and components of verbal ability, providing valuable insights into its assessment and development [6].
Several verbal ability scales have been developed in the last few years, such as the California Verbal Learning Test (CVLT), Woodcock-Mueller Test of Cognitive Abilities (W-M-T), and Comprehensive Assessment of Verbal Ability and Quantitative Ability (CAVQA), Differential Ability Scales (DAS), Wechsler Intelligence Scale for Children (WISC-V) and the Gulf Multiple Mental Abilities Scale (GMMAS) [7]. These measures have constant lengths and were constructed using a classical test theory (CTT) paradigm [8]. As an illustration, the GMMAS verbal ability test has 30 questions that measure various aspects of verbal ability; students in fifth or sixth grade are required to answer all of these questions [9], but this would make the test more difficult and less motivating for students [10]. More importantly, the scales typically include items that represent different degrees of verbal skill. It is typical practice to ask respondents to answer each item on a test, which might lead to a large number of items that don't necessarily reflect their linguistic skills. This can make people feel like they have to put more effort into the assessment process and make the test last longer [11].
Currently, verbal ability is primarily assessed through a paper-based format, and the existing test for verbal ability is constructed based on classical test theory. However, this traditional approach may not be optimal for effectively measuring and evaluating verbal proficiency. Therefore, it is worthwhile to explore a novel method of evaluating verbal ability in school students, considering the implementation of Computerized Adaptive Testing (CAT).
Computerized Adaptive Testing (CAT-verbal ability) is a new and improved way to test verbal ability, and we hope that this study will help alleviate some of the problems already described. According to Alzayat et al [9], the items used to create the first CAT-verbal ability bank came from the Gulf Multiple Mental Abilities Scale (GMMAS). Following that, the three-parameter logistic model was compared using test-level and model-fit evaluations to the 1PL and 2PL models, which were both dichotomous scored IRT models. The objective was to find the best model that fit the CATverbal ability data. Then, numerous statistical analyses were used, such as DIF, item discrimination, item fit, local independence, and unidimensionality. The final CAT-verbal ability item bank was created in part by these analyses. Lastly, the proposed CAT-verbal ability was thoroughly tested using both CAT simulation and real data studies to investigate its predictive usefulness (sensitivity and specificity), convergent-related validity, and marginal reliability.
2. Methods 2.1 Participants
This research adopts a quantitative approach to investigate the statistical characteristics of the verbal ability assessment in the Gulf Multiple Mental Abilities Scale (GMMAS). The study adopts a descriptive design, using secondary data from the standardization process of the GMMAS by the Arab Office for the Gulf States in 2011. The study population comprises students in the fifth and sixth grades, aged between nine years and three months to twelve years and three months. The study employs a multistage cluster sampling technique, where representative samples are randomly selected from different student groups based on region, grade, and gender. The total sample size is 2689, including 1273 females and 1416 males, which is deemed appropriate for the 3PL model and the 30 items in the numerical ability test [20].
-
2.2 Measures
-
2.3 Construction of the CAT- Verbal Ability Item Bank
-
2.3.1 Unidimensionality
-
2.3.2 Parameter estimation
Based on the 2689 response data, item parameters were estimated by Expectation A Posteriori (EAP) method via BILOG-MG and the items in the EAP demonstrate predictive reliability [28].
-
2.3.3 Model selection
Alzayat et al [9] created the verbal ability test that is included in GMMAS, and this research makes use of it. The verbal, numerical, and spatial abilities are assessed in three parts of this measure. Thirty multiple-choice questions make up the verbal ability section of the test. Subtests evaluated here include verbal analogies (10 items), word antonyms (10 things), and synonyms (10 items). In the verbal analogies part of the test, students must find new terms that have similarities with the ones already given and then use those connections to solve the problems. The total possible score can be anything from 0 to 30, with 1 point given for each right answer and 0 for each wrong answer.
The reliability and validity of the scale were studied by Alzayat et al [9]. A mean raw score of 19.1 for fifth grade and 21.1 for sixth grade, with standard deviations of 6.2 and 5.7, respectively, indicate validity. It appears from descriptive statistics that kids' verbal proficiency improves as they gain experience through curriculum and age-related development, since there is a discernible uptick from fifth to sixth grade across all Gulf countries.
A favorable and somewhat significant association is demonstrated by the correlation coefficients among all verbal ability subtests, which vary from 0.589 to 0.621. This suggests that verbal ability is the target of these subtests. To back up the claim that the test is construct valid, Alzayat et al [9] find a positive and statistically significant correlation coefficient between the verbal ability test and the Raven successive matrices test. Furthermore, for fifth and sixth grade Arabic, there is a positive correlation coefficient between verbal ability and academic accomplishment, confirming the test's predictive value. The verbal ability test-retest coefficient is 0.98, suggesting very high stability over time, suggesting a high level of dependability. According to Alzayat et al [9], the verbal ability exam has a good level of internal consistency across all grades. For various Gulf countries, the Cronbach alpha coefficients range from 0.850 to 0.882.
To construct the CAT-Verbal Ability item bank, various statistical analyses were conducted using IRT. These analyses included assessing unidimensionality, local independence, item fit, and DIF.
The assumption of unidimensionality is crucial in Item Response Theory (IRT), as the precision of item parameter estimates and the validity of test score interpretations rely heavily on this assumption. Non-unidimensionality in a test can lead to confounding and impede result interpretability [21, 22].
In the assessment of the unidimensional model, exploratory and confirmatory factor analyses were employed to validate the unidimensional hypothesis. During exploratory analysis, two criteria were essential: first, the initial factor should explain a minimum of 20% of the test variance (Reckase, 1979 cited in [23]; second, the variance of the first to the second factor should be more than 4 [24]. Confirmatory factor analysis used the Root Mean Square of Residuals (RMSEA) and Tanaka Index (GFI) to evaluate model fit [25, 26, 27].
In IRT, choosing an appropriate model for data analysis is the premise to ensure the accuracy of data analysis results. In this study, the commonly used Akaike information criterion (AIC), Bayesian information criterion (BIC), -2 log-likelihood (-2LL), and Root Mean Square Posterior Standard Deviations (RMS), were used to determine which model fit best. The smaller these test-fit indices are, the better the model fit [29].
Under the IRT framework, the Rasch model, Two-Parameter Logistic Model (2PL), and Three-Parameter Logistic Model (3PL) represent distinct approaches to modeling the relationship between individuals' latent traits and their responses to test items. The Rasch model, the simplest of the three, posits an item difficulty, while the 2PL adds item discrimination. The 3PL extends the 2PL by adding a guessing parameter, accommodating situations where individuals might answer correctly by chance [30]. The 3PL is the most suitable form for multiple choice questions [31, 32].
-
2.3.4 Local independence
Local independence is a fundamental assumption in Item Response Theory (IRT) models, signifying that, as articulated by Hambleton and Swaminathan, the responses of individuals to test items of the same difficulty level should be statistically independent. This implies that an individual's answer to a specific item should not exert any negative or positive influence on their response to any other item [33]. The researcher employed Yen's Q3 statistic, a correlation coefficient between residuals for a pair of items, adjusting for the individual's ability (θ). The common practice is to apply a standard critical value of 0.2 for the absolute magnitude of Q3 [34]. (Chen & Thissen, 1997). To validate the assumption of local independence in the verbal ability test, the researcher utilized the Local Dependence Indices for Dichotomous Items (LDID) computer program.
-
2.3.5 Item fit
-
2.3.6 Person fit
-
2.3.7 Differential item functioning
The examination of Differential Item Functioning (DIF) is integral for constructing unbiased item banks, allowing for the assessment of item bias across various variables, such as gender [29]. In this study, the focus is on investigating whether the verbal ability items within the potential Computerized Adaptive Testing (CAT) bank exhibit differential functioning between males and females. The Mantel-Haenszel Chi-Square test, a widely utilized DIF procedure (Mantel & Haenszel, 1959), will be employed for the dichotomous case, assessed through the SPSS program [38]. This analysis involves a chi-square test comparing the item response distributions of matched males and females based on their latent trait levels. Additionally, the Likelihood Ratio Test will be utilized to identify gender based DIF [39]. The BILOG-MG3 software will be employed to estimate DIF, iteratively eliminating items exhibiting DIF until the test is free of such items.
-
2.4 CAT- Verbal Ability Simulated Study
-
2.4.1 Starting point, scoring algorithm, item selection algorithm, and stopping rule
-
2.4.2 Efficiency of CAT- Verbal Ability
The item-fit assessment was conducted to ascertain the compatibility of each item with the IRT model. The Excel program was employed for the item-fit test, relying on the Standardized Residuals (SRs) index, as outlined by Wright and Masters [35]. Standardized residuals, a key component of this statistical measure, offer the advantage of being less influenced by sample size compared to chi-square tests.
Assessing how well an individual's responses align with the assumptions of the IRT model is crucial [36]. To evaluate the fit of individuals to the three-parameter model, the unweighted Almehrizi index, as introduced by Almehrizi [37], was employed. This approach involves aggregating the squares of the residual differences across all items, providing a measure of the overall fit of a person to the model.
Following the establishment of the final item bank, a Computerized Adaptive Testing (CAT) simulation was conducted. Utilizing the parameters derived from the CAT-verbal ability real item bank, the performance of CAT-verbal ability was simulated across various ability levels to assess its feasibility, rationality, and the efficacy of its associated algorithm. All analyses were executed in R (Version 3.4.1) using the catR package for R Studio [40].
Following the procedural framework outlined by Li et al [29], Which is shown in Figure 1, the CAT process unfolds in four distinct steps: determining a starting point, estimating ability provisionally (thetas), selecting the next item through a specific algorithm, and applying a stopping rule. In the first step, the starting point is defined, where item selection hinges on the most informative item for an average ability level of zero, aligning with the conventional practice in real CAT assessments [18]. Subsequently, the second step involves utilizing a scoring algorithm, specifically employing the Expected A Posteriori (EAP) method due to its known advantages in reducing standard errors, simplicity, stability, and higher accuracy [41, 42]. The third step adopts the Maximum Fisher Information criterion (MFI) as the item selection algorithm, chosen for its simplicity and computational efficiency in enhancing measurement accuracy [41]. Finally, the critical decision in CAT design involves the stopping rule, with this study exploring based on standard error thresholds (SE ≤ .30, SE ≤ .35, SE ≤ .40, and SE ≤ .45.) to ensure varied levels of measurement precision across participants [ 16, 43].
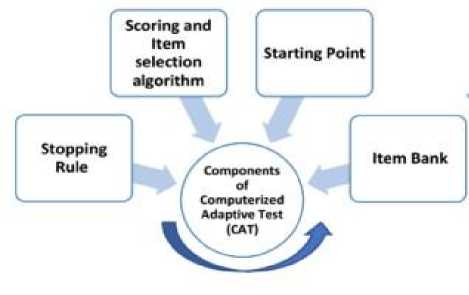
Fig. 1. The CAT development process
To evaluate the efficacy of CAT-Verbal Ability, an R program, utilizing the CAT R packages, will examine the estimation outcomes for simulated participants under various stopping rules. The investigation will encompass considerations of bias, root mean square error (RMSE), and the correlation coefficient between the true theta and the estimated theta in CAT-Verbal Ability. These analyses aim to comprehensively assess the performance of the associated algorithms. The criteria for gauging CAT effectiveness include determining that both bias and RMSE are below 0.5. Such outcomes signify an optimal recovery in the estimation of participants' cognitive abilities within CAT-Verbal Ability.
-
2.5 Characteristics of the CAT- Verbal Ability
-
2.5.1 Reliability of the CAT- Verbal Ability
-
2.5.2 Convergent-related validity of the CAT- Verbal Ability
-
2.5.3 Predictive utility (sensitivity and specificity) of the CAT- Verbal Ability
To examine the attributes of CAT- Verbal Ability, various statistics will be computed, including empirical reliability and the Person correlation between the estimated theta in CAT- Verbal Ability and the score on the Raven's Coloured Progressive Matrices test.
A crucial component of appraising the effectiveness of Computerized Adaptive Testing (CAT) lies in evaluating its reliability, reflecting the consistency and precision of the test scores. Empirical reliability stands as a frequently employed measure in CAT, serving to quantify the degree to which test scores remain unaffected by measurement error [44, 45]. Elevated empirical reliability coefficients are indicative of heightened accuracy and consistency in the test scores, signifying more dependable measurements of examinee abilities.
To delve deeper into the convergent-related validity of CAT-Verbal Ability, a sample of 239 fifth and sixth graders in the Sultanate of Oman underwent assessment using both the verbal ability test and Raven's Coloured Progressive Matrices test as the criterion scale. The evaluation of convergent-related validity was established through Pearson's correlation between the estimated theta in CAT-GAMMS and the scores on Raven's Coloured Progressive Matrices test.
The analysis will utilize the Receiver Operating Characteristic (ROC) curve to illustrate classification performance and assess predictive utility through the Area Under the Curve (AUC), encompassing sensitivity and specificity [46]. Sensitivity, representing the "true-positive rate," measures the accuracy of identifying individuals with high cognitive ability, while specificity, known as the "true-negative rate," assesses the precision in identifying those with weak cognitive ability. A higher AUC index signifies a more effective diagnostic outcome [47]. The interpretation of AUC values is available in Table 1 [10]. The categorization of cognitive ability will be achieved using Raven's Colored Progressive Matrices test, with the classification threshold set at the seventy-fifth percentile (Q3). The estimated theta in CAT-GMMAS will serve as a continuous variable. Employing SPSS 25.0, the ROC curve will be generated for each stopping rule (0.30, 0.35, 0.40, and 0.45).
Table 1. AUC indicator size description
|
Numerical interval of AUC |
Predictive utilities |
|
0.5 0.5–0.7 0.7–0.9 0.9–1 |
None Small Moderate High |
Note: AUC, area under curve.
3. Results 3.1 Construction of the CAT- Verbal Ability item bank
During the initial phase of creating the item bank, we examined 30 items to assess their unidimensionality, local independence, and various characteristics. These characteristics encompass item fit, test information curves, differential item functioning, as well as threshold and location parameters.
-
3.1.1 Unidimensionality
-
3.1.2 Model selection
Exploratory factor analysis (EFA)
To validate the assumption of the test's unidimensionality, we first confirmed the adequacy of the sample size through the Kaiser-Mayer-Olkin (KMO) and Bartlett's test. The calculated chi-square value, 13503.534, at a significance level of 0.001 and with 435 degrees of freedom, indicated that the sample size is appropriate for conducting exploratory factor analysis. Utilizing the principal components method on the correlation matrix for the 30 verbal ability items in the scale, exploratory factor analysis revealed five latent root factors with eigenvalues each exceeding one. Collectively, these factors explained 37.740% of the variance. The ratio of the first factor's eigenvalue (6.345) to the second factor's eigenvalue (1.572), resulting in 4.036, surpassing the threshold of two, indicates unidimensionality [48]. The proportion of explanatory variance attributed to the first factor in relation to the total variance is 56.039%, meeting the Reckase criterion of 20%. Additionally, employing Cattell's scree plot test for the 30-item factor analysis, Figure 2 illustrates the achievement of test unidimensionality by distinguishing the first factor from the remaining factors.
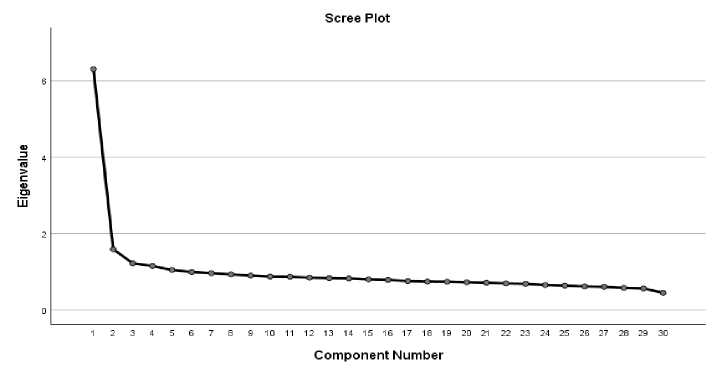
Fig. 2. Factor scree plots from principal component analysis of 30 items
Confirmatory factor analysis (CFA)
In assessing the fulfillment of the unidimensional assumption in the data, the AMOS program was utilized to determine the Root Mean Square of Residuals (RMSEA) and the Tanaka Index (GFI). The results indicate that the RMSEA value is .042, satisfying the criterion outlined by Browne and Cudeck (1993), where an RMSEA of .05 or less is indicative of a good fit. Additionally, the GFI value stands at 0.93, meeting the criterion set by Tanaka and Huba [27].
Table 2 presents the model fit index values to guide the selection of the fit model for the data related to the verbal ability test.
Table 2. The values of the indicators for dichotomously scored IRT models
|
S |
Indicators |
Model |
||
|
1PL |
2PL |
3PL |
||
|
1 |
-2 log Likelihood |
85842.3184 |
84711.1844 |
84592.3000 |
|
Model Differences |
- |
1131.134** |
118.8844** |
|
|
2 |
Average Test Information |
5.679 |
6.868 |
7.070 |
|
3 |
RMSE |
0.4003 |
0.3942 |
0.3766 |
|
4 |
Reliability Index |
0.850 |
0.873 |
0.876 |
It is clear from Table 1 that the most suitable model for the test data is the three-parameter logarithmic model (3PL), which considers difficulty, discrimination, and guessing parameters.
-
3.1.3 Local independence
-
3.1.4 Item fit
-
3.1.5 Person Fit
The results showed in the verbal ability test were 21 cases of misfit for male student response patterns and 28 cases for female student response patterns, which were deleted. The data that were valid for analysis became 2639.
-
3.1.6 Item discrimination parameters
9
2.093
0.122
0.372
0.523
3.542
0.06
25.956
23
0.303
10
1.320
0.740
0.223
0.284
2.814
0.093
36.576
23
0.036
11
2.762
-1.244
0.203
1.283
1.477
0.224
44.876
18
*0.00
12
1.685
-1.270
0.003
0.704
0.758
0.384
27.04
20
0.134
13
1.192
-0.720
0.000
0.355
0.928
0.335
53.727
22
*0.00
14
2.470
-1.392
0.000
1.525
0.758
0.384
33.514
17
0.01
15
1.875
-1.242
0.000
0.878
0.717
0.397
30.782
20
0.058
16
1.819
-0.747
0.000
0.826
0.911
0.34
24.492
21
0.27
17
1.568
-0.189
0.165
0.448
1.187
0.276
23.255
23
0.446
18
2.275
-0.216
0.172
0.919
1.904
0.168
33.149
22
0.06
19
1.937
0.204
0.196
0.641
2.558
0.11
19.958
23
0.644
20
1.513
0.775
0.186
0.400
3.213
0.073
33.487
23
0.073
21
1.423
-1.864
0.000
0.505
0.658
0.417
28.17
22
0.17
22
1.799
-0.738
0.175
0.579
0.969
0.325
38.873
22
0.015
23
1.512
-1.178
0.000
0.571
0.824
0.364
10.842
21
0.966
24
1.188
-1.276
0.000
0.352
0.866
0.352
34.131
22
0.048
25
1.688
0.175
0.206
0.479
2.063
0.151
27.476
23
0.236
26
0.967
0.151
0.163
0.171
1.529
0.216
24.643
23
0.369
27
1.239
1.110
0.215
0.254
3.807
0.051
14.554
23
0.91
28
1.434
0.409
0.186
0.360
1.984
0.159
27.208
23
0.247
29
0.948
1.830
0.195
0.154
5.151
0.023
18.673
23
0.72
30
1.503
-0.343
0.148
0.425
1.215
0.27
33.98
23
0.065
No items were deleted from the item bank because their Q3 values were all greater than .20. All items met the local independence well.
Table 3 presents the p-values of the standardized residuals (SRs) index for the 30 verbal items. The results indicate that the three-parameter model is a good fit for all verbal items.
Also, an item-fitting test was performed on the remaining 30 items by S-χ2, and it was found that the p values of S-χ2 of three items were less than the critical value of .01, so these items were a departure from the model's expectations [24]. The p values of S-χ2 of the remaining 27 items were higher than .01 (see Table 3).
Table 3. Item Statistics for 30 item- bank with three-parameter logistic (3PL)
|
Item parameters |
MII |
Item-fit estimates |
|||||||
|
Item |
a |
b |
c |
SMR |
p |
S-X2 |
df |
p |
|
|
1 |
0.992 |
-1.450 |
0.067 |
0.215 |
0.87 |
0.351 |
24.305 |
24 |
0.444 |
|
2 |
1.378 |
-0.332 |
0.380 |
0.225 |
1.221 |
0.269 |
33.141 |
24 |
0.101 |
|
3 |
0.755 |
0.188 |
0.128 |
0.112 |
1.567 |
0.211 |
29.616 |
23 |
0.161 |
|
4 |
2.583 |
-0.155 |
0.491 |
0.614 |
3.376 |
0.066 |
26.18 |
22 |
0.244 |
|
5 |
0.705 |
-1.751 |
0.000 |
0.124 |
0.874 |
0.35 |
74.452 |
24 |
*0.00 |
|
6 |
1.343 |
-0.083 |
0.285 |
0.260 |
1.456 |
0.228 |
24.653 |
23 |
0.368 |
|
7 |
1.733 |
0.083 |
0.307 |
0.412 |
2.156 |
0.142 |
37.391 |
23 |
0.03 |
|
8 |
1.230 |
0.143 |
0.232 |
0.242 |
1.582 |
0.208 |
24.539 |
23 |
0.375 |
* Significance at 0.01; a: Discrimination parameter; b: Difficulty parameter; c: Pseudo-guessing parameter; MII: Maximum Item Information; SMR: Standard mean of residuals; S-χ2 = Orlando and Thissen’s S-statistic.
Table 3 shows discrimination parameters of the remaining 30 items were all >0.70 with a mean of 1.564 (SD = 0.513), indicating a high-quality item bank. As for the difficulty (threshold) parameters of the remaining 30 items in the final CAT varied from -1.864 to 1.829 for items number 21 and 29, respectively (Table 3). Also, Table 3 shows the ranges of the item pseudo-guessing parameter from 0.000 to 0.491 for items 13 and 4, respectively.
Figure 3 reveals the findings of the test information function (TIF) and SEM across the theta under the simulated data of the CAT-Verbal Ability. The greater the theta value, the greater the verbal ability. More information denotes greater precision for measurement. A reliability coefficient of 0.73 or higher suggests that the measure has good reliability [49]. Naturally, the low-SEM criterion is a value of 0.12 or higher. These values are considered acceptable because all the SEM values were under 0.12. The greater the TIF at each theta level, the smaller the SEM. According to the results, it is easy to see that the cat-V erbal a bility achieved adequate information and a reasonable standard error .
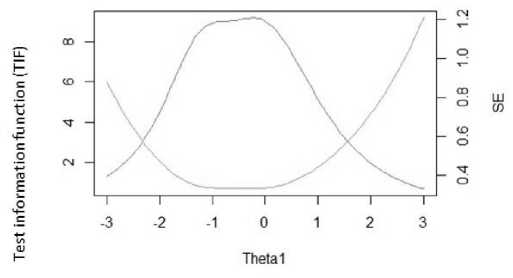
Fig. 3. Function of test information and standard error of verbal ability
-
3.1.7 Differential item functioning (DIF)
-
3.2 CAT-Verbal Ability Simulated Study
The results obtained through the likelihood ratio test method revealed the presence of DIF in 3 items based on gender and 9 items based on country, as indicated by G2 [50]. (Liu, 2011). In contrast, employing another method, the chi-squared test for Mantel and Haenszel produced values ranging from 0.036 to 13.864. These results suggested DIF in 5 items based on gender and values between 0.000 and 32.177 for DIF based on country, indicating 10 items with DIF according to the country of the students based on the D index (D < 1.5) [51].
Upon scrutinizing these findings, the items displaying DIF underwent review by a committee of specialists in language and measurement. Remarkably, the committee asserted that there was no evidence of DIF in those items concerning both gender and country variables. Consequently, all items were retained in the item bank.
|
Stop rules |
Number of items RMSEb Bias rc Min Max Mean % alla SE |
|
SE (θ) ≤ 0.30 SE (θ) ≤ 0.35 SE (θ) ≤ 0.40 SE (θ) ≤ 0.45 |
29.9 30 29.8 99.1 % 0.13 0.35 0.010 .93 21.5 27.2 24.4 81.4 % 0.14 0.36 0.008 .92 14.3 21.8 18.1 60.4 % 0.17 0.39 0.009 .90 11.5 15.6 13.5 45.1% 0.20 0.43 0.006 .89 |
|
Note: SE: standard |
error; aThe percentage of the mean numbers of administered items in the full-item bank. b RMSE: root mean square error. c |
-2-1 о 1
True Theta
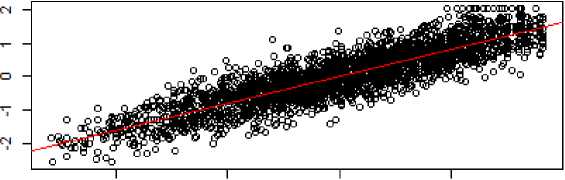
Fig. 4. The relationship between the true and estimated abilities in verbal ability (SE ≤ .45)
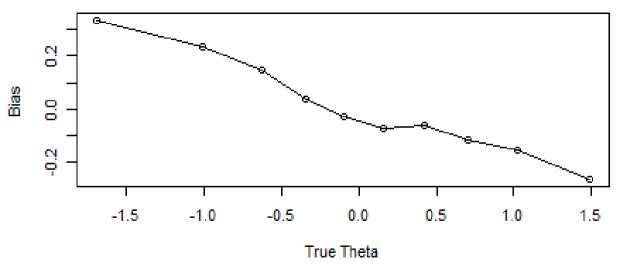
Fig. 5. The relationship between the true theta and bias in verbal ability (SE ≤ .45)
Figure 6 also observes that the conditional RMSE exhibited its highest value at the lower end of the true theta axis, decreasing as theta values increased. Upon reaching a value of 0, the conditional RMSE showed an upward trend towards the higher end of the true theta axis. It is noteworthy that, despite variations across the range of theta values, the RMSE values consistently adhered to the acceptable criterion of being less than 0.5 [52]. This standard indicates that, regardless of the fluctuations, the RMSE values remained satisfactory and achieved the desired level of accuracy within the specified context.
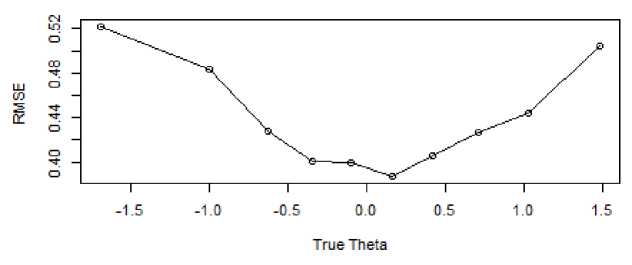
Fig. 6. The relationship between the true theta and RMSE in verbal ability (SE ≤ .45)
-
3.3 CAT- Verbal Ability Real Study
-
3.3.1 Characteristics of CAT- Verbal Ability
-
-
3.3.2 Convergent-related validity of CAT- Verbal Ability
-
3.3.3 Predictive utility (sensitivity and specificity) of CAT- Verbal Ability
To understand the psychometric properties of the CAT-Verbal Ability test scale, the researcher assessed the empirical reliability, convergent validity, and predictive validity of the CAT-Verbal Ability test.
Table 5 presents a range of empirical reliability (ranging from 0.73 to 0.83) obtained from various stopping rules, with an average of 0.79. This indicates that, overall, these reliability values were considered acceptable for individuals. Additionally, it is highlighted that the empirical stability value at SE = 0.45 is 0.73.
Table 5 displays Pearson’s correlation coefficients between CAT verbal ability scores and scores from the Raven's Colored Progressive Matrices Test (RPMT). The results show correlation coefficients ranging from .34 to .37 under various stopping rules. Additionally, Table 5 highlights that the correlation coefficients between the convergent-related validity of true theta in the verbal ability test and RPMT (.36) closely correspond to the convergent-related validity of the estimated theta. These results suggest that regardless of the stopping rule employed, CAT verbal ability exhibits a satisfactory and consistent external convergent-related validity.
Table 5. Characteristics of CAT- verbal ability under different stopping rules
|
Stopping rule |
Empirical reliability |
ra |
|
Noneb |
- |
.36 |
|
SE(θ) < 0.30 |
0.83 |
.37 |
|
SE(θ) < 0.35 |
0.82 |
.36 |
|
SE(θ) < 0.40 |
0.79 |
.34 |
|
SE(θ) < 0.45 |
0.73 |
.34 |
Note: a: the Pearson’s correlation between the estimated theta in the CAT- spatial and the RPMT; b: None, no stopping rule (perform all items)
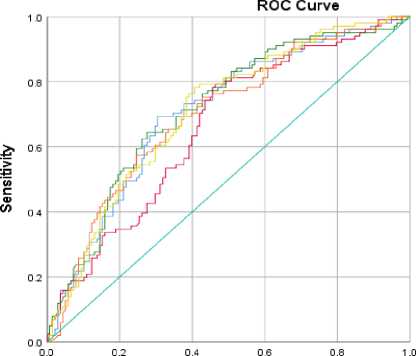
The outcomes regarding the predictive validity of verbal ability, assessed through the Raven's Colored Progressive Matrices test, are detailed in Table 6 across all stopping rules, the AUC values consistently exceeded or equaled 0.70, surpassing the commonly adopted critical value of .70—a threshold indicative of moderate predictive utility. These findings imply that the predictive utility of CAT- Verbal Ability was deemed reasonable.
Table 6. Area under the curve Statistics for the Verbal Ability test under different stopping rules, and 95% confidence intervals
|
Stopping rule |
High ability (AUC [95% CI]) b |
|
Nonea SE(θ) < 0.30 SE(θ) < 0.35 SE(θ) < 0.40 SE(θ) < 0.45 |
0.71 [0.641, 0.773] 0.71 [0.643, 0.774] 0.70 [0.631, 0.765] 0.71 [0.649, 0.780] 0.70 [0.591, 0.729] |
Note: aNone, all item bank was used; a: AUC is the area under the ROC curve; High ability is based on the RPMT sum scores
Moreover, the ROC curve depicted in Figure 7 illustrates the acceptable diagnostic accuracy of verbal estimation. Specifically, at a measurement precision of 0.45, the AUC (0.70) for high-pressure classification was marginally lower than the AUC for the entire verbal item bank (0.71).
1 - Specificity
Diagonal segments are produced by ties.
Fig. 7. ROC curve under different stopping rules in the CAT Verbal
Source of the
Curve
None
— SE0.45
— SEO 40
— SEO.35
SEO.30
References A Feasibility Study for Developing a Computerized Adaptive Version of Verbal Ability Test for Gulf Student
- Hajovsky, D. B., Villeneuve, E. F., Reynolds, M. R., Niileksela, C. R., Mason, B. A., & Shudak, N. J. (2018). Cognitive ability influences on written expression: Evidence for developmental and sex-based differences in school-age children. Journal of School Psychology, 67, 104–118. https://doi.org/10.1016/j.jsp.2017.09.001
- Weiner, B. J., Lewis, C. C., Stanick, C., Powell, B. J., Dorsey, C. N., Clary, A., Boynton, M. H., & Halko, H. M. (2017). Psychometric assessment of three newly developed implementation outcome measures. Implementation Science, 12(1). https://doi.org/10.1186/s13012-017-0635-3
- York, T., Gibson, C., & Rankin, S. (2015). Defining and measuring academic success. Practical Assessment, Research and Evaluation, 20(5), 1–20. https://doi.org/10.7275/hz5x-tx03
- Axelrod, V., Rees, G., & Bar, M. (2017). The default network and the combination of cognitive processes that mediate self-generated thought. Nature Human Behaviour, 1(12), 896–910. https://doi.org/10.1038/s41562-017-0244-9
- Fabiano‐Smith, L. (2019). Standardized tests and the diagnosis of speech sound disorders. Perspectives of the ASHA Special Interest Groups, 4(1), 58–66. https://doi.org/10.1044/2018_pers-sig1-2018-0018
- Irwing, P., Booth, T., & Hughes, D. J. (2018). The Wiley Handbook of Psychometric Testing: A Multidisciplinary Reference on Survey, Scale and Test Development. John Wiley & Sons.
- De Stasio, S., Fiorilli, C., & Di Chiacchio, C. (2014). Effects of verbal ability and fluid intelligence on children’s emotion understanding. International Journal of Psychology, 49(5), 409–414. https://doi.org/10.1002/ijop.12032
- Cappelleri, J. C., Lundy, J. J., & Hays, R. D. (2014). Overview of Classical test Theory and item response Theory for the quantitative assessment of items in developing Patient-Reported Outcomes Measures. Clinical Therapeutics, 36(5), 648–662. https://doi.org/10.1016/j.clinthera.2014.04.006
- Alzayat, F., Almahrazi, R., Arshad, A., Fathi, K., Albaili, M., dogan, A., Asiri, A., Hadi, F., & Jassim, A. (2011). Technical report of the Gulf Scale for Multiple Mental Abilities (GMMAS). Arab Gulf University, Bahrain.
- Forkmann, T., Boecker, M., Norra, C., Eberle, N., Kircher, T., Schauerte, P., Mischke, K., Westhofen, M., Gauggel, S., & Wirtz, M. (2009). Development of an item bank for the assessment of depression in persons with mental illnesses and physical diseases using Rasch analysis. Rehabilitation Psychology, 54(2), 186–197. https://doi.org/10.1037/a0015612
- Brodke, D. J., Saltzman, C. L., & Brodke, D. S. (2016). PROMIS for orthopaedic Outcomes measurement. Journal of the American Academy of Orthopaedic Surgeons, 24(11), 744–749. https://doi.org/10.5435/jaaos-d-15-00404
- Sedoc, J., & Ungar, L (2020). Item Response Theory for Efficient Human Evaluation of Chatbots. Proceedings of the First Workshop on Evaluation and Comparison of NLP Systems, 21–33. http://dx.doi.org/10.18653/v1/ 2020.eval4nlp-1.3.
- Young‐Afat, D. A., Gibbons, C., Klassen, A. F., Vickers, A., Cano, S., & Pusic, A. L. (2019). Introducing BREAST-Q Computerized Adaptive Testing: Short and Individualized Patient-Reported Outcome Assessment following Reconstructive Breast Surgery. Plastic and Reconstructive Surgery, 143(3), 679–684. https://doi.org/10.1097/prs.0000000000005314
- Choi, Y., & McClenen, C. (2020). Development of adaptive formative assessment system using computerized adaptive testing and dynamic Bayesian networks. Applied Sciences, 10(22), 8196. https://doi.org/10.3390/app10228196
- Falani, I., Akbar, M. and Naga, D. S. (2020). The precision of students’ ability estimation on combinations of item response theory models. International Journal of Instruction, 13(4), 545–558. pp. https://doi.org/10.29333/iji.2020.13434a
- Morris, S. B., Bass, M., Howard, E. V., & Neapolitan, R. E. (2019). Stopping rules for computer adaptive testing when item banks have nonuniform information. International Journal of Testing, 20(2), 146–168. https://doi.org/10.1080/15305058.2019.1635604
- Ghosh, A., & Lan, A. S. (2021). BOBCAT: Bilevel Optimization-Based Computerized Adaptive Testing. International Joint Conference on Artificial Intelligence. https://doi.org/10.24963/ijcai.2021/332
- Magis, D & Barrada, J. R. (2017). Computerized adaptive testing with R: recent updates of the package catR. Journal of statistical software, 76. https://doi :10.18637/jss.v076.c01
- Istiyono, E., Dwandaru, W. S. B., Setiawan, R., & Megawati, I. (2020). Developing of Computerized Adaptive Testing to Measure Physics Higher Order Thinking Skills of Senior High School Students and its Feasibility of Use. European Journal of Educational Research, 9(1), 91–101. https://doi.org/10.12973/eu-jer.9.1.91
- Şahin, A., & Anıl, D. (2017). The effects of test length and sample size on item parameters in item response theory. Educational Sciences: Theory & Practice, 17, 321–335. https://doi.org/10.12738/estp.2017.1.0270
- Crisan, D., Tendeiro, J. N., & Meijer, R. R. (2017). Investigating the practical consequences of model misfit in unidimensional IRT models. Applied Psychological Measurement, 41(6), 439–455. https://doi.org/10.1177/0146621617695522
- Meijer, R. R., & Tendeiro, J. N. (2018). Unidimensional item response theory. In P. Irwing, T. Booth, & D. J. Hughes (Eds.), The Wiley handbook of psychometric testing: A multidisciplinary reference on survey, scale and test development (pp. 413–443). Wiley Blackwell. https://doi.org/10.1002/9781118489772.ch15
- Tian, X., & Dai, B. (2020). Developing a computerized adaptive test to assess stress in Chinese college students. Frontiers in Psychology, 11. https://doi.org/10.3389/fpsyg.2020.00007
- Reeve, B. B., Hays, R. D., Bjørner, J. B., et al. (2007). Psychometric Evaluation and Calibration of Health-Related Quality of Life Item Banks. Medical Care, 45(5), S22–S31. https://doi.org/10.1097/01.mlr.0000250483.85507.04 [25]Edelen, M. O., and Reeve, B. B. (2007). Applying item response theory (IRT) modeling to questionnaire development, evaluation, and refinement. Qual. Life Res. 16, 5–18. doi: 10.1007/s11136-007-9198-0
- Pelobillo, G. (2023). Conceptions of Learning Physics among University of Mindanao Students: A Validation Study. International Journal of Instruction, 16(4), 921–938. https://doi.org/10.29333/iji.2023.16451a
- Tanaka, J. S., & Huba, G. J. (1985). A fit index for covariance structure models under arbitrary GLS estimation. British Journal of Mathematical and Statistical Psychology, 38(2), 197–201. https://doi.org/10.1111/j.2044-8317.1985.tb00834.x
- Wahyudi, A., Richardo, R., Eilks, I., & Kulgemeyer, C. (2023). Development of Three tier Open-Ended Instrument to measure Chemistry students’ critical thinking disposition using RASCH analysis. International Journal of Instruction, 16(3), 191–204. https://doi.org/10.29333/iji.2023.16311a
- Li, Z., Cai, Y., & Tu, D. (2020). A new approach to assessing shyness of college students using computerized adaptive testing: CAT-Shyness. Journal of Pacific Rim Psychology, 14, e20. https://doi.org/10.1017/prp.2020.15
- Bichi, A., & Talib, R. (2018). Item response theory: An introduction to latent trait models for testing and item development. International Journal of Evaluation and Research in Education, 7(2), 142–151. https://doi.org/10.11591/ijere.v7i2.12900.
- Fu, Q. (2010). Comparing Accuracy of parameter Estimation Using IRT Models in The Presence of Guessing [Unpublished Doctoral Dissertation]. University of Illinois at Chicago, USA.
- Gao, S. (2011). The Exploration of the Relationship Between Guessing and Latent Ability in IRT Models [Unpublished Doctoral Dissertation]. University of Southern Illinois, USA.
- Edwards, M. C., Houts, C. R., & Cai, L. (2018). A diagnostic procedure to detect departures from local independence in item response theory models. Psychological methods, 23(1), 138–149. https://doi.org/10.1037/met0000121
- Chen, W.-H., & Thissen, D. (1997). Local dependence indexes for item pairs using item response theory. Journal of Educational and Behavioral Statistics, 22(3), 265–289. https://doi.org/10.2307/1165285
- Wright, B. D., & Masters, G. N. (1982). Rating Scale Analysis. Chicago, IL: MESA Press.
- Ferrando, P. J., Vigil-Colet, A., & Lorenzo‐Seva, U. (2016). Practical Person-Fit Assessment with the Linear FA Model: New Developments and a Comparative Study. Frontiers in Psychology. https://doi.org/10.3389/fpsyg.2016.01973
- Almehrizi, R. S. (2010). Comparing among new residual-fit and wright’s Indices for dichotomous three -Parameter IRT model with standardized tests. Journal of Educational & Psychological Studies, 4 (2), 14-26.
- Almaskari, H. A., Almehrizi, R. S., & Hassan, A. S. (2021). Differential item Functioning of Verbal Ability Test in Gulf Multiple Mental Ability Scale for GCC students according to gender and country. Journal of Educational and Psychological Studies, 15(1), 120–137. https://doi.org/10.53543/jeps.vol15iss1pp120-137
- Geramipour, M. (2020). Item-focused trees approach in differential item functioning (DIF) analysis: A case study of an EFL reading comprehension test. Journal of Modern Research in English Language Studies, 7(2),123-147 https://doi: 10.30479/jmrels.2019.11061.1379
- Magis, D., & Raiche, G. (2012). Random generation of response patterns under computerized adaptive testing with the R package catR. Journal of statistical software, 48(8), 1-31. https://doi.org/10.18637/jss.v048.i08
- Mahmud, J., Sutikno, M., & Naga, D. S. (2016). Variance difference between maximum likelihood estimation method and expected a posteriori estimation method viewed from number of test items. Educational Research and Reviews, 11(16), 1579-1589. https://doi: 10.5897/ERR2016.2807
- Sorrel, M. A., Barrada, J. R., De La Torre, J., & Abad, F. (2020). Adapting cognitive diagnosis computerized adaptive testing item selection rules to traditional item response theory. PLOS ONE, 15(1), e0227196. https://doi.org/10.1371/journal.pone.0227196
- Omara, E., Kazem, A. (2020). A feasibility study for developing a computerized adaptive form of Raven’s colored progressive matrices test for Omani children based on the item response theory. The International Journal for Research in Education, 44(3), 142–181. https://doi.org/10.36771/ijre.44.3.20-pp142-181
- Brown, A., & Croudace, T. (2015). Scoring and estimating score precision using multidimensional IRT. In S. P. Reise & D. A. Revicki (Eds.), Handbook of Item Response Theory Modeling: Applications to Typical Performance Assessment (pp. 307- 333). New York, NY: Routledge/Taylor & Francis Group.
- Seo, D. G., & Jung, S. (2018). A comparison of three empirical reliability estimates for computerized adaptive testing (CAT) using a medical licensing examination. Frontiers in Psychology, 9. https://doi.org/10.3389/fpsyg.2018.00681
- Smits, N., Cuijpers, P., & Van Straten, A. (2011). Applying computerized adaptive testing to the CES-D scale: A simulation study. Psychiatry Research, 188(1), 147–155. https://doi.org/10.1016/j.psychres.2010.12.001
- Kraemer, H. C., & Kupfer, D. J. (2006). Size of treatment effects and their importance to clinical research and practice. Biological Psychiatry, 59(11), 990–996. https://doi.org/10.1016/j.biopsych.2005.09.014
- Atchia, S. M. C., & Chinapah, V. (2023). Factors influencing the academic achievement of secondary school students: A Structural equation model. International Journal of Instruction, 16(1), 999–1020. https://doi.org/10.29333/iji.2023.16155a
- May, S., Littlewood, C., and Bishop, A. (2006). Reliability of procedures used in the physical examination of non-specific low back pain: a systematic review. Austr. J. Physiother. 52, 91–102. doi: 10.1016/s0004-9514(06)70044-7
- Liu, O. L. (2011). Do major field of study and cultural familiarity affect TOEFL® IBT reading performance? A confirmatory approach to differential item functioning. Applied Measurement in Education, 24(3), 235–255. https://doi.org/10.1080/08957347.2011.580645
- Thissen, D., Steinberg, L., & Wainer, H. (1988). Use of item response theory in the study of group differences in trace lines. In H. Wainer & H. Braun (Eds.), Test validity (Pps. 147–169). Hillsdale, NJ: Lawrence Erlbaum Associates.
- Browne, M. W., & Cudeck, R. (1993). Alternative ways of assessing model fit. In K. A. Bollen & J. S. Long (Eds.), Testing structural equation models (pp. 136-162). Newbury Park, CA: Sage
- Rice, M. E., & Harris, G. T. (2005). Comparing effect sizes in follow-up studies: ROC Area, Cohen’s d, and r. Law and Human Behavior, 29(5), 615–620. https://doi.org/10.1007/s10979-005-6832-7
- Kocalevent, R.-D., Rose, M., Becker, J., Walter, O. B., Fliege, H., Bjorner, J. B., et al. (2009). An evaluation of patient-reported outcomes found computerized adaptive testing was efficient in assessing stress perception. J. Clin. Epidemiol. 62, 278–287.e3. doi: 10.1016/j.jclinepi.2008.03.003
