A Glowworm Optimization Method for the Design of Web Services

Author: Koffka Khan, Ashok Sahai
Journal: International Journal of Intelligent Systems and Applications(IJISA) @ijisa
Article in issue: 10 vol.4, 2012.
Free access
A method for adaptive usability evaluation of B2C eCommerce web services is proposed. For measuring eCommerce usability a checklist integrating eCommerce quality and usability is developed. By a Glowworm swarm optimization (GSO) neural networks-based model the usability dimensions and their checklist items are adaptively selected. A case study for usability evaluation of an eCommerce anthurium retail website is carried out. The experimental results show that GSO with neural networks supports the allocation of usability problems and the defining of relevant improvement measures. The main advantage of the approach is the adaptive selection of most significant checklist dimensions and items and thus significant reduction of the time for usability evaluation and design.
ECommerce, Usability, Glowworm swarm optimization, Neural Networks
Short address: https://sciup.org/15010322
IDR: 15010322
Text of the scientific article A Glowworm Optimization Method for the Design of Web Services
Published Online September 2012 in MECS
The concept of usability and Human-Computer Interaction (HCI) design principles of visibility, structure, simplicity, feedback, and so on are generic in nature and focus on the design of effective user-system interaction. In HCI literature [31] research into the success or failure of B2C eCommerce has primarily focused on the usability of the core Web site. Central to this has been how design criteria such as ease of navigation, optimal response time, and appropriate content can be managed to create usable customer-focused eCommerce sites [28].
From an online perspective, electronic commerce provides the capability of buying and selling products and information on the Internet and other online services [20]. Customers must perceive eCommerce as effective and efficient for online retailing to be viable. There are many types of eCommerce but the main focus of this study is Business-to-Consumer (B2C) eCommerce. This refers to electronic business transactions between businesses and individual consumers who are buyers [26].
A web presence and low prices were believed to be the key drivers of success in early online retailing. More recently beyond having a simple online presence and low prices, service has become essential for creating customer loyalty and improving customer satisfaction [46], [50]. Service quality is generally defined as the difference between expected service and perceived service [15], [32]. The delivery of superior service positively affects customers' perceived service quality and subsequently increases a firm's profitability [23]. While extensive research has been conducted on service quality in traditional retailing settings [38] service quality in online retailing is a relatively new topic. Traditional service quality deals with the quality of service based on human interactions and experiences in non-web-based settings. However, online service quality deals with interactions between humans and technology. The way people perceive service quality in web-based settings differs from service quality in non-web-based settings because the acceptance and usage of technologies differ among customers with different beliefs about technology [33].
As online retailing grows, service quality has become an increasingly important factor in determining the success or failure of online retail businesses by influencing consumers' online shopping experiences [46]. Empirical evidence shows that poor service quality negatively affects online retailers such that over 60 percent of online shoppers exit prior to completion of the transaction due to factors such as distrust of shopping and handling charges [41]. Incomplete product information (e.g. missing links and non-working buttons) leads to customer frustration and in turn to exiting. Given the difficulties related to the acquisition of customers in online retailing, it is crucial for online retailers to retain customers [36]. Nonetheless, some online retailers lose a valuable opportunity to build loyalty because of poor service quality [43].
Many studies provide useful insights about key dimensions of online service quality based on subjective consumer perceptions and evaluations: WebQual [1],
WebQualTM [25], E-Qual [21], AST [7], SITEQUAL [48], e-SQ [50], eTailQ [44], and eTransQual [2]. Empirical research data has shown that e-SQ affects customers’ satisfaction, intent to purchase and purchase and is the key driver of repeat purchases from Web sites. Key success factors for any online business, such as, repeat purchases, customer loyalty and eventually profitability will not be achieved unless their customers’ service quality needs are satisfied.
This paper has a focus on the consumer shopping process in the context of eCommerce retailing. Zeithaml [49] defines eService quality (e-SQ) as “the extent to which a web site facilitates efficient and effective shopping, purchasing, and delivery.”
Studies show that usability is a crucial success factor in eCommerce. Usability can be applied to specific contexts with the use of computer systems. Usability measures the quality of a user's experience when interacting with a product or system, for example, a Web site. Measuring usability is particularly difficult because usability is not a unidimensional product or user characteristic, but emerges as a multidimensional characteristic in the context of users performing tasks with a product in a specific environment. Users of eCommerce environments interact with the customer (or consumer) interface of the eCommerce sites to conduct transactions [10]. The consumer interface is different from a conventional user interface that focuses mainly on the task of conveying information in a cognitively efficient way, facilitating ease of use and ease of learning of the computer system. Conversely, a customer interface should contain elements that attract a visitor to stay and become a customer, and also return for repeat business.
ECommerce-specific design guidelines focus on the design characteristics of the Web site, such as, its navigation, structure, homepage design and page layout. In the retail eCommerce environment, usability is concerned with the pragmatics of how a customer perceives and interacts with the Web site. Ease of navigation and appropriateness of design are some of the aspects that will influence the customer’s judgments regarding the usability of the webstore.
‘Suitability for the task’ is a key aspect when considering the usability of a system. In this paper, the eCommerce system must support the customers in the tasks they are trying to accomplish. [3], regarded usability as "a property of the overall system: it is the quality of use in a context." The goals of the users, that is, what the users are trying to do with the system are very important concepts related to the usability of any system. The system should support what the users are trying to accomplish in an efficient, effective and satisfying way.
In the area of online retailing the design of websites that are efficient and effective has become key factors in determining the success of online companies. The term quality is used to encompass these concepts.
Quality in the traditional retail setting has gone on for decades, while quality in the online retail setting is relatively new. eCommerce usability is regarded as ensuring that interactive products, such as eCommerce applications, are easy to learn, effective to use and enjoyable from the user’s perspective and involves the optimization of user interaction with these interactive products [34].
Recently discussions recur on which measures of usability are suitable and on how to understand the relation between different measures of usability [17]. [3] regarded usability as "a property of the overall system: it is the quality of use in a context." Users of eCommerce environments interact with the customer (or consumer) interface of the eCommerce sites to conduct transactions [10]. A customer interface should contain elements that attract a visitor to stay and become a customer, and also return for repeat business.
There is a need of an approach for eCommerce usability evaluation integrating quality and usability measures of eCommerce. In this paper such method is proposed. It uses a neural networks model for eCommerce usability evaluation and design.
-
II. GSO Method
-
A. Existing problem and solution
We propose a method for eCommerce usability evaluation and design (GSO) based on neural networks integrating usability and quality measures of eCommerce systems.
Usability evaluation aims at weaknesses of a system and gives hints for improving its usability. Most usability evaluations gather both objective and subjective quantitative data in the context of realistic scenarios-of-use.
-
• Objective data are measures of participants'
performance.
-
• Subjective data are measures of participants'
opinions or attitudes concerning their perception of usability. Subjective measures assess impression of the customers towards the design of the Web site as well as the effect of the Web site design towards customer interaction.
Studies had found that checklist data can be both reliable and valid for the assessment of user satisfaction with Web sites or computer-based applications [19].
-
B. Artificial Neural Networks
Artificial Neural Networks (ANN) consist of a parallel collection of simple processing units (neurons/nodes) arranged and interconnected in a network topology [47]. ANN inspired by biological nervous system, are known as parallel distributed processing (PDP) systems. ANN consists of a set of interconnected processing units (node, neurons or cells).
Each node has activation functions. The activation signal sent (output) by each node to other nodes travel through weighted connection and each of these nodes accumulates the inputs it receives, producing an output according to an internal activation function. ANN is closely related to its architecture and weights. Multilayer architecture of network can be used to solve both classification and function approximation problems [42]. There are two types of learning networks which are supervised learning and unsupervised or selforganizing. Supervised learning is when the input and desired output are provided while for unsupervised learning, only input data is provided to the network.
The most popular supervised learning technique in ANN is the back propagation (BP) algorithm [39]. Its learning consists of the following steps:
-
1 An input vector is presented at the input layer.
-
2 A set of desired output is presented at the
output layer.
-
3 After a forward pass is done, the errors
between the desired and actual output are compared.
-
4 The comparison results are used to determine
weight changes (backwards) according to the learning rules.
In order to get the desired output from ANN, the output from the network is compared to actual desired output. During training, the network tries to match the outputs with the desired target values. Network need to review the connection weight to get the best output. The idea of the BP is to reduce this error, until the ANN learns the training data. The training begins with random weights, and the goal is to adjust them so that the learning error will be at minimal. ANN nodes in BP algorithm are organized in layers, send their signals forward and then the learning error (difference between actual and expected results) is calculated and propagated backwards until met satisfactory learning error.
-
C. Glowworm Swarm Optimization
In GSO [4] a swarm is composed of N agents called glowworms. A state of a glowworm i at time t can be described by the following set of variables: a position in the search space(xi(t)), a luciferin level (li(t)) and a neighbourhood range (ri(t)). GSO algorithm describes how these variables change over time.
Initially, agents are randomly distributed in the search space. Other parameters are initialized by predefined constants. Each, next iteration is composed of three phases: luciferin level update, glowworm movement and neighbourhood range update.
To encode in the luciferin level the fitness of the current position of a glowworm i, the following formula is used:
l i (t) = (1 - p)l i (t - 1) + YJx i (t) (1)
where: p is the luciferin decay constant, у is the luciferin enhancement constant and J is an objective function.
Then, each glowworm tries to find neighbours. In GSO a glowworm j is a neighbour of a glowworm i only if the distance between glowworms i and j is shorter than the neighbourhood range ri(t) and additionally glowworm j has to shine brighter than i (lj(t) > li(t)). If one glowworm has multiple neighbours, chooses one by random with probability proportional to the luciferin level of this neighbour. Finally, glowworm moves one step in direction of the chosen neighbour. Step size is constant and equals s.
In the last phase, the neighbourhood range ri(t) is updated in order to limit the range of the communication in an ensemble of agents. The following formula is used:
r i (t + 1) = min r s , max [0, r i (t) + p(nd - |ni(t)|)] (2)
where: rs is a sensor range (a constant, which limits the size of the neighbourhood range), nd is a desired number of neighbours, |ni(t)| is a number of neighbours of a glowworm i at time t, and в is a model constant.
-
D. eCommerce Usability and Quality
There are both unique and overlapping segments in the fields eCommerce Usability, and eCommerce Quality. Figure 2 presents the areas that are of primary concern to this paper (12, 123 and 23).
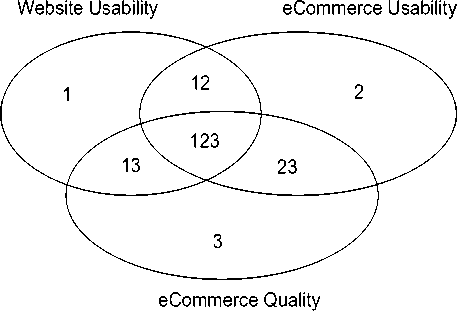
Fig. 1: Overlapping field segments
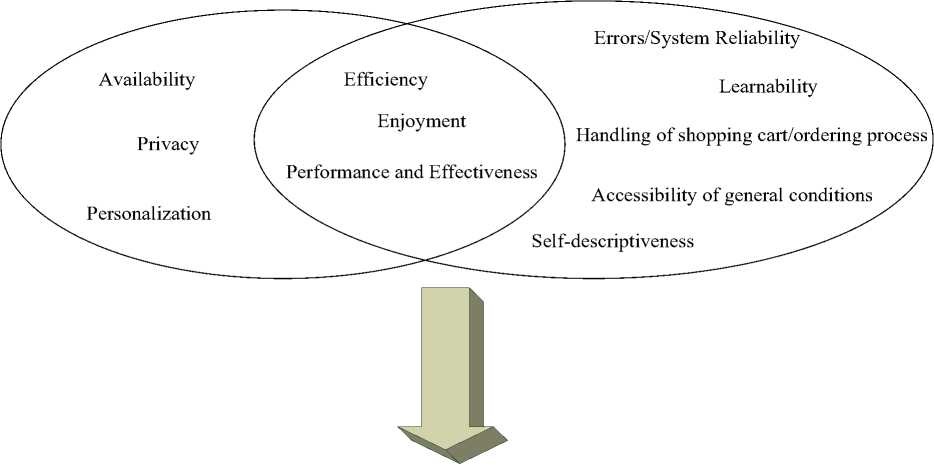
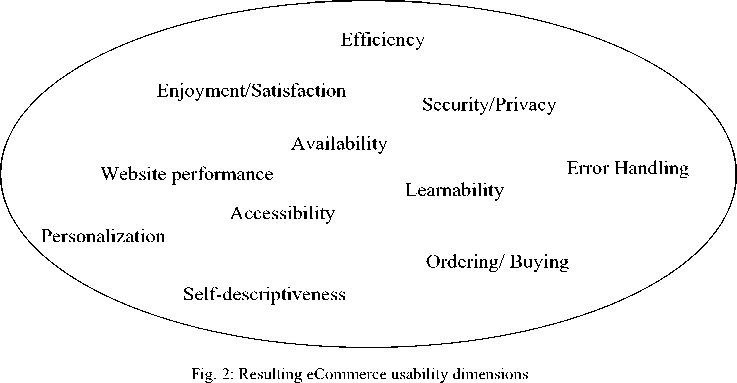
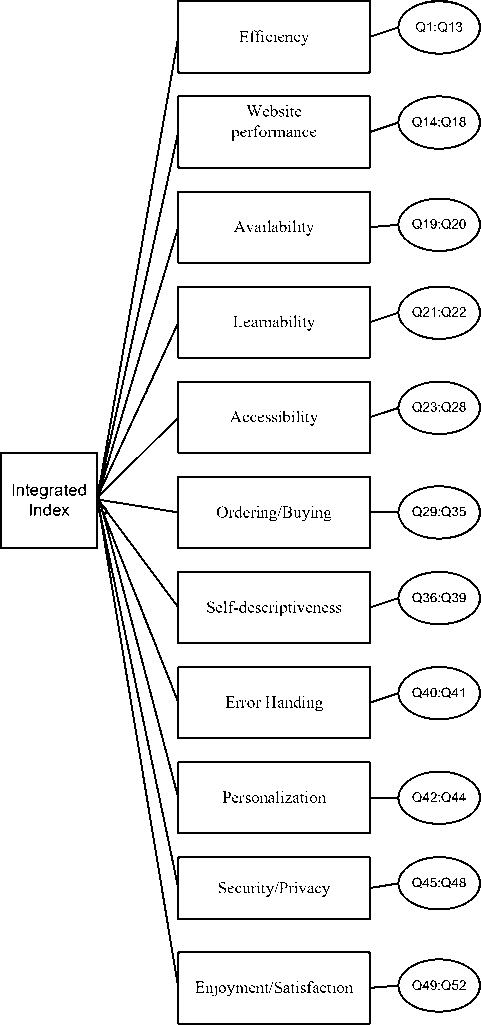
For defining eCommerce Quality and Usability dimensions three eCommerce Quality scales (Refined E-S-QUAL [5], WSSQ [6] and .comQ [45]) and three eCommerce Usability scales (UFOS [9], WEBUSE [8] and PSSUQ [1]) were selected. Their dimensions and questions were compared and contrasted to produce eCommerce scales covering both fields. The new eCommerce usability scale consists of eleven dimensions as presented in Figure 3. It is implemented as a new checklist with eleven eCommerce dimensions and 53 respective questions measured as the extent to which participants agreed with statements on five-point Likert scales, ranging from “Strongly Disagree” to “Strongly Agree” [14].
Extracted eCommerce Quality Dimensions
Extracted eCommerce Usability Dimensions
In the following the dimensions and two example questions of each dimensions of the checklist are given:
Dimension 1 – Efficiency o This ecommerce Web site makes it easy for me to find what I need/what I am looking for.
o The eCommerce Web site enables me to complete a transaction quickly.
Dimension 2 - Web site performance o I am able to access eCommerce Web site quickly.
o I need not wait too long to open a page.
Dimension 3 – Availability o This eCommerce Web site does not crash.
o Pages at this eCommerce Web site do not freeze after I enter my order information.
Dimension 4 – Learnability o It was easy to learn to use the eCommerce Web site.
o The information provided by the eCommerce Web site was easy to understand.
Dimension 5 – Accessibility o I easily find useful information about the terms of delivery.
o I easily find how my personal data is being handled.
Dimension 6 – Ordering/Buying o It is easy to put products into the shopping cart.
o I always know which products are in the shopping cart.
Dimension 7 – Self-descriptiveness o When I click on something, I find what I expect.
o I always know what actions are available to me.
Dimension 8 – Error Handling o The eCommerce Web site gives error messages that clearly tell me how to fix problems.
o Whenever I make a mistake using the eCommerce Web site, I recover easily and quickly.
Dimension 9 – Personalization o The eCommerce Web site understands my specific needs.
o The eCommerce Web site offers me extra services or information based on my preferences.
o The eCommerce Web site has adequate security features.
o I feel like my privacy is protected at the eCommerce Web site.
Dimension 11 – Enjoyment/Satisfaction o I feel happy when I use the eCommerce Web site.
o The eCommerce Web site has an attractive appearance.
Dimension 10 – Security/Privacy
Usability Index Calculation
Integrated Index Calculation
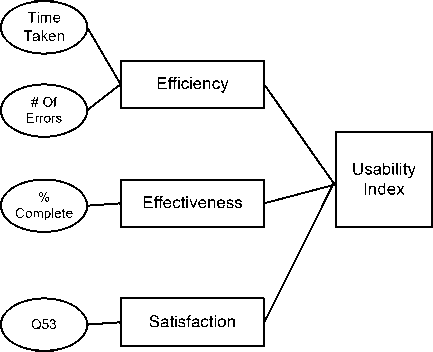
Fig. 3: GSO usability evaluation model
In GSO usability evaluation model the entire construct of usability is represented by a single dependent variable [22]. Two different quantitative indices are calculated for the usability evaluation of eCommerce systems, as shown in Figure 4.
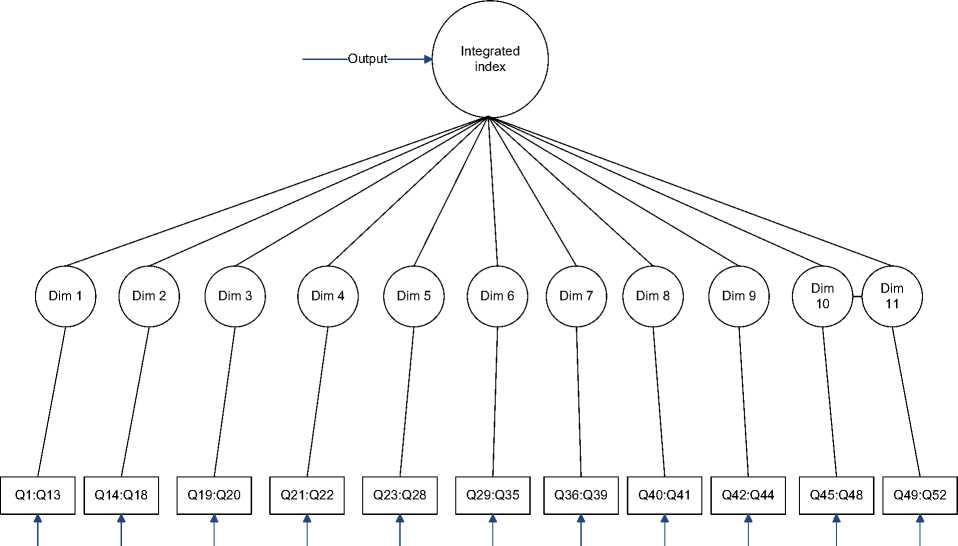
Input(s) Input(s) Input(s) Input(s) Input(s) Input(s) Input(s) Input(s) Input(s) Input(s) Input(s)
Fig. 4: Neural network structure
The usability index was calculated using the efficiency, effectiveness and satisfaction dimensions. Both objective and subjective measures of eCommerce usability are gathered. The objective data (efficiency and effectiveness) are measured as follows [11].
For each task, eCommerce efficiency was measured using:
-
1. Time taken to perform a task:
-
2. Number of errors made while performing the task
For each task, eCommerce effectiveness is measured using the percentage of the task solved. Satisfaction was measured by customer’s subjective response to a question. The weights of the dimensions of usability index efficiency, effectiveness and satisfaction are determined by principal component analysis. The integrated index uses eleven eCommerce usability and eCommerce quality dimensions.
The most critical usability dimensions / checklist items are adaptively determined by the weights of the neural network GSO model. Depending on the problems that these dimensions/questions indicate relevant design improvements of eCommerce system are proposed.
-
III. Case Study
-
A. Website and User Tasks
For experimental implementation and study of GSO method a prototype retail eCommerce website (cf. Figures 5-7) was created together with the biggest anthurium producing company in Caribbean, Kairi Blooms Ltd. 66 BSc students at the University of the West Indies participated in the study. The percentage of females taking part in the testing was 55 percent, with 45 percent being male. Year one students was the largest test group, and this was useful for testing purposes, because they represented the most inexperienced computer users. The students solved the following three tasks using the eCommerce system:
information is: .... You pay by your credit card,
American Express: ...
Task 2 - Register with the Kairi Blooms Web site. Enter your own name and email. Your shipping information is: ...You decide to buy the following flowers:..... Place 25 Small “Light Green” flowers in your Shopping List. After seeing the total cost, instead of the 55 Large “Dark Pink” flowers buy 30 Small “Light Pink” flowers and additional 20 Mini “Light Red” flowers. You want the flowers to be delivered the next day. Pay by your credit card, Visa:...Order these flowers.
Task 3 - Buy a box of medium sized anthuriums from the Web site. The box consists of the following flowers:... Instead of 15 Off White, buy 10 Bright Red and 5 Orange blooms. You now decide to change the size of flowers to Small and buy a box of 70 flowers. You place 35 Light Pink flowers and 35 Dark Red flowers in this box to obtain an average Unit Shipping Cost of $US 7.63. Buy five of these boxes. Your shipping information is: ...You change your mind about paying by credit card, and decide to pay cash. You want the flowers delivered by DHL Express to your home after five days.
Fig. 5: Buy anthurium flowers
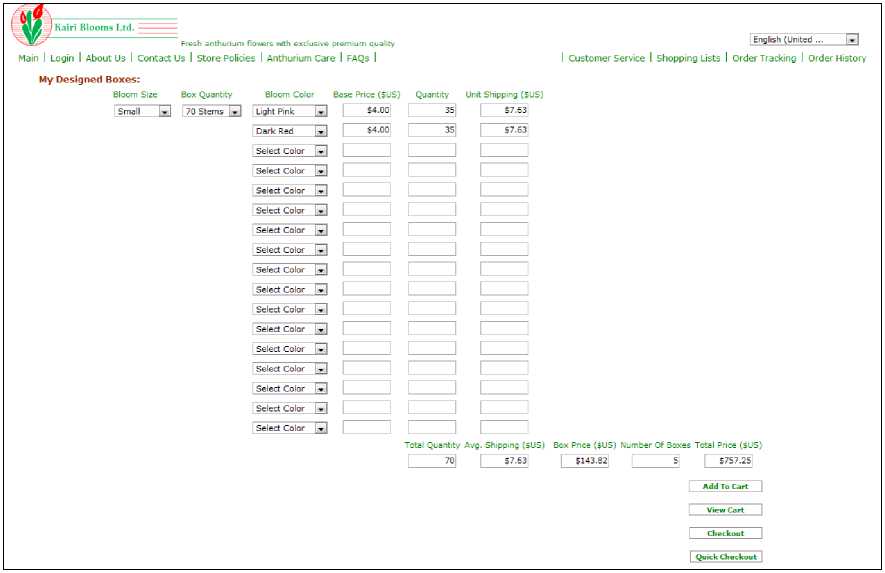
Fig. 6: Buy anthurium box
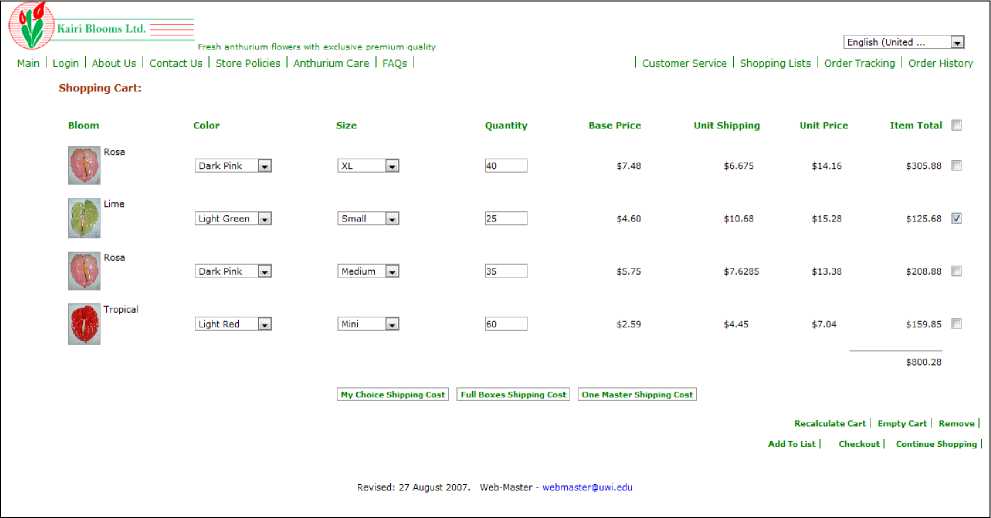
Fig. 7: View cart
For each of these three tasks the time and number of errors for performing the task and the percentage of tasks solved is recorded. The time taken to complete the tasks and checklist was on average 50-60 minutes per student. On Table 1 is shown some statistics based on the data collected.
Table 1: Mean and standard deviations of data measuring efficiency and effectiveness
|
Dimensions |
Measure |
Task 1 |
Task 2 |
Task 3 |
Total |
|
Time [min] |
Maximum |
25 |
25 |
26 |
57 |
|
Minimum |
3 |
3 |
2 |
13 |
|
|
Mean |
11 |
13 |
10 |
35 |
|
|
Standard Deviation |
5.40 |
4.82 |
4.74 |
9.00 |
|
|
% of solved task |
Maximum |
100 |
100 |
100 |
300 |
|
Minimum |
14 |
13 |
15 |
120 |
|
|
Mean |
89 |
90 |
86 |
268 |
|
|
Standard Deviation |
13.69 |
12.93 |
21.02 |
36.00 |
|
|
Errors |
Maximum |
12 |
10 |
10 |
28 |
|
Minimum |
0 |
0 |
0 |
0 |
|
|
Mean |
2 |
2 |
2 |
6 |
|
|
Standard Deviation |
2.26 |
1.97 |
2.26 |
5.00 |
By principal component analysis the weights of the dimensions of usability index efficiency, effectiveness and satisfaction were found as 0.20, 0.34 and 0.46 respectively.
-
B. GSO Results
The GSO algorithm used operates by evaluating a multi-input single-output (MISO) cost function. The cost function places values on each particle for ranking within the GSO algorithm. The optimization cost function accepted 52 input parameters and returned a single output parameter, representing the integrated index. For each data set the inputs was represented as: Integrated-Index = f(V1, V2, ..., V52), where Vij = response for question i of user j. On the left hand side of the equation the ‘Integrated Index’ term is a scalar value but represents a weighted sum of many individual hidden calculated terms. The function is able to meet the objectives of minimizing distance to target and reducing end velocity by using these hidden terms. The goal is to optimize a set of functions F(x) subject to a set of constraints C. Each function within is multiplied by a weight alpha and summed over the size of . The MISO can thus be solved using the standard weighed sum of objectives.
The problem space, for each epoch during the training of the neural network, is seeded with a population of particles (checklist items, ) over the range of interest. Each particle’s position in hyperspace represents a candidate problem solution. The optimization task was for the adjustment of the layer weights to get as close as possible to the targeted integrated index. Preceding the task the following parameters were controlled:
-
a. Number of particles (52)
-
b. Search range ( for each dimension was set to [0,1] )
-
c. Error goal (network output versus integrated index)
-
d. Seeding agent initial positions (user responses,V i )
-
e. Plotting and display options
-
f. Iterations to train (maximum set at 2000)
-
g. Minimization strategy (1e-0005)
For change detection in this GSO, the global best is polled every ten iterations to see if the position has remained the same depending on the number of disjoint groups that occurs during swarm formation. Each agent is updated according to the luciferin level update, glowworm movement and neighbourhood range update. Reducing the error goal using the minimization strategy was the optimization target for the GSO. The stopping criterion was based on the speed of convergence to this desired error goal. On Figures 8 and 9 are shown how long the algorithm took to converge to an acceptable optimal solution, using different data sets, by showing changes to the global best as training progressed.
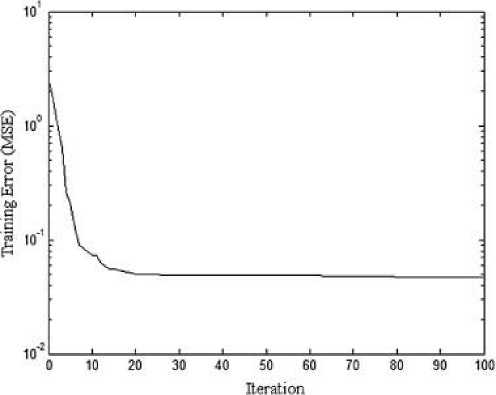
Fig. 8: GSO training performance for N=12 data set
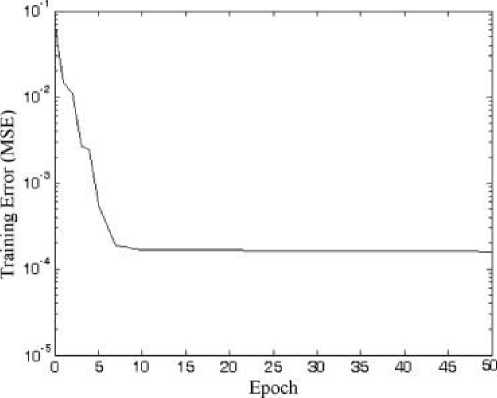
Fig. 9: GSO training performance for N=34 data set
The final question weights and layer weights were recorded for the training set that showed most promise, that is, the lowest mean squared error (MSE). As can be seen on Figure 8 and 9 the algorithm converged to a desired solution faster for the N=34 data set.
-
C. GSO Results Analysis
The analysis done on the GSO Approaches was guided by the fact that the neural network used for the algorithms was partially connected, Figure 3. In effect the bottom-up checklist item, dimension and usability index calculations were similar to the summation effect of the transfer function that was used during neural network processing. The calculation of the usability index was the target value.
The average value for each checklist item was obtained. The result of the neural network processing from either approach was item and dimension weights. Using these weight-value pairs a value was calculated for the relevant dimension. In a similar fashion the dimension values and weight pairs were combined to produce the usability index. The value of the usability index was 2.35. The average value of the integrated indices obtained from each test participant was 2.47, the calculated usability index.
While there is substantial literature on how to conduct usability evaluations (for example, [29], [37], [12], [27], [34], little attention has been paid to the way that usability evaluations lead to recommendations for changes. This is a critical step in making sure that the results of evaluations have an appropriate impact on product development. If the translation from problem to solution is flawed, or if the recommendations are not taken seriously by the product team, a usability evaluation is a costly step that may have little impact on the product [13]. The severity ratings of usability problems were defined [30] and adapted as follows:
Table 2: Severity Rating for Usability checklist items
|
Rating |
Description |
Range |
Color |
|
None |
no observed usability problems |
[ai) |
Dark Green |
|
Cosmetic |
the usability problem delayed users slightly |
[L2) |
Light Green |
|
Serious |
the usability problem was one that slowed down users significantly but did allow them to complete their task |
[2.3) |
Yellow |
|
Catastrophe |
a usability problem that prevented the user from completing a task |
[ЗЛ] |
Red |
Obtaining the dimensions and checklist items which contributed the most to the usability index was of primary concern at this stage of the project. As displayed on Figure 12, the checklist item, dimension and usability index value(s) were calculated and rated according to the scale by Nielsen [30]. The resulting ratings were used to suggest improvements to the system (cf. Figure 10 and 11).
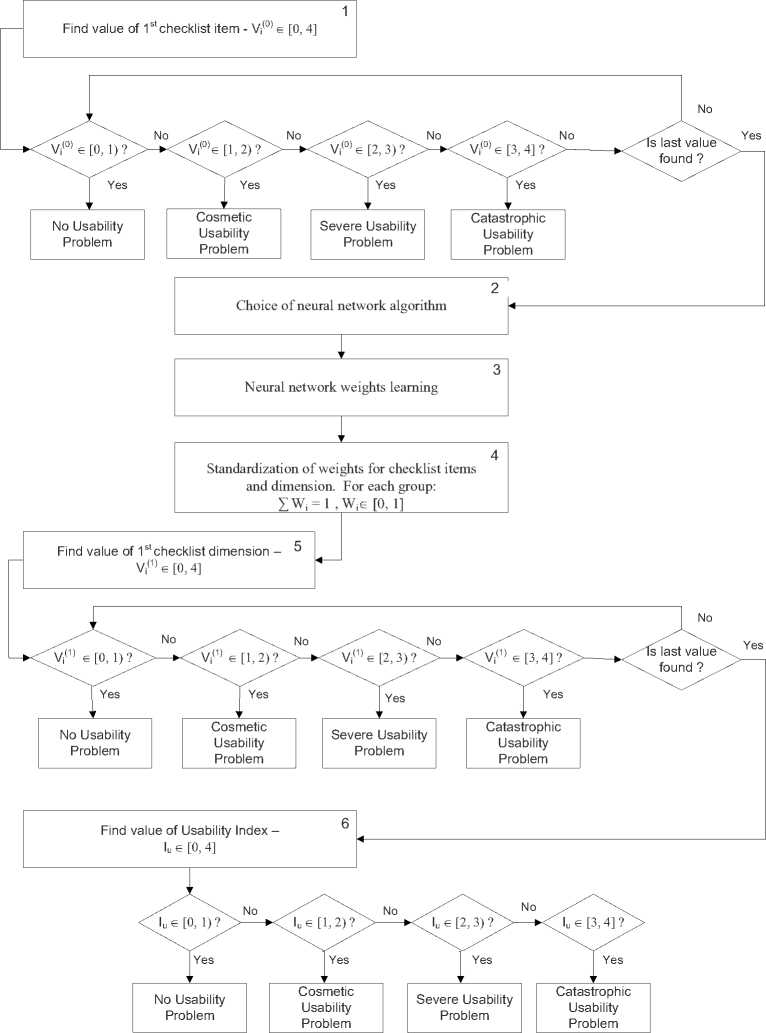
Fig. 10: GSO Value Analysis
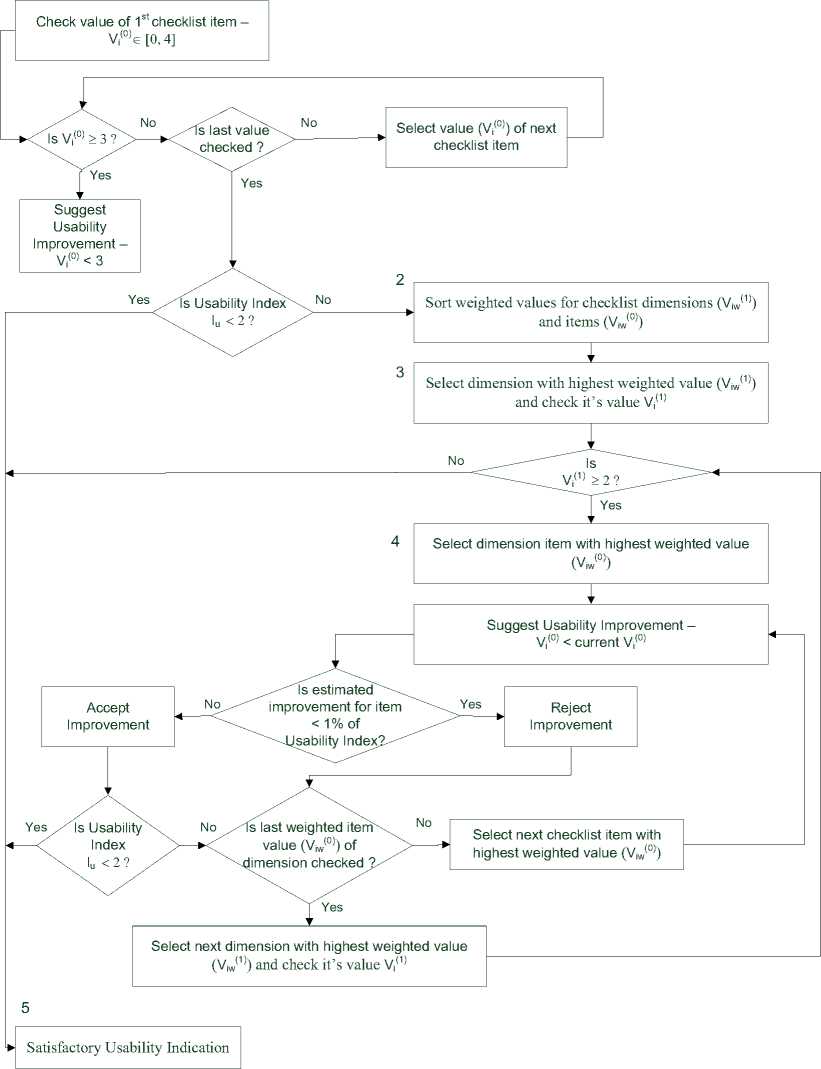
Figure 11: GSO Usability Estimation Improvement Algorithm
The steps of this algorithm were for the GSO method. The most critical dimensions affecting eCommerce usability using the GSO Approach were:
-
V security/privacy
-
V personalization
-
V website performance
-
V error handling
-
V enjoyment/satisfaction
For any usability analysis, expert opinion is essential. Because of this, the results obtained by the two approaches, will assist the expert in analyzing important usability areas to focus on for a given system. The reduction in the number of dimensions and eventually questionnaire items can be compared to a backtracking search algorithm (the expert is guided by the results as to which items are more important, when considering the usability of the system). With reduced number of items/dimensions to evaluate, the eventual evaluation of the system will be faster.
-
IV. Conclusions
A method for adaptive usability evaluation of eCommerce systems GSO was proposed. It includes a checklist and a neural networks-based model for evaluation of eCommerce usability. A case study confirmed GSO applicability for measuring and allocation of usability problems. The advantages of the approach are: (1) measuring by GSO checklist of both usability and quality of eCommerce systems; (2) adaptive selection of most significant usability dimensions and items and thus significant reduction of the time for usability evaluation and design.
References A Glowworm Optimization Method for the Design of Web Services
- Barnes, S. J., and Vidgen R. “WebQual: an exploration of Web site quality.” European Conference in Information Systems, Vienna, 2000.
- Bauer, H, Falk, T, and Hammerschmidt, M. eTransQual: A transaction process-based approach for capturing service quality in online shopping. University of Mannheim, Business School, Mannheim Germany, 2006.
- Bevan, N. and Macleod, M. Usability measurement in context, Behaviour and Information Technology, Taylor & Francis Ltd., Basingstoke, UK, 1(2), 1994.
- Krishnanand, K.N., Ghose, D. Glowworm swarm optimization for simultaneous capture of multiple local optima of multimodal functions. Swarm Intellignence, SpringerLink. 3(2):87-124, 2009.
- Boshoff, C. A Psychometric assessment of E-S-QUAL: A scale to measure electronic service quality. Department of Business Management, University of Stellenbosch, Stellenbosch, South Africa, 2007.
- Charitou, A., Georgiou I., Soteriou, A. Online Quality and Internet Stock Performance. Department of Public and Business Administration, University of Cyprus, WSSQ, 2005.
- Chen, Q., and Wells, D., W. “Attitude Toward the Site.” Journal of Advertising Research, 39: 27-37, 1999.
- Chiew, T., Salim, S. WEBUSE: Web site Usability Evaluation Tool. Department of Software Engineering, Faculty of Computer Science and Information Technology, University of Malaya. Malaysian Journal of Computer Science Vol. 10(1): 47-57, 2003.
- Christophersen, T., Balazs, B. Usability Questionnaire for On-line Stores. University Kiel, Department of Psychology, Germany and University of Berlin, Department of Psychology, Germany, UFOS, 2003.
- Cole, M., O’Keefe, R. M., Siala, H. From the user interface to the consumer interface. Information Systems Frontiers, 4(1): 349-361, 2000.
- Comrey, A. A First Course in Factor Analysis. Academic Press, New York, 1973.
- Dumas, J.S., & Redish, J.C. A Practical Guide to Usability Testing. Bristol, UK: Intellect Books, 1999.
- Dumas, J.S., Molich, R., & Jeffries, R. Describing Usability Problems: Are We Sending the Right Message? Interactions, 11(4): 24-29, 2004.
- Dzida, W., Hofmann B., Freitag R., Redtenbacher W., Baggen R., Zurheiden C., Beimel J., Hartwig R., Hampe-Neteler W., Peters H. GMD German National Research Center for Information Technology, Institute for Autonomous Intelligent Systems, Dortmund, Germany, 2000.
- Grönroos, C. Strategic Management and Marketing in the Service Sector. Swedish School of Economics and Business Administration, Helsingfors, 1982.
- Hair, J. F. Jr., Anderson, R. E., Tatham, R. L., Black, W. C. Multivariate Data Analysis, 5th ed., Prentice-Hall, Upper Saddle River, NJ, 1998.
- Hornbaek, K, Current Practice in Measuring Usability: Challenges to Studies and Research, International Journal of Human-Computer Studies, 64: 79-102, 2006.
- ISO 9241-11, Ergonomic Requirements for Office Work With Visual Display Terminals (VDTs) - Part 11: Guidance on Usability, Geneva, Switzerland, 1998.
- J. Kirakowski, J., and Cierlik, B. Measuring the usability of web sites. Proceedings of Human Factors and Ergonomics Society, 42nd Annual Meeting, Santa Monica, CA, 1998.
- Kalakota R., and Whinston, A. Electronic Commerce: A Manager's Guide, Addison-Wesley, 1997.
- Kaynama S., and Black, C. I. “A proposal to access the service quality of online travel agencies.” Journal of Professional Services Marketing, 21(1): 63-88, 2000.
- Keevil, B. Measuring the Usability Index of Your Web Site, Keevil & Associates, Toronto, Ontario, Canada, 1998.
- Leung, C., Fung, M.W. "Assessing perceived service quality of casual-wear chain stores", Journal of Fashion Marketing and Management, 1 (1): 26-49, 1996.
- Lewis, R. J. IBM Computer Usability Satisfaction Questionnaires: Psychometric Evaluation and Instructions for Use. Technical report 54.786, Human Factors Group, Boca Raton, FL, PSSUQ, 1993.
- Loiacono, T. E., Watson T. R., Goodhue L., D. WebQualTM: A Measure of Web Site Quality, 2002.
- Madu, N C, Madu. International Journal of Quality & Reliability Management, 19(3): 246-258, 2002.
- Mayhew, D. J. The Usability Engineering Lifecycle. San Francisco, CA: Morgan Kaufman, 1999.
- Minocha, S., Dawson, L., Roberts, D., Petre, M. E-SEQUAL, A Customer-Centered Approach to Providing Value in ECommerce Environments. Department of Computing, Faculty of Mathematics and Computing, The Open University, Walton Hall, Milton Keynes, MK7 6AA, United Kingdom, 2004.
- Nielsen, J. Usability Engineering. San Diego, CA: Academic Press, 1993.
- Nielsen, J. Cost of User Testing a Website. Alertbox for May 3, 1998.
- Nielsen, J., Molich, R., Snyder C., and Farrell, S. ECommerce User Experience, Nielsen Norman Group, Fremont, CA, 2001.
- Parasuraman, A., Zeithaml, V. A., Berry, L. L. “SERVQUAL: a multi-item scale for measuring consumer perceptions of the service quality.” Journal of Retailing, 64 (1): 12-40, 1998.
- Parasuraman, A., Zeithaml, V. A., Malhotra, A. “E-S-QUAL: a multiple item scale for accessing electronic service quality.” Journal of Service Research, 7(3): 213-233, 2005.
- Preece, J., Rogers, Y. & Sharp, H. Interaction Design: Beyond Human-Computer Interaction. John Wiley, 2002.
- Preece, J., Rogers, Y., & Sharp, H. Interaction Design. New York, NY: John Wiley, 2002.
- Reichheld, F. F. and Schefter, P. “E-loyalty, your secret weapon on the web.” Harvard Business Review, 2000.
- Rubin, J. Handbook of Usability Testing. New York, NY: John Wiley, 1994.
- Rudie, M.J., Wansley, H. "The Merrill Lynch Quality Program", in Bloch, T., Upah, G. and Zeithaml, V. (Eds), Services Marketing in a Changed Environment, American Marketing Association, Chicago, IL, 1985.
- Rumelhart, D. E., Hinton, G. E., & Williams, R. J. (Eds.). Parallel Distributed Processing: Exploration in the Microstructure of Cognition. Cambridge MA: MIT Press, 1986.
- Shackel, B., 1984. The concept of usability. Visual Display Terminals, pp. 45-48. Eaglewood Cliffs, NJ: Prentice-Hall.
- Shop.org "Statistics: e-business trends", available at: www.shop.org/learn/stats _ebizz_cs.html (accessed November 26, 2007), 2003.
- Van den Bergh, F. and Engelbrecht, A. P. Cooperative Learning in Neural Networks using Particle Swarm Optimizers. South African Computer Journal. (26):84-90, 2000.
- Wachter, K. "Longitudinal assessment of web retailers: issues from a consumer point of view", Journal of Fashion Marketing and Management, 6(2): 134-45, 2002.
- Wolfinbarger, M., and Gilly, M. C. “eTailQ: dimensionalizing, measuring and predicting retail quality.” Journal of Retailing, 79(3): 183-98, 2003.
- Wolfinbarger, M., Gilly, M. .comQ: Dimensionalizing, Measuring and Predicting Quality of the E-tail Experience. Center for Research on Information Technology and Organizations, 2002.
- Yang, Z., Peterson, R. T., Huang, L. Taking the Pulse of Internet Pharmacies. Marketing Health Services, Summer, pp. 5-10, 2001.
- Yao, X. A review of evolutionary artificial neural networks. International Journal of Intelligent Systems. 4: 203-222, 1993.
- Yoo, B., and Donthu, N. Developing a scale to measure the perceived quality of an internet shopping site (SITEQUAL).” Quarterly Journal of Electronic Commerce, 2(1) 31-46, 2001.
- Zeithaml, V. A., Parasuraman, A., Malhorta, A. “E-service quality: definitions, dimensions and conceptual model.” Working Paper, Marketing Science Institute, Cambridge, MA, 2000.
- Zeithaml, V. A., Parasuraman, A., Malhotra, A. Service Quality Delivery through Web Sites: A Critical Review of Extant Knowledge. Journal of the Academy of Marketing Science, 30(4): 362-375, 2002.
