A Machine Learning Based Intelligent Diabetic and Hypertensive Patient Prediction Scheme and A Mobile Application for Patients Assistance

Author: Md. Amdad Hossain, Mahfuzulhoq Chowdhury
Journal: International Journal of Information Technology and Computer Science @ijitcs
Article in issue: 4 Vol. 16, 2024.
Free access
The inaccurate detection of diabetes and hypertension causes’ time wastage and a cost burden due to higher amounts of medicine intake and health problems. The previous works did not investigate machine learning (ML)-based diabetic and hypertension patient prediction by using multiple characteristics. This paper utilizes ML algorithms to predict the presence of diabetes and hypertension in patients. By analyzing patient data, including medical records, symptoms, and risk factors, the proposed system can provide accurate predictions for early detection and intervention. This paper makes a list of eighteen characteristics that can be used for data set preparation. With a classification accuracy of 93%, the Support Vector Machine is the best ML model in our work and is used for the diabetic and hypertension disease prediction models. This paper also gives a new mobile application that alleviates the time and cost burden by detecting diabetic and hypertensive patients, doctors, and medical information. The user evaluation and rating analysis results showed that more than sixty five percent of users declared the necessity of the proposed application features.
Diabetic and Hypertension, Disease Prediction, Machine Learning, Time and Cost Burden, Mobile Application, Treatment Suggestion, Doctor Search, Medicine Suggestion
Short address: https://sciup.org/15019399
IDR: 15019399 | DOI: 10.5815/ijitcs.2024.04.02
Text of the scientific article A Machine Learning Based Intelligent Diabetic and Hypertensive Patient Prediction Scheme and A Mobile Application for Patients Assistance
The Diabetes and hypertension can be known as the two most common chronic disorders in Bangladesh and throughout the world [1]. Diabetes and hypertension can cause a variety of symptoms, including high blood sugar, weight loss, fatigue, headache, and dizziness. According to recent estimates, 8.4 million Bangladeshis, or 5.25% of the population, have diabetes. A survey showed that almost 20 percent Bangladeshi peoples have syndromes like high blood pressure. This reason cause’s hypertension is the most frequent chronic disease, which requires healthcare support and treatment. Diabetes and hypertension frequently coexist, and both are risk factors for cardiovascular disease [2]. Type 2 diabetics can cause cardiovascular problems like diseases associated with coronary heart problems and stroke [3]. Recent diabetes and hypertension cost studies have produced an estimate by assessing nation-wise expenses rather than patient-wise expenses [4-15]. Very few studies have incorporated the patient-wise healthcare expenses of diabetes treatment [9,15]. At present, diabetes and hypertension patients suffered from huge costs due to self-knowledge based and huge amounts of medicine usage, physical checkups, doctors, and medicine fees.
The existing studies did not incorporate all direct and indirect costs associated with diabetes and hypertension disease treatment such as doctors’ fees, medicine fees, transport fees, and hospital fees, among others [10,12]. Currently, diabetic and hypertension patients do not want to take doctors’ advice due to the high number of doctors’ fees. They generally visit a medicine shop and buy a list of medicine based on local medicine shop owner’s advice. To reduce the cost burden of diabetes and hypertension patients, an automated system for patient assistance with diabetic and hypertension patient prediction, medicine suggestion, doctor search, and appointment booking is necessary. Health insurance claims were used to examine annual resource consumption and expenditures (including inpatient, outpatient, laboratory, and pharmacy services). A recent study shows that people with diet-controlled diabetes (with body mass index or BMI of 30 kg/meters squared) and without neuropathy, or cardiovascular problems had yearly experience direct medical care expenses of 1700 and 2100 USD respectively [4]. Baseline expenses were greater for patients who also had high blood pressure. The current studies calculated and compared the average yearly healthcare expenses of people with individual diabetes issues, individual hypertension disorders, or both. Most of the previous calculation was done by taking an interview with people without real time diabetes and hypertension illness. The previous research was done by taking into account claiming data rather than direct medical expenditure data. The cost and time burden of diabetic and hypertensive patients can vary based on several factors, including the severity of the condition, treatment options, healthcare systems, and individual circumstances. The cost and time burden of diabetic and hypertensive patients associated with several conditions.
Both diabetic and hypertensive patients may require ongoing medication to manage their conditions. The cost of medications can vary depending on factors such as brand, dosage, insurance coverage, and availability of generic alternatives. Regular visits to healthcare providers for monitoring, check-ups, and specialized consultations can contribute to the cost burden. This includes costs associated with co-pays, diagnostic tests, and follow-up visits. If diabetic or hypertensive patients develop complications or require hospitalization, the associated medical expenses can significantly increase the cost burden. Dietary changes, exercise programs, and other lifestyle modifications recommended for managing these conditions may involve additional costs, such as gym memberships, dietary supplements, or specialized foods. There are several time burden issues too associated with diabetic and hypertensive patients. Diabetic and hypertensive patients often need to schedule regular appointments with healthcare providers to manage their conditions. These appointments may involve waiting times, travel time, and time spent with healthcare professionals. Managing diabetes and hypertension often requires self-monitoring of blood sugar levels, blood pressure, and other parameters. This can involve regular testing at home, tracking results, and adjusting treatment plans, which can consume time and effort. Acquiring knowledge about the conditions, attending education programs, and seeking support from healthcare professionals or support groups may require additional time commitments. Incorporating lifestyle changes such as dietary adjustments and exercise routines can require time for shopping, meal preparation, and physical exercise, among others.
At present, there exist some literature works [6-15] associated with either diabetic or hypertension disease identification and treatment. But they did not prepare a real-time data set by taking into account both diabetic and hypertension symptoms. At present, there is no assistance system available in the literature (e.g., [16-25]) that would be helpful to reduce the time and cost burden of diabetic and hypertensive patients. The works in [24] and [25] indicated that the early stage detection of diabetes and hypertension using a machine learning-based automated system could reduce the risk and help the patients with timely prevention of such diseases with proper treatment suggestions, respectively.
The existing system did not employ any suitable machine learning model selection scheme for both diabetic and hypertensive patients by examining KNN Algorithm, Decision Tree, Support Vector Machine (SVM), Random Forest, and AdaBoost Algorithm [5], Gradient Boosting Algorithm, and Gaussian Naive Bayes Algorithm. An android-based mobile application with diabetes and hypertensive patient’s identification, doctor’s suggestion, doctor’s appointment booking, medicine suggestions, and health suggestions is missing in the literary works. In the current study, we estimated yearly costs for hospitals and emergency patient care unit service, clinics, transport, doctors, and pharmaceuticals fees. The findings of this paper can be beneficial for healthcare professionals, patients, insurance companies, doctors, and policymakers to reduce the time and cost burden associated with diabetic and hypertension patient treatment. The eminent contributions of this paper are discussed as follows:
This work prepares a data set for diabetic and hypertensive patients’ treatment by taking into account their symptoms and factors. (ii) This paper selects a suitable machine-learning model for both diabetic and hypertensive patient prediction by assessing accuracy precision, recall, F1 score of the KNN Algorithm, Decision Tree, Support Vector Machine (SVM), AdaBoost Algorithm, Random Forest, Gradient Boosting Algorithm, and Gaussian Naive Bayes Algorithms. (iii) This work gives a mobile application for diabetic and hypertensive patients’ assistance by taking into account diabetic and hypertension patient identification, doctor’s search, medicine suggestions, and general health care suggestions. (iv) This work also gives a time and cost burden comparative analysis regarding diabetic and hypertension patients for both the existing system and the proposed system. This work also gives a user survey-based application rating analysis by examining the application features. Next, related works are given in Section 2. Section 3 elaborates on the proposed scheme. The mobile application is discussed in Section 4. The evaluation results are discussed in Section 5, and the conclusion is provided in Section 6.
2. Related Works
This literature review section will present the related works regarding diabetes and hypertension disorder treatment. In [6], the authors discussed that the best way to take care of this disease is to stick to their treatments, make changes to how you live, and keep an eye on them regularly. Because of how hard these diseases are on both people and the healthcare system, new ways to save time and money are needed. In the work [7], the authors utilized machine learning technology for diabetes management (e.g., random forest, decision tree). The system uses data from patients’ electronic health records to predict their risk of developing complications. The system also recommends the best treatment plan for each patient based on their risk factors. They prepared a dataset of 100 patients with diabetes. Their system can accurately predict the risk of complications in patients. The dataset included information on the patient’s age, gender, blood sugar levels, blood pressure, and other risk factors. The system was evaluated using a holdout dataset of 20 patients with diabetes. The system also recommended the correct treatment plan for most patients. The accuracy of their work is 85%.
In the work [8] , the authors evaluated the effectiveness of a mobile application only for diabetes self-management among individuals in Bangladesh. The study aims to assess how the use of a mobile application impacts glycemic control, medication adherence, and self-care practices among participants with type 2 diabetes. The work is likely to talk about the strategy and methods of the randomized controlled trial, such as the process of recruiting participants, the way the randomization works, and the protocol for the intervention. It could also tell you about the mobile app itself, its features, and how it helps you handle your diabetes. The results and findings of the trial, such as the effect of the mobile app on glycemic control, medication adherence, and self-care habits, would be written up in the paper. In [9] , the authors discussed several high-cost factors of diabetes care in Bangladesh, such as the high cost of medications, the lack of access to affordable insulin, and the high cost of hospitalization. They also discussed the challenges of managing diabetes in Bangladesh, such as the lack of trained healthcare providers and the lack of awareness about diabetes.
The authors concluded that automated diabetes care is necessary to ensure health care and reduce the cost burden. In [10] , the authors used classification on different kinds of information to figure out if a person has diabetes or not. The data set for diabetic patients is made by getting information from the hospital warehouse, which has two hundred cases with nine characteristics. They used both blood tests and pee tests based datasets. They used a 10-fold cross-validation method. The results are then compared. They used some machine learning classifiers such as naive Bayes, J48, and REP tree. They showed that J48 works best with an accuracy of 60.2%. In [11] , the authors used a decision tree algorithm for diabetes prediction. The authors also focused on the class imbalance problem that reduces the accuracy rates. In [12] , the authors proposed a logistic regression-based machine-learning approach for predicting hypertension using the CPCSSN dataset (i.e., the Canadian Primary Care Sentinel Surveillance Network dataset). They showed that the logistic regression-based machine learning approach achieves an accuracy of 82%. The authors conclude that machine learning is a promising approach for predicting hypertension patients. In [14] , the authors created a machine learningbased predictive model for diabetic complications, with excellent accuracy in predicting complications like retinopathy and nephropathy. By using algorithms for machine learning, doctors can look at a wide range of patient data, such as their medical background, lifestyle choices, and real-time health parameters. In [15] , the authors discussed the factors that are contributing to the increase in diabetes and hypertension diseases, such as urbanization, changing dietary patterns, and increasing obesity rates. They also discussed the challenges of preventing and controlling diabetes and hypertension in primary healthcare settings in these regions, such as limited resources and a lack of trained healthcare providers. In [16] , the author proposed a deep learning approach for predicting diabetes. The deep neural network is a type of machine learning algorithm that can learn complex patterns in data. The performance and ability of the deep learning model heavily rely on the quality and representativeness of the dataset used for training. The limitations of their work are that the dataset used is small, imbalanced, or not fully representative of the target population.
However, unlike previous works, this paper collects a commendable real-time dataset from diabetic and hypertensive patients. In contrast to previous literary works, this paper also proposes a machine learning-based diabetic and hypertension disease prediction scheme, as well as a mobile application for patient assistance. Existing research has not produced a machine learning-based system that predicts both diabetic and hypertensive disease status, as well as a mobile application that provides patients with necessary support such as doctor information, medication recommendations from doctors, and disease treatment recommendations, among other things.
3. Proposed Scheme
Our proposed scheme consists of a machine learning based prediction model for diabetic and hypertensive patient detection. The proposed scheme also includes an android mobile application for diabetic and hypertensive patient assistance.
-
3.1. System Design
-
3.2. Steps for Data Collection and Data Set Preparation
For predicting if one’s patient is diabetic and hypertensive or not, we have built an ML model using several classification algorithms. We have used machine learning algorithms like the Random Forest (RF), Gradient Tree Boosting, Decision Tree (DT), Support Vector Machine (SVM), Naive Bayes, Adaboost, and KNN Algorithm.
Random Forest machine learning creates decision trees from random subsets of training data. To train each tree, a bootstrap sample is randomly selected from the primary training data with replacement. KNN algorithms select a k value that distances data points from the nearest neighbor. A decision tree resembles a flowchart. A decision tree's interior nodes represent features, branches represent rules, and leaf nodes provide the algorithm's output. SVMs aim to maximize the difference in margin between training data classes by identifying the optimal hyper plane. The hyper plane serves as a decision boundary, categorizing data points accordingly. The support vector model (SVM) identifies data points closest to the decision border. Adaboost combines weak or basic learners to create a stronger learner capable of making accurate predictions. AdaBoost trains weak learners sequentially on increasingly complex training data. During training, the algorithm prioritizes challenging examples by giving higher weight to misclassified data points from previous iterations. Gaussian Naive Bayes relies on the assumption of feature independence to calculate conditional probabilities for each feature within a class. It calculates the mean and standard deviation of each feature for each class during training. The algorithm employs Bayes' theorem to determine the posterior probability of each class based on the features. Fig. 1 represents the ML model framework. First of all, we collected data from several surveys and then created a dataset. After cleaning the data and processing the dataset, we split the data into training data and testing data. After that, we will use the data from the training set to train the model, and we will also use the testing set to test the model. Following training with the provided training data and testing with the provided testing data, we have selected the predictive model that has shown the highest level of accuracy as the best option.
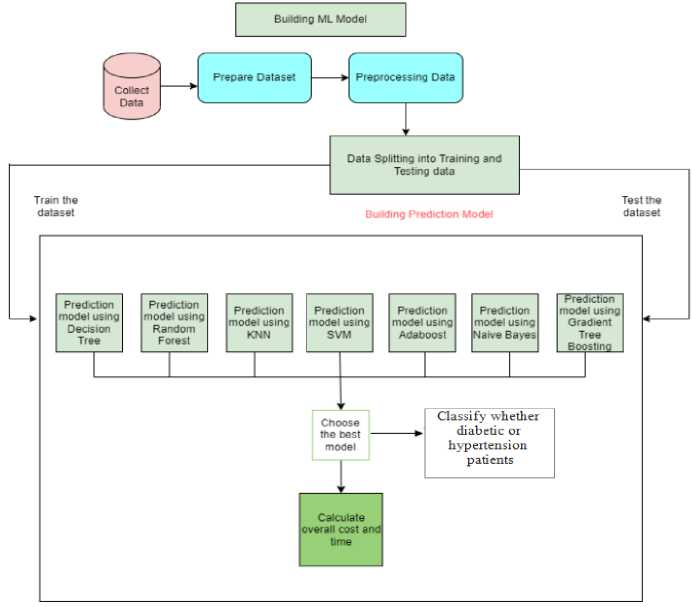
Fig.1. Machine learning model framework for diabetic and hypertension patient prediction scheme
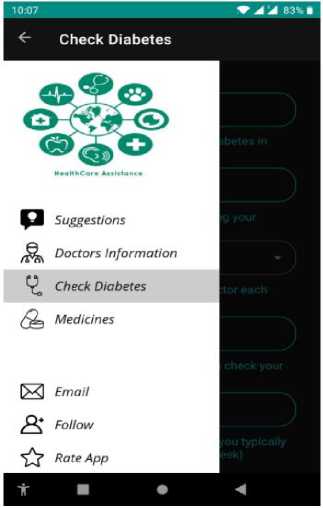
Fig. 2 represents the process flow diagram of our Android mobile application. The user opens the app HealthCare Assistance and is presented with the Start screen. If the user is already logged in, they are taken to the home fragment. Otherwise, they are taken to the Login page. To log in, the user enters their email address and password. If the email address is valid, the user is taken to the home fragment. If the user is new, they must create an account. After login, they can access the home page. In the Home fragment, the user can find four interfaces: Find Out, Doctor Info, Suggestion Box, and Medicine Names. If the user wants to find out if they are diabetic or hypertensive, they click on Find Out. They are then taken to the Prediction interface, where they must fill out the required information. The result is then predicted using a machine-learning model. There are other options in the home fragment. The Doctor Info interface provides information about doctors who can help diabetic and hypertensive patients. The Suggestion Box interface lists tips for diabetic and hypertensive patients.
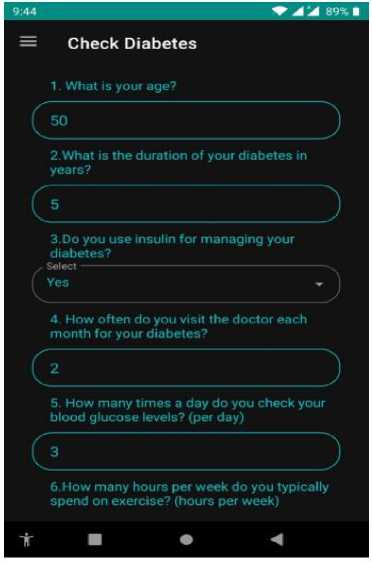
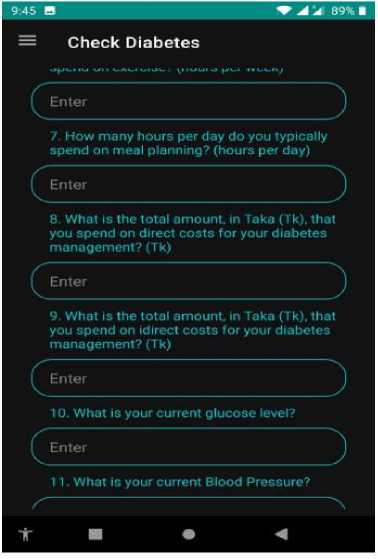
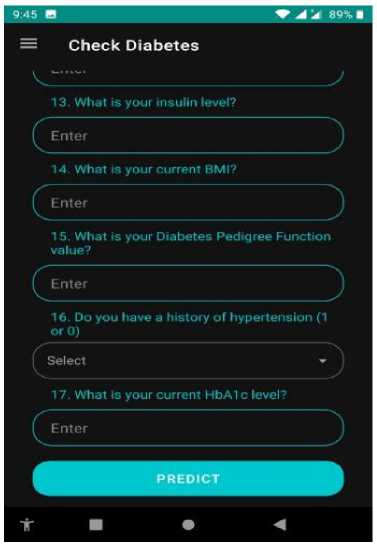
The first step of our ML-based prediction model is dataset collection via a survey questionnaire. We have collected information on diabetes and hypertension from several sources. Fig. 3 shows the sample screenshots of our data set. The features of this dataset (asked questions in the survey) were: What is your age?, What is the duration of your diabetes in years?, Do you use insulin for managing your diabetes?, How often do you visit the doctor each month for your diabetes?, How many times a day do you check your blood glucose levels?, How many hours per week do you typically spend on exercise?, How many hours per day do you typically spend on meal planning?, What is the total amount, in Taka (Tk), that you spend on direct costs for your diabetes management?, What is the total amount, in Taka (Tk), that you spend on direct costs for your diabetes management?, What is your current glucose level?, What is your current
Blood Pressure?, What is your skin thickness measurement?, What is your insulin level?, What is your current BMI?, What is your Diabetes Pedigree Function value?, Do you have a history of hypertension?, and What is your current HbA1c level?. The dataset comprises 779 responses collected from a survey that aims to design a lifestyle conducive to achieving a healthy life. The survey consists of 18 questions that explore various aspects of lifestyle choices. Each row in the dataset represents a unique respondent, resulting in a total of 779 rows. The 18 columns in the dataset correspond to the survey questions and capture the respondents’ answers regarding their diabetes and hypertensive symptoms, as well as their reported lifestyle factors. This dataset focuses specifically on individuals who have diabetes and hypertensive symptoms. These attributes provide insights into the patients’ conditions and help understand how diabetes and hypertension affect their lives.
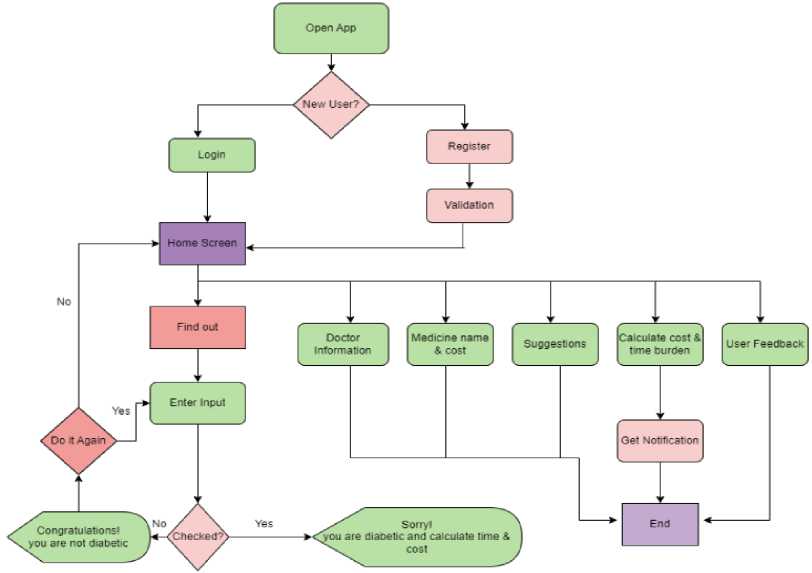
Fig.2. Process flow diagram of diabetic and hypertension assistance mobile application
|
А |
В с |
D |
E |
F |
G |
H |
1 J К |
L |
M |
N |
0 |
P |
Q |
R |
s |
T |
||||
|
1 |
Аве |
Duration с Insuline U |
Doctor Vis Blood Glue Time Spen Time Speo Direct Cos Indirect Ct Glucose |
Blood Pres |
SkinThickn |
nsulin |
BMI |
DiabetesP |
Outcome |
Hypet sent HbAlcJevel |
||||||||||
|
2 |
50 |
5 No |
2 |
3 |
2 |
1 |
1000 |
200 |
148 |
72 |
35 |
0 |
33.6 |
0.627 |
1 |
0 |
6.6 |
|||
|
3 |
31 |
3 Yes |
4 |
5 |
1 |
0.5 |
3000 |
300 |
85 |
66 |
29 |
0 |
26.6 |
0.351 |
0 |
0 |
6.6 |
|||
|
4 |
32 |
2 No |
1 |
2 |
3 |
1.5 |
1500 |
250 |
183 |
64 |
0 |
0 |
23.3 |
0.672 |
1 |
0 |
5.7 |
|||
|
5 |
21 |
4 No |
2 |
4 |
1 |
0.75 |
1000 |
150 |
89 |
66 |
23 |
94 |
28.1 |
0.167 |
0 |
0 |
5 |
|||
|
6 |
33 |
7 Yes |
4 |
3 |
2 |
1 |
5000 |
200 |
137 |
40 |
35 |
168 |
43.1 |
2.288 |
1 |
1 |
4.8 |
|||
|
7 |
30 |
3 No |
2 |
2 |
1 |
0.5 |
2000 |
150 |
116 |
74 |
0 |
0 |
25.6 |
0.201 |
0 |
0 |
6.6 |
|||
|
8 |
26 |
5 Yes |
2 |
3 |
1 |
0.75 |
3000 |
400 |
78 |
50 |
32 |
88 |
31 |
0.248 |
1 |
0 |
6.5 |
|||
|
9 |
29 |
4 Yes |
2 |
2 |
2 |
0.5 |
2500 |
500 |
115 |
0 |
0 |
0 |
35.3 |
0.134 |
0 |
0 |
5.7 |
|||
|
Ю |
53 |
8 NO |
1 |
3 |
1 |
1 |
3000 |
350 |
197 |
70 |
45 |
543 |
30.5 |
0,158 |
0 |
0 |
4.8 |
|||
|
И |
54 |
9 Yes |
4 |
3 |
2 |
1 |
7000 |
1000 |
125 |
96 |
0 |
0 |
0 |
0.232 |
1 |
0 |
5 |
|||
|
12 |
30 |
2 NO |
3 |
3 |
3 |
0,25 |
4500 |
700 |
110 |
92 |
0 |
0 |
37.6 |
0.191 |
0 |
0 |
6.1 |
|||
|
«3 |
34 |
3 No |
2 |
4 |
2 |
0.5 |
2800 |
1200 |
168 |
74 |
0 |
0 |
38 |
0.537 |
1 |
0 |
6 |
|||
|
14 |
57 |
7 Yes |
4 |
3 |
1 |
0.75 |
3500 |
600 |
139 |
80 |
0 |
0 |
27.1 |
1.441 |
0 |
0 |
5 |
|||
|
15 |
59 |
12 No |
3 |
2 |
2 |
1 |
4000 |
800 |
189 |
60 |
23 |
846 |
30.1 |
0.398 |
1 |
0 |
5.8 |
|||
|
6 |
51 |
6 Yes |
4 |
3 |
2 |
1 |
5500 |
1100 |
166 |
72 |
19 |
175 |
25.8 |
0.587 |
1 |
0 |
5 |
|||
|
17 |
32 |
2 No |
2 |
2 |
1 |
0.75 |
4400 |
700 |
100 |
0 |
0 |
0 |
30 |
0.484 |
1 |
0 |
6.6 |
|||
|
(8 |
31 |
4 Yes |
4 |
3 |
2 |
1 |
8000 |
1500 |
118 |
84 |
47 |
230 |
45.8 |
0.551 |
1 |
0 |
6.1 |
|||
|
19 |
31 |
3 No |
2 |
3 |
2 |
1 |
5000 |
900 |
107 |
74 |
0 |
0 |
29.6 |
0.254 |
1 |
0 |
5.7 |
|||
|
Ю |
33 |
4 No |
3 |
2 |
1 |
0.25 |
6000 |
1100 |
103 |
30 |
38 |
83 |
43.3 |
0.183 |
0 |
0 |
5.7 |
|||
|
>1 |
32 |
5 Yes |
3 |
3 |
2 |
0.75 |
5500 |
800 |
115 |
70 |
30 |
96 |
34.6 |
0.529 |
1 |
0 |
3.5 |
|||
|
>2 |
27 |
1 Yes |
3 |
4 |
3 |
2 |
9000 |
1300 |
126 |
88 |
41 |
235 |
39.3 |
0.704 |
0 |
0 |
6 |
|||
|
13 |
50 |
10 Yes |
4 |
4 |
2 |
1 |
1000O |
1500 |
99 |
84 |
0 |
0 |
35.4 |
0.388 |
0 |
0 |
6.2 |
|||
|
14 |
41 |
4 No |
3 |
3 |
2 |
0.5 |
4000 |
500 |
196 |
90 |
0 |
0 |
39.8 |
0.451 |
1 |
0 |
4.8 |
|||
|
15 |
29 |
1 No |
1 |
2 |
2 |
1 |
3000 |
700 |
119 |
80 |
35 |
0 |
29 |
0.263 |
1 |
0 |
6.5 |
|||
|
16 |
51 |
12 Yes |
4 |
4 |
3 |
1 |
9000 |
1500 |
143 |
94 |
33 |
146 |
36.6 |
0.254 |
1 |
0 |
4 |
|||
|
17 |
41 |
5 Yes |
3 |
3 |
2 |
0.75 |
7000 |
800 |
125 |
70 |
26 |
115 |
31.1 |
0.205 |
1 |
0 |
6.1 |
|||
Fig.3. Sample of dataset
-
3.3. Data Validation, Data Cleaning, and Data Preprocessing
Verifying the dataset with a specialist is a crucial step in ensuring the accuracy and reliability of research. We have verified the dataset with the help of three doctors (diabetic and hypertension specialists) from Chittagong medical college. We have decided on a majority voting policy. As part of this process of checking, three experts with specialized knowledge and professional experience were consulted. There are 7749 rows and 18 columns in this data set. The
experts examined the survey data to find out about the symptoms of diabetes and high blood pressure, changes in lifestyle, and the time and money burden. After that, they checked to make sure that the surveys used here are correct and met clinical standards. In the dataset, initially, categorical information was observed (after the completion of the survey). However, machine learning models typically require numerical data for analysis. To address this, we applied label encoding to convert the categorical data into numerical form. Additionally, we examined the dataset for missing values and fortunately found that no missing values were present. Consequently, no further steps were required to handle missing values in our dataset. Feature selection can reduce the number of input variables number in a model by focusing on relevant data and removing irrelevant information. In our context, numerous features are associated with the prediction task at hand.
X = standardized_data y = diabetes_dataset['Outcome']
X train, xtest, Y_train, Y test = train_test_split(X, Y, test_size=0.1, random state-70) scaler = StandardScaler()
X_train = scaler. fittransform(xtrain)
Xtest = scaler.transform(X_test)
model = RandomForestClassifier()
predictions = model.predict(Xtest)
print("Classification Report:")
print(с1assification report(Y_test, predictions))
print("Accuracy:", accuracy score(Y test, predictions))
classification Report:
|
precision |
recall |
fl-score |
support |
|
|
0 |
0.83 |
1.00 |
0.91 |
49 |
|
1 |
1.00 |
0.66 |
0.79 |
29 |
|
accuracy |
0.87 |
78 |
||
|
macro avg |
0.92 |
0.83 |
0.85 |
78 |
|
weighted avg |
0.89 |
0.87 |
0.86 |
78 |
Accuracy: 0.8717948717948718
-
Fig.4.Block of code and output of random forest
-
[29] X = standardized_data
Y = diabetes_dataset['Outcome']
X_train, X_test, Ytrain, Y_test - train_test_split(X, Y, test_size=0.2, random_state=90) scaler = StandardScaler()
x_train = scaler.fit_transform(x_train)
X_test = scaler.transform(X_test)
model = SVC()
predictions = model.predict(X_test)
print("Classification Report:")
print(classification_report(Y test, predictions))
print("Accuracy:", accuracy_score(Y_test, predictions))
Classification Report:
|
precision |
recall |
fl-score |
support |
|
|
0 |
0.92 |
1.00 |
0.96 |
11 |
|
1 |
1.00 |
0.75 |
0.86 |
4 |
|
accuracy |
0.93 |
15 |
||
|
macro avg |
0.96 |
0.88 |
0.91 |
15 |
|
weighted avg |
0,94 |
0.93 |
0.93 |
15 |
Accuracy: 0.9333333333333333
Fig.5. Block of code and output of SVM
-
3.4. Building Machine Learning Model
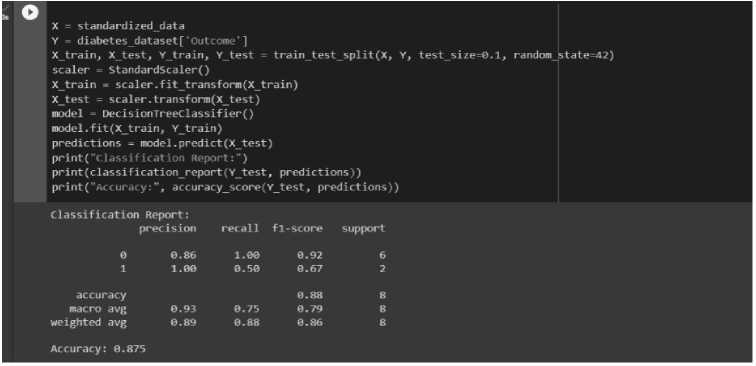
In this step, we have divided our main dataset into training subsets (75%) and testing subsets (25%). Multiple machine learning classification algorithms (e.g., KNN, Decision Tree, Adaboost, Gradient Tree Boosting, SVM, Random Forest, and Naive Bayes) are employed to train the model. Each algorithm is trained, and its accuracy is evaluated. The objective is to identify the most effective classifier for our dataset. Based on the results of the assessment matrices, the best model has been selected. We have used the grid search technique to fine-tune the classification algorithm’s settings for optimal performance. When compared to other algorithms, the Support Vector Machine algorithm performs best in our model. After selecting the best machine learning model for diabetes and hypertensive prediction, we made predictions and displayed the results in the mobile application. We utilized the Scikit-learn module’s Random Forest Classifier to build the random forest model [21]. The model was trained using a designated training dataset and subsequently evaluated using a separate testing dataset. Accuracy metrics were recorded to determine the optimal model. The results of different performance metrics for the random forest algorithm are shown in Fig. 4. Support Vector Machine (SVM) selects significant points/vectors to assist in creating the optimal hyperplane, which serves as the decision boundary [22]. In Fig. 5, data is classified based on this hyperplane (SVM). In this work, we employed the Decision Tree Classifier from the Scikit-learn module [23] to create a model. The model was trained and its performance was evaluated by using a testing dataset. To identify the optimal model, accuracy metrics were recorded. The evaluation metrics (e.g., accuracy) results for the decision tree model are depicted in Fig. 6. Similarly, for the K-Nearest Neighbor or KNN-based prediction scheme [13], we constructed a model using the KNN Classifier from the Scikit learn module. The evaluation metrics results regarding the KNN model were presented in Fig. 7.
x = standard!zed data
Y = diabetes_dataset[1 Outcome']
Xtrain, Xtest, Ytrain, Ytest = traintest split(x, Y, test_size=0.1, random state=4?) scaler = StandardScaler()
X_train = scaler.fit_transform(X train)
Xtest = scaler.transform(Xtest)
model = DecisionTreeClassifier()
predictions = model.predict(X_test)
print("classification Report:”)
print(classification_report(Y_test, predictions))
print("Accuracyaccuracy_score(v_test, predictions))
Fig.6. Block of code and output of decision tree
|
Classification Report: |
recall |
fl-score |
support |
|
|
precision |
||||
|
0 |
0.86 |
1.00 |
0.92 |
6 |
|
1 |
1.00 |
0.50 |
0.67 |
2 |
|
accuracy |
0.88 |
8 |
||
|
macro avg |
0.93 |
0.75 |
0.79 |
8 |
|
weighted avg |
0.89 |
0.88 |
0.86 |
8 |
Accuracy: 0.875
О X = standardized data
Y = diabetes_dataset['Outcome*]
X train, X test, Y train, Y_test = train_test_split(X, Y, test_size=0.1, random state=80) scaler = StandardScaler()
Xtrain = scaler.fit_transform(X train)
Xtest = scaler.transform(Xtest)
model = KNeighborsclassifier(n_neighbors=5)
predictions = model.predict(Xtest)
print(“Class ific ation Report:“)
print(classificationreport(Y_test, predictions))
print("Accuracy:", accuracy_score(Y_test, predictions))
|
Classification Report: |
recall |
fl-score |
support |
|
|
precision |
||||
|
0 |
0.76 |
0.85 |
0.80 |
48 |
|
1 |
0.71 |
0.57 |
0.63 |
30 |
|
accuracy |
0.74 |
78 |
||
|
macro avg |
0.73 |
0.71 |
0.72 |
78 |
|
weighted avg |
0.74 |
0.74 |
0.74 |
78 |
Accuracy: 0.7435897435897436
Fig.7. Block of code and output of KNN or K Nearest neighbor algorighm
Confusion Matrix - Decision Tree
Predicted level
(a)
(b)
Performance Evaluation of ML Algorithms
|
Classifier |
Accuracy |
Precision |
Recall |
Fl Score |
|
Random Forest |
87% |
0.89 |
0.87 |
0.86 |
|
AdaBoost |
88% |
0.89 |
0.88 |
0.86 |
|
Support Vector Machine |
93% |
0.91 |
0.93 |
0.93 |
|
Decision Tree |
87% |
0.89 |
0.88 |
0.86 |
|
K-N’earest Neighbor |
75% |
0.74 |
0.74 |
0.74 |
|
Gradient Boosting |
78% |
0.81 |
0.79 |
0.77 |
|
Gaussian Naive Bayes |
79% |
0.80 |
0.79 |
0.78 |
(c)
(d)
(e)
(f)
(g)
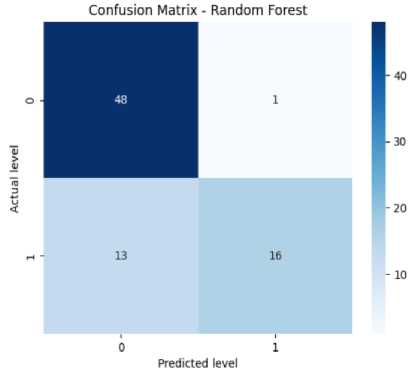
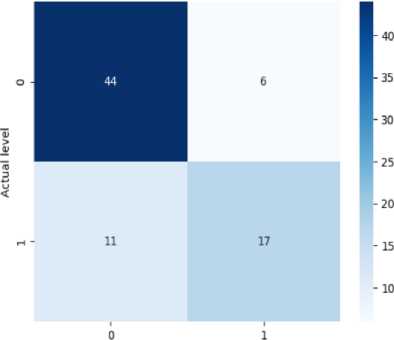
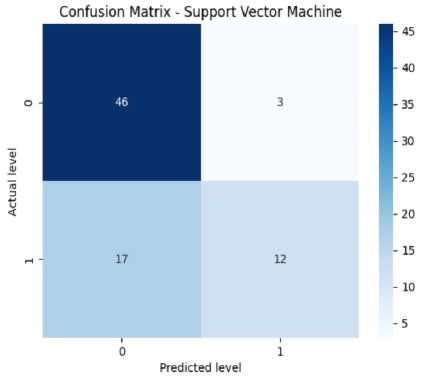
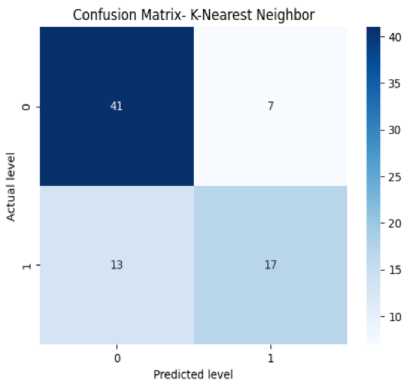
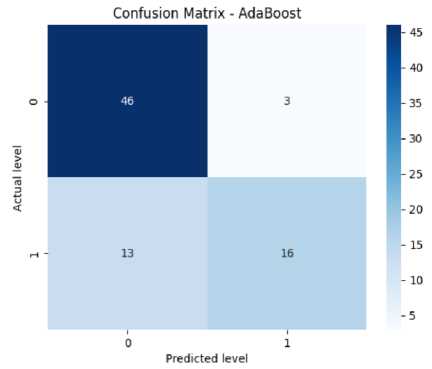
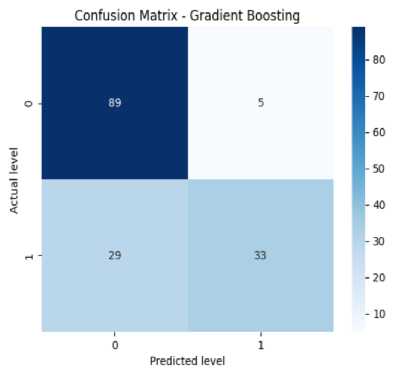
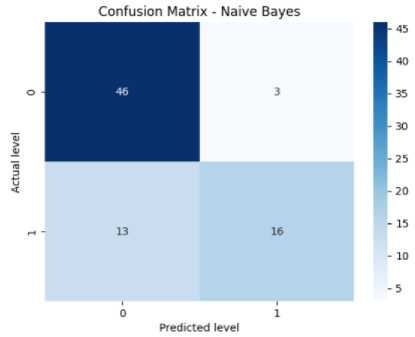
Fig.8. (a) Confusion Matrix for Decision Tree, (b) Confusion Matrix for Random Forest, (c) Confusion Matrix for SVM, (d) Confusion Matrix for KNN, (e) Confusion Matrix for Adaboost, (f) Confusion Matrix for Gradient Boosting, (g) Confusion Matrix for Naive Bayes
Fig.9. Performance evaluation of ML algorithms
Table 1. Comparison with existing works (diabetic and hypertension prediction)
|
Classifier |
Accuracy |
Precision |
Recall |
F1 score |
|
Existing scheme [10] |
60.2% |
.61 |
.60 |
.61 |
|
Existing scheme [12] |
82% |
.83 |
.82 |
.83 |
|
Our proposed scheme (SVM) |
93% |
.91 |
.93 |
.93 |
(a)
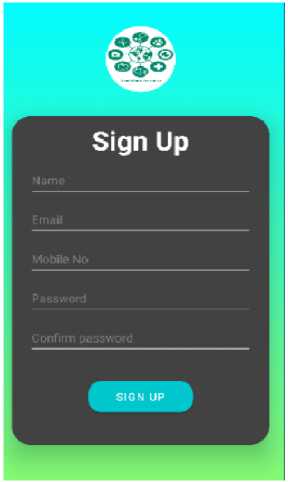
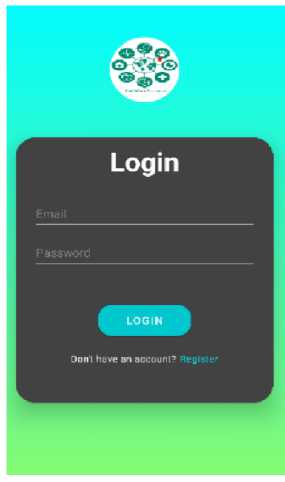
Fig.10. (a) Signup and (b) login interface of our mobile application
(b)
(a)
Fig.11. Initial screen of the app and home page
(b)
(a)
Fig.12. Diabetic patient Prediction Interface
(b)
(a)
Fig.13. Diabetic patient Prediction Interface result interface (cont.)
(b)
Fig.14. Doctor information interface

(a)
(b)
Fig.15. Medicine suggestion by doctor after patient detection and healthcare suggestions
(a) (b)
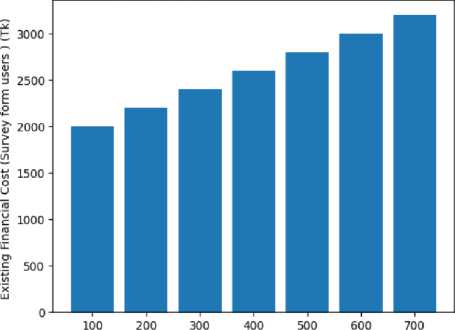
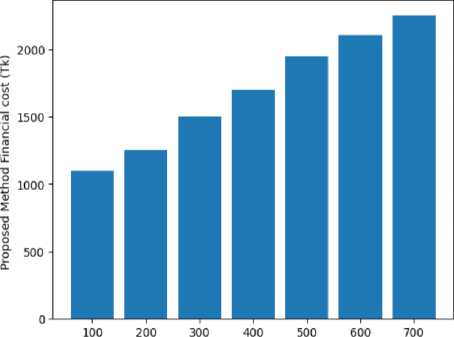
Fig.16. Comparison of Existing financial cost [10], [12] and proposed method financial cost
Total Patients
(a)
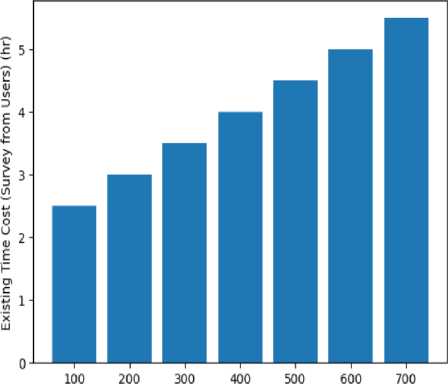
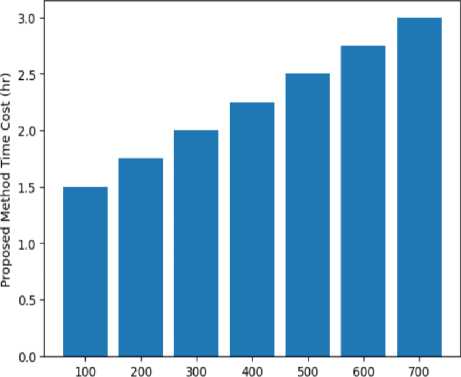
Fig.17. Comparison of Existing time cost [10], [12] and proposed method time cost
Total Patients
(b)
3.5. Performance Evaluation of Machine Learning Techniques
3.6. Comparison with Existing Schemes
4. Mobile Application Development
The confusion matrix helps measure the model’s accuracy, precision, recall, and F-score. It has four elements like TP or true positives, TN or true negatives, FP or false positives, and FN or false negatives. In Fig. 8(a), the confusion matrix of the Decision Tree has been shown which has got 44 TPs, 11 TNs, 6 FPs, and 17 FNs. From this, we can calculate the accuracy of the decision tree which is 87%. Precision means the total number of true positives in all the predictions of yes. From the results, we can get a precision of 89%. Then we look at the recall value (number of true positives in actual yes results). From the results, we get a recall of 88% approximately. The F1-score (i.e., the harmonic mean of precision and recall) is found to be 86% approximately. From Fig. 8(b), we can see the confusion matrix of Random Forest which has got 48 TPs, 13 TNs, 1 FPs, and 16 FNs. From this, we can calculate our accuracy for the random forest which is 87%. From the figure, we get a precision of 89%. We also get a recall of 87% approximately. Specificity or True negative rate is found to be 88%. The F1-score for the random forest is found to be 86% approximately. From Fig. 8(c), we can see the confusion matrix of SVM which has got 46 TPs, 17 TNs, 3 FPs, and 12 FNs. From this, we can calculate the accuracy for SVM which is 93%. We get a precision of 91% for SVM. The recall value is 93% approximately. The number of false negatives is 12 and the false positive is 3. So the error rate is found to be 48% approximately. The F1-score for SVM is found to be 93% approximately. From Fig. 8(d), we can see the confusion matrix KNN which has got 41 true positives, 13 TNs, 7 FPs, and 17 FNs. From this, we can calculate our accuracy for KNN is 75%. The precision value for KNN is 74%. The recall value for KNN is 74% approximately. The error rate for KNN is found to be 50% approximately. The F1-score is found to be 74% approximately. The given confusion matrix in Fig. 8(e) pertains to the Adaboost algorithm. It predicted 46 instances of the first class (true positives) and identified 13 instances as not belonging to any class (true negatives). There were 3 false positive and 16 false negatives. From this, we can calculate the accuracy for Adaboost which is 88%. The precision value for adaboost is 89%. The recall value for Adaboost is 88% approximately. The F1-score for adaboost is found to be 86%. The provided confusion matrix in Fig. 8(f), pertains to the Gradient Boosting algorithm. It predicted 89 instances of the first class (true positives) and identified 29 instances as not belonging to any class (true negatives). There were 5 false positive and 33 false negatives. From this, we can calculate our accuracy which is 79%. The precision value for gradient boosting is 81%. The recall value for gradient boosting is 79% approximately. The F1-score for gradient boosting is found to be 77%.
From Fig. 8(g), we can see the confusion matrix of Naive Bayes which has got 46 TPs, 13 TNs, 3 FPs, and 16 FNs. From this, we can get the accuracy for naive Bayes which is 75%. The precision value for naive Bayes is 79%. The recall value for naive Bayes is 79% approximately. The error rate for naive Bayes is 48% approximately. The F1-score for naive Bayes is 77% approximately. From the analysis of Fig. 9, it is evident that the Support Vector Machine (SVM) algorithm outperformed the remaining ML algorithms with an impressive accuracy of 93%. SVM also achieved superior performance across multiple metrics, including precision, recall, and F1 score. The model accuracies for Random Forest, Decision Tree, SVM, Adaboost, K-Nearest Neighbor, Gradient Tree boosting, and Naive Bayes were reported as 87%, 87%, 93%, 88%, 75%, 78%, and 79% respectively. The Support Vector Machine (SVM) algorithm surpassed the other algorithms, exhibiting the highest accuracy among these algorithms. The SVM model predicts whether a user is experiencing diabetes and hypertension or not, and the outcome is exhibited within the mobile application.
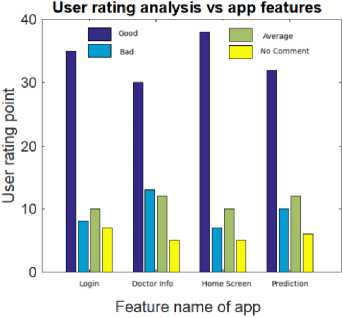
Fig.18. User rating curve for different app features
Table 1 provides the comparison results between our proposed scheme and existing schemes. For result comparison, we have used our collected dataset. From the comparison results, anyone can see that our proposed scheme using an SVM classifier achieves more accuracy than both existing works [10] and [12]. The accuracy results of our proposed scheme, existing scheme [10], and existing scheme [12] are 93%, 60.2%, and 82%, respectively. From Table 1, we can also notice that our proposed diabetic and hypertension prediction scheme using the SVM technique offers better precision, recall, and F1 score than the compared schemes [10] and [12].
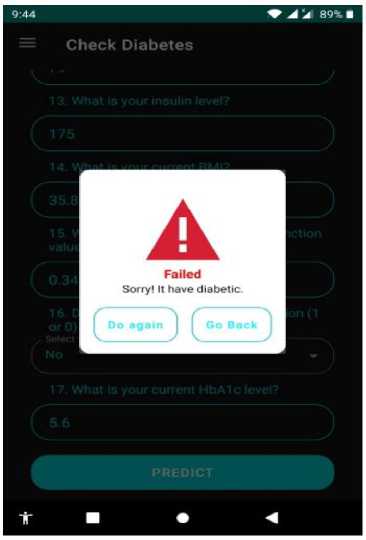
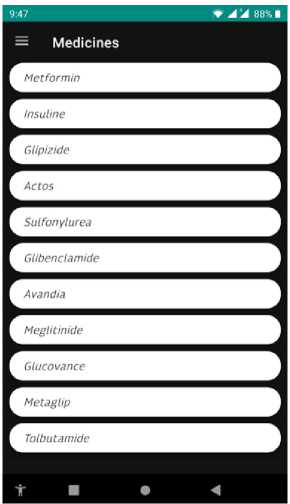
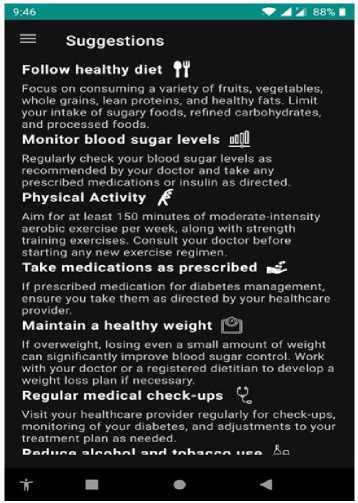
The user interface of our mobile application consists of a home page and login/signup functionality. Users can create profiles within this interface, which will enable them to share their personal information and health data. The splash screen and home page of our application are displayed in Figs. 11(a) and 11 (b), respectively. It provides a visually appealing and user-friendly interface for users to navigate. Additionally, the signup and login pages, are shown in Figs. 10(a) and 10(b), respectively. It allows users to access their accounts or create new ones securely. This interface serves as a gateway for patients to share their health information, allowing us to provide personalized recommendations and assistance in managing their conditions effectively. The diabetic and hypertension prediction interface is illustrated in Fig. 12 and Fig. 13, respectively. The logged in users can share their information, which is utilized for prediction purposes by completing a form. The provided information is then sent to the backend where the deployed model processes it through an API. The resulting prediction is returned to the application through another API. Based on the model’s output, the application determines whether the user has a diabetic and hypertensive or not and calculates the time and cost burden of diabetic and hypertensive patients. If the user’s life is deemed imbalanced and they are experiencing any mental health issues as a result, they can seek assistance from the doctor information page, which provides details to connect with healthcare professionals. This comprehensive system allows patients, including those with diabetes and hypertension, to actively manage their health, receive personalized feedback, and access necessary support when needed. The Doctor Information system within our application provides users with the addresses and contact information of nearby doctors’ chambers. This feature enables users to seek medical assistance offline from the listed doctors. Fig. 14 displays the interface where users can access the available doctors’ information. By having access to this comprehensive directory, users can easily locate and contact healthcare professionals for in-person consultations and medical support. The Doctor Information system serves as a valuable resource, connecting users with the necessary medical expertise to address their healthcare needs. Within our application, we have implemented a feature named medicine suggestion based on symptoms by the experienced doctor. Fig. 15(a) shows the medicine suggestion for diabetic and hypertension patients based on their symptoms. We have implemented a feature called the Suggestion Box interface in Fig. 15 (b). This feature assists patients, including those who are diabetic and hypertensive, in achieving a more-healthier life and they can easily calculate the cost and time burden. This interface offers various tips and recommendations aimed at improving their health. Users can access information on engaging in regular physical activity, taking medications as prescribed, maintaining a healthy weight, and more. The Suggestion Box interface, as depicted in Fig. 15(b) provides a user-friendly and intuitive platform for users to explore and implement these valuable suggestions. By incorporating these tips into their daily routines, patients can strive for a healthier and more harmonious lifestyle.
Table 2. User survey results regarding real-world applicability of our proposed application
|
question |
Yes |
No |
No comment |
|
Helpful regarding early diabetic and hypertension prediction |
75% |
10% |
15% |
|
App can save time and cost regarding treatment |
80% |
12% |
8% |
|
App can provide security of users data |
65% |
30% |
5% |
|
App is market ready |
65% |
25% |
10% |
5. Evaluation Results
Fig. 16 compares the financial cost for multiple patients for both the existing scheme (probable value submitted by users in the collected data set via questionnaire) and the proposed scheme. It can be concluded from Fig. 16 that by providing diabetic and hypertension patient prediction and medicine suggestions our proposed scheme can lower the financial cost burden of the existing scheme [10], [12]. It can be noted that, in the existing scheme, users can take extra medicine based on their prior knowledge or belief. The graph suggests that the cost of treatment increases as the total patients increase. Fig. 17 depicts the required time burden cost for multiple patient treatments for both the existing scheme (probable value submitted by users in the collected data set) and the proposed scheme. We can see from Figure 17 that our proposed method can reduce the time cost regarding the treatment over the existing time cost by using both ML-based prediction schemes and mobile applications. It can be noted that, in the existing scheme, users can take extra time for treatment due to offline based doctors’ appointments for suggestions and travel time delays.
Fig. 18 shows the user evaluation results regarding the proposed mobile application features. We have collected sixty users’ opinions. They checked our mobile application features and provided the rating point. The reviewers mainly checked the login page, doctor information, home screen, and prediction page (diabetic and hypertension disorders). We can see from Figure 18 that the good comment, average comment, bad comment, and no comment secured first, second, third, and fourth place, respectively. For instance, for the prediction feature evaluation result in Fig. 18, the number of user rating points with good comments, average comments, bad comments, and no comments is 32, 12, 10, and 6, respectively. Table 2 shows the real-world applicability results of our mobile application. We have collected 60 user opinions regarding the real-world applicability issues associated with our mobile application. The results show that more than 65 percent of users are satisfied with the diabetic and hypertension prediction feature, time and cost savings, security, and market-ready issues regarding our proposed application.
Potential Challenges Regarding Wider Usage of this Application
From the evaluation results, it can be verified that the proposed mobile application would be helpful for both diabetic and hypertension patients. However, some challenges still exist regarding wider usage of this application. For example, rural people may not be literate enough to use the mobile application features. However, a proper support system at the rural government office can be helpful for the illiterate people to use the mobile application. Another issue is the large number of users support and security. Using more powerful servers with storage facilities, private cloud services like Google Cloud Service/storage providers, and an advanced quantum cryptography scheme could be useful to deal with such challenges.
6. Conclusions
This paper presents a machine learning-based prediction model for the detection of diabetic and hypertensive patients by investigating the accuracy performance of Random Forest (RF), K-Nearest Neighbor (KNN), AdaBoost, Gradient Boosting, Decision Tree (DT), Support Vector Machine (SVM), and Gaussian Naive Bayes Algorithm. To assess diabetic and hypertension patients, this paper collects a data set from 779 users. Our results show that the Support Vector Machine (SVM) algorithm is most suited for the diabetic and hypertension patient prediction model with 93 percent accuracy. By utilizing the machine learning-based prediction model, the existing healthcare system can analyze patient data and provide accurate predictions regarding their diabetic and hypertensive status. These models can aid in early detection, risk assessment, and personalized treatment planning for individuals at risk of these chronic conditions. This paper also gives a mobile application for diabetic and hypertensive patients with login and signup features, the home page, prediction interface, doctor’s search, health suggestions, and medicine suggestions from doctors, among others. Our user rating analysis showed that more than 70 percent of users are satisfied (e.g., both good and average comment users) with the developed mobile application features.
In the future, we will try to increase the dataset quantity, as a larger dataset would have resulted in more precise and accurate findings. In addition, the number of mobile application features can be increased with more statistics and emergency help features. To ensure the security and privacy protection of users’ data, we will try to incorporate modern encryption and block chain-based algorithms into our mobile application. Further, we will try to incorporate this application into the present healthcare systems and analyze its effects, real-time wearable device based data collection, patients with more geographical regions, bias and potential bias issues, and more advanced features like machine learning-based user cost prediction for diabetic and hypertension disease treatment, among others.
References A Machine Learning Based Intelligent Diabetic and Hypertensive Patient Prediction Scheme and A Mobile Application for Patients Assistance
- M. Nour et al., “Automatic classification of hypertension types based on personal features by machine learning algorithms,” Mathematical Problems in Engineering, vol. 2020, no. xx, pp. 1-14, 2020.
- F. Haque et al., “Performance analysis of conventional machine learning algorithms for diabetic sensorimotor polyneuropathy severity classification using nerve conduction studies,” Computational Intelligence and Neuroscience, vol. 11, no. 5, pp. 1-10, 2021.
- M. Bader Alazzam et al., “Identification of diabetic retinopathy through machine learning,” Mobile Information Systems, vol. 2021, no. xx, pp. 1-8, 2021.
- E. Adane et al., “The cost of illness of hypertension and associated factors at the university of gondar comprehensive specialized hospital northwest ethiopia”, ClinicoEconomics and Outcomes Research, vol. 12, no. xx, pp. 133–140, 2020.
- L. Zhang et al., “Adaboost: Still a powerful machine learning tool,” Journal of Zhejiang University SCIENCE C,vol. 13, no. 5, pp. 349–367, 2012.
- M. S. Rahman et al., “Awareness, treatment, and control of diabetes in bangladesh: A nationwide population-based study,” PloS one, vol. 10, no. 2, pp. 1–14, 2015.
- M. S. Islam et al., “Machine learning based decision support system for diabetes management,” in Diabetes and Metabolic Syndrome: Clinical Research and Reviews, vol. 13, no. 1, pp. 123–130, 2019.
- WHO, “National guidelines for management of hypertension in bangladesh,” https://apps.who.int/iris/bitstream/handle/10665/ 279486/9789843368553-eng.pdf ?sequence=1, last accessed on july 2023.
- M. J. Husain et al., “Cost of primary care approaches for hypertension management and risk based cardiovascular disease prevention in bangladesh: A hearts costing tool application,” BMJ open, vol. 12, no. xx, pp. 1-19, 2022.
- M. Maniruzzaman et al., “Classification and prediction of diabetes disease using machine learning paradigm,” Health information science and systems, vol. 8, no. xx, pp. 1–14, 2020.
- L. Jia et al., “Pe-dim: An efficient probabilistic ensemble classification algorithm for diabetes handling class imbalance missing values,” in IEEE Access, vol. 10, pp. 107459–107476, 2022.
- D. LaFreniere et al., “Using machine learning to predict hypertension from a clinical dataset,” in 2016 IEEE symposium series on computational intelligence (SSCI), pp. 1–7, 2016.
- G. Guo et al., “Knn model-based approach in classification,” OTM Confederated International Conferences, Lecture Notes in Computer Science, vol 2888, Springer, Berlin, Heidelberg, pp 986–996, 2003.
- M. A. Makroum et al., “Machine learning and smart devices for diabetes management: Systematic review”, in Sensors, vol. 22, no. 5, pp. xx-xx, 2022.
- V. Mohan et al., “The rising burden of diabetes and hypertension in southeast asian and african regions: Need for effective strategies for prevention and control in primary health care settings,” International journal of hypertension, vol. 2013, pp. 1-10, 2013.
- S. I. Ayon et al., “Diabetes prediction: A deep learning approach,” International Journal of Information Engineering Electronic Business, vol. 11, no. 2, pp. 1–12, 2019.
- Android, “https://www.android.com/intl/en-ca/,” last accessed on july 2023.
- C. Khawas et al., “Application of firebase in android app developmenta study,” International Journal of Computer Applications, vol. 179, no. 46, pp. 49–53, 2018.
- Tiangolo, Fastapi, “https://fastapi.tiangolo.com/,” last accessed on july 2023.
- T. Lv et al., “Survey on json data modelling,” Journal of Physics: Conference Series, IOP Publishing, vol. 1069, no. xx, pp. 1-5, 2018.
- Scikit-Learn Contributors, “Scikit Learn - randomforestclassifier,” https://scikit learn.org/stable/modules/generated/ sklearn.ensemble.RandomForestClassifier.html, last accessed on july 2023.
- C. M. Bishop et al., “Pattern Recognition and Machine Learning,” springer, pp. 1-100, last accessed on january 2023.
- Scikit-Learn Contributors, “Scikit Learn – Decision Tree Classifier,” https://scikit learn.org/stable/modules/generated/ sklearn.tree.DecisionTreeClassifier.html, last accessed on july 2022.
- I. Tasin et al., “Diabetes prediction using machine learning and explainable AI techniques,” Healthcare Technology Letters, vol. 10, pp. 1–10, 2023.
- M. M. Islam et al., “Predicting the risk of hypertension using machine learning algorithms: A cross sectional study in Ethiopia,” PLoS ONE, vol. 18, no. 8, pp. 1–20, article id e0289613, 2023.
