A method for attributing non-refitting fragments to a single artifact: the case of Bronze Age flat figurines

Author: Kolobova K.A., Chistyakov P.V., Basova N.V., Postnov A.V., Zotkina L.V.
Journal: Archaeology, Ethnology & Anthropology of Eurasia @journal-aeae-en
Section: The metal ages and medieval period
Article in issue: 1 т.49, 2021.
Free access
Short address: https://sciup.org/145146229
IDR: 145146229
Text of the article A method for attributing non-refitting fragments to a single artifact: the case of Bronze Age flat figurines
In many cases, when archaeological artifacts are incompletely preserved, and the available fragments are non-refitting, it becomes a big problem to relate the constituent parts to each other. And although sometimes it is possible to judge whether the fragments belong to one object by the texture, color, and shape as a whole, this is far from always obvious and scientifically substantiated. This problem is especially acute when working with relatively homogeneous materials, for example with ceramics of the same complex, where the characteristics of technology and ornamentation are very similar or even identical. The study of isolated unique finds does not simplify the task. For instance, two ornamented fragments of a small figurine made of shale found at the Tourist-1 settlement are very similar in such parameters as raw material, color, texture, decor features, and technological characteristics. However, the possibility of creating two or more artifacts from the same material using the same manufacturing techniques cannot be ruled out. In such cases, the belonging of fragments to the same or different items should be justified, because this is fundamental for understanding their stylistics and how the sculptures looked, in order to search for analogs and study their semantics.
In recent years, the development of digital technologies has led to the emergence of new tools for the study of archaeological artifacts. Among the most productive areas are 3D modeling, high-precision measurements, and statistical modeling. Modern methods, highly improved as a result of the use of the latest technological equipment, make it possible to obtain previously inaccessible scientific knowledge. For example, geometric-morphometric analysis gives the opportunity to carry out a comprehensive comparison of the shape of lithic artifacts relying on thousands of coordinates (Richardson et al., 2013; Herzlinger, Goren-Inbar, Grosman, 2017; Herzlinger, Grosman, 2018; Shalagina et al., 2020; Kolobova et al., 2020). The analysis of the sequence of flakes was optimized using 3D morphometry methods (Zotkina, Kovalev, Shalagina, 2018; Shalagina, Kolobova, Krivoshapkin, 2019). New algorithms for determining the metric parameters of lithic artifacts (Bretzke, Conard, 2012; Kolobova et al., 2021), measurements of angles on 3D models of items provide new information about the technological and cultural variability of assemblages in individual regions (Valletta et al., 2020). Calculation of the center of gravity makes it possible to classify archaeological artifacts (Grosman, Smikt, Smilansky, 2008; Grosman et al., 2014) and also determine their function (Grosman, Ovadia, Bogdanovsky, 2014; Kolobova, Fedorchenko, Basova et al., 2019).
An important area of research is expanding the capabilities of the applicative method for lithic artifacts (Sumner, Riddle, 2008; Lang, 2013; Delpiano, Peresani, Pastoors, 2017), when with the use of 3D modeling the processes of rendering splices are optimized. In some studies, new mathematical models are created for the machine selection of the refitting fragments or artifacts (Stamatopoulos, Anagnostopoulos, 2016; Cooper, Qiu, 2006). In this article, we propose a new method for attributing non-applicable fragments to one artifact, based on 3D modeling and mathematical statistics.
Materials and methods
To demonstrate the method, we use two fragments of a small figurine made of shale found at the Bronze Age cemetery Tourist-2 (Novosibirsk) in close proximity to each other. However, these are not fitting, which means that these can be parts of different sculptures (Basova et al., 2017; Zotkina et al., 2020). As a result, we will determine the statistical probability of the belonging of the two fragments to one product. This method is based on the assumption that metric parameters of the fragments of one artifact, which are close to each other, should belong to the same statistical sample. Consequently, as a result of the fragments’ comparison, the null hypothesis (H0) will be accepted, which asserts the absence of any difference in the metric parameters of the two fragments. The condition for applying this method is the constancy of the analyzed parameter of the artifact. In our case, a flat figurine is analyzed, the thickness of which is a relatively constant indicator throughout the entire length.
To implement the method, the following procedures need to be performed.
-
1. 3D modeling of the investigated artifact to obtain its scaled model. We used a structured illumination 3D scanner Range Vision 5M according to the published technique (Kolobova, Fedorchenko, Basova et al., 2019). As a result, high-precision scaled models were obtained that fully corresponded to the original figurines, which made it possible to measure the thickness of artifacts with a precision of up to ten thousandths of a millimeter, whereas when using modern calipers, only up to hundredths (Kolobova et al., 2013; Kolobova, Shalagina, Chabai et al., 2019). Machine measurements are on average 20–30 % more accurate than manual measurements (Grossman, Smikt, Smilansky, 2008). Their accuracy is also supported by the ability to control the measurement angle and maintain the distance between points, which is nearly impossible with manual measurements.
-
2. Metric measurements of 3D models of artifacts of the most stable parameter. Thickness measurements were made along the selected longitudinal section of the models, perpendicular to the product planes, at regular intervals, as shown in Fig. 1–4. At the same time, measurements were excluded in the area of small breaks and splinters.
-
3. Statistical comparison of samples obtained from measurements.
-
4. With a significant variance in the samples, a comparison of metric parameters in those zones of artifacts that were presumably located closest to each other before fragmentation.
As a result of metric measurements, we derived two selections of samples that need to be compared with each other. All statistical calculations were performed using the PAST-3 program. The normalcy of distribution was checked using the Shapiro-Wilk test. If the distribution was normal, the Student’s t -test was applied; if abnormal, the nonparametric Mann-Whitney test was used. This method can also be used for three or more fragments of artifacts. However, in this case, it is recommended to use ANOVA test for normally distributed data, and Kruskal-Wallis test for abnormal ones (Hammer, Harper, Ryan, 2001).
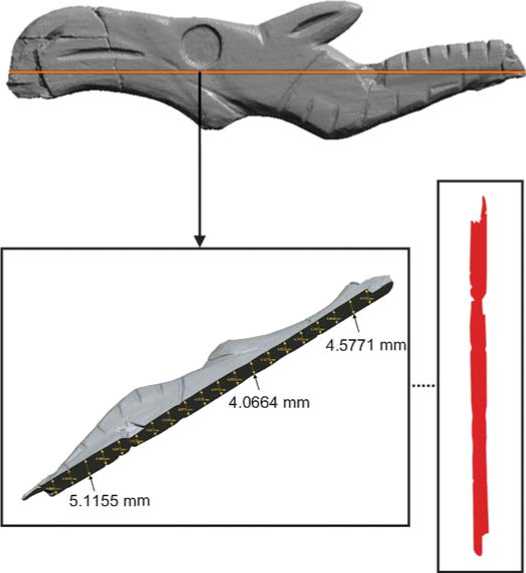
Fig. 1. 3D model of a fragment of a zoomorphic sculpture with head, its conventional longitudinal section, and measured metric parameters.
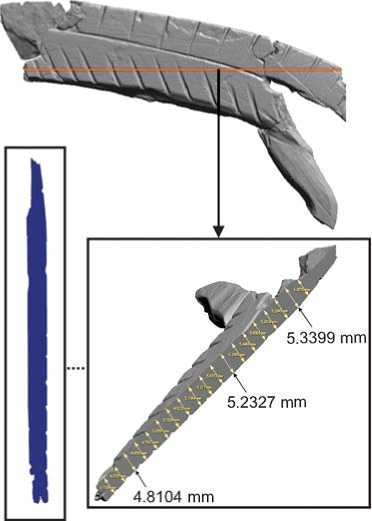
Fig. 2. 3D model of a fragment of a zoomorphic sculpture with croup, its conventional longitudinal section, and measured metric parameters.
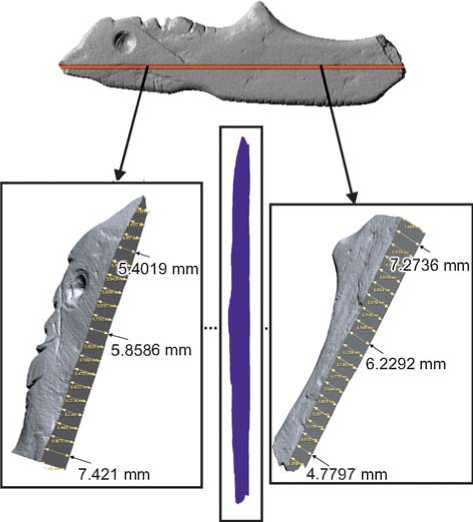
Fig. 3. 3D model of an anthropomorphic sculpture made of shale, its conventional longitudinal section, and transverse fragmentation, with indication of metric parameters.
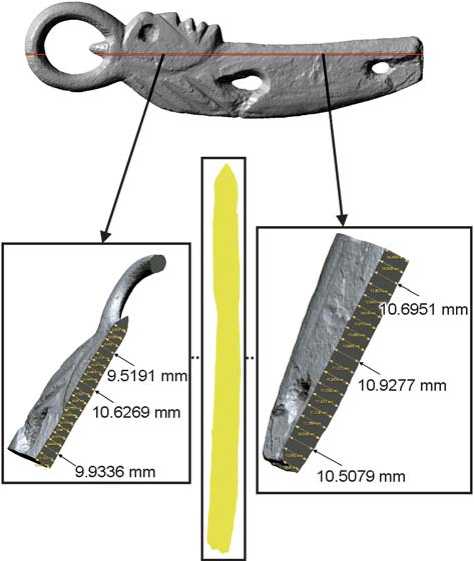
Fig. 4. 3D model of an anthropomorphic sculpture made of burl, its conventional longitudinal section, and transverse fragmentation, with indication of metric parameters.
If as a result of calculations the null hypothesis (H0) is confirmed at p = 0.05, then it is recognized that the fragments are constituent parts of one artifact, with the probability of an error of the first type of 5 %.
Results of the statistical analysis
First of all, we tested non-refitting fragments of zoomorphic figurines. To verify the data obtained and the conclusions drawn, two whole anthropomorphic flat figures (shale and burl) from the Tourist-2 assemblage were taken. They demonstrate fairly stable thickness indicators. This finding makes it possible to put forward a null hypothesis, suggesting that the values of this indicator of one figurine belong to one data sample.
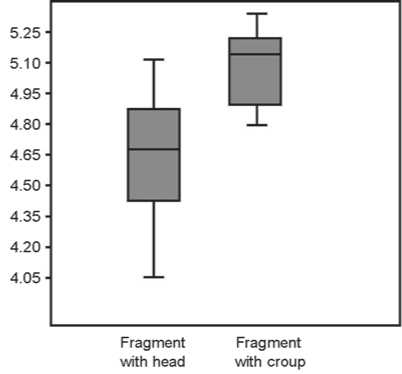
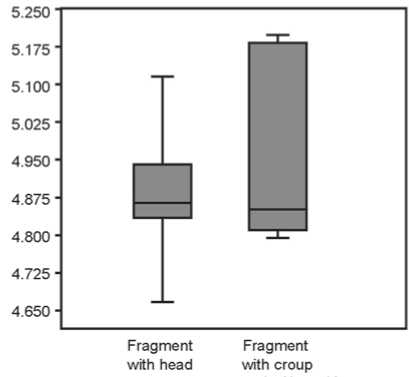
Fig. 5. Box plot of thickness values of two zoomorphic fragments.
1 – along the entire length; 2 – in the presumably medial part.
Both sculptures have a lenticular longitudinal section, where the thickness decreases in the proximal and distal parts, and increases in the medial part (see Fig. 3, 4). For example, the thickness of a figurine made of shale in the proximal part is 4.1–5.8 mm, in the medial part 6.8–7.4 mm, in the distal part 4.3–5.2 mm; the thickness of a figurine made of burl is 8.6–9,4 mm, 10.4–11.0 mm, and 7.0–10.5 mm, respectively. Both figurines show a slight change in thickness in profile view—within 1–2 mm.
To determine whether two zoomorphic fragments belong to the same or different sculptures, we compared the distribution of thickness values on the box plot (Fig. 5, 1 ). In the fragment with head and neck, this parameter is 4.0–4.6 mm in the nasal area and 4.8–5.1 mm in the neck area, which generally corresponds to the trend towards an increase in the thickness of the sculpture in the medial part (see Fig. 1). In the fragment with croup, the values of the indicator vary from 4.8–5.2 mm in the proximal part to 5.0–5.3 mm in the distal part (see Fig. 2). The part of the figurine, where the tail may have been located, is broken off, so in this particular example it is impossible to trace the tendency of the decreasing thickness of the item.
We compared the values of the analyzed parameter of two fragments (see Fig. 5, 1 ) without taking into account measurements in the damaged parts (18 measurements of the thickness of the fragment with head and 17 of the fragment with croup). They exhibit a normal distribution, so both parametric and nonparametric tests can be used. For example, the Student’s t -test demonstrates a significant difference between the samples of thickness values: t = 2.64 at p = 0.0123 (the critical value of the test is at p = 0.05). Hence, the null hypothesis is rejected. Thus, if we take into account all the values of the parameter, we can rather conclude that the fragments belonged to different sculptures.
The anthropomorphic shale figurine (see Fig. 3) demonstrates the greatest stability of the thickness values along the entire length (Fig. 6). These values have a normal distribution; the Student’s t -test indicates that the samples are the same ( t = 0.02; p = 0.97). However, if we simulate the fragmentation of the anthropomorphic burl figurine, arbitrarily dividing the thickness values into two groups with a boundary in the medial part (see Fig. 4), then, as in the case with the zoomorphic fragments, we will get a significant difference (Fig. 7, 1 ). Both groups show a normal distribution, so we use the t -test. As in the case with the zoomorphic fragments, thickness values of the two parts of the anthropomorphic burl figurine differ significantly ( t = 4.8, p = 2.15E-5). This is due
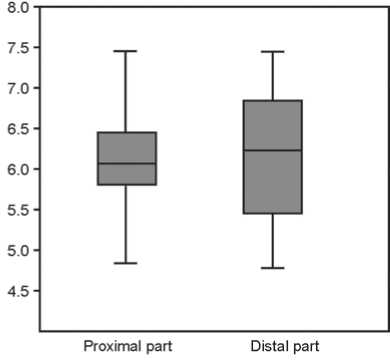
Fig. 6. Box plot of thickness values of two conventional fragments of the anthropomorphic sculpture made of shale.
to the lenticular cross-section of the figurine, wherein the thickness varies greatly in terminal parts. However, if we take into account the values of the parameter in the medial part of the figurine, the situation will be fundamentally different. We chose 10 such values, having excluded the measurements in the damaged parts, and arbitrarily divided them into two groups (Fig. 7, 2 ). In this case, the size of the samples didn’t meet the requirements of parametric tests anymore; therefore, we used the nonparametric Mann-Whitney test. It showed that the thickness of both conventional fragments was the same ( U = 21, p = 0.1).
To check the possibility of applying the studied zoomorphic fragments, we took 16 measurements in the supposedly medial part of the elk figurine (see Fig. 5, 2 ). The Mann-Whitney test showed no significant difference between the thickness values ( U = 19, p = 0.325). As a result of this comparison, the null hypothesis is accepted.
Conclusions
The developed method for assessing the probability of the belonging of non-applicable fragments to one artifact has demonstrated its effectiveness on the example of the tested sculptures, and at the same time showed its limitations. The analyzed fragments should have stable/similar metric parameters in one dimension. They can belong to flat sculptures, buckles, onlays, bone daggers, and certain parts of ceramic vessels (rim, bottom).
It is recommended to carry out measurements on scaled 3D models obtained as a result of scanning. The scaling accuracy of photogrammetric 3D models
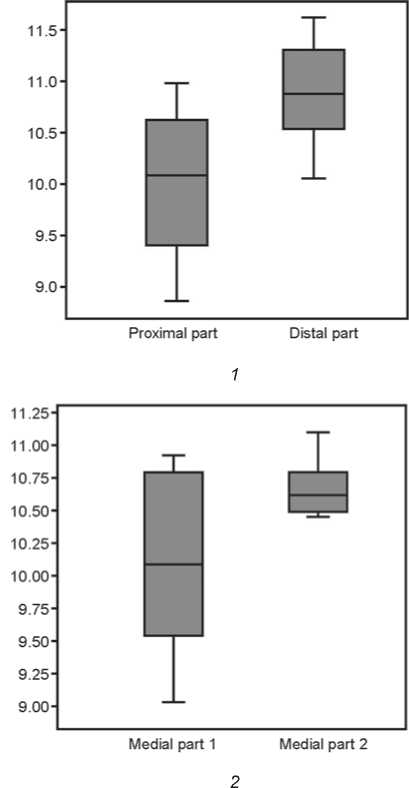
Fig. 7. Box plot of thickness values of two conventional fragments of the anthropomorphic sculpture made of burl. 1 – along the entire length; 2 – in the presumably medial part.
is not satisfactory for this method. All measurements must be taken at the same angle and the same distance from each other. Both conditions can be controlled in various software products. It is recommended to make a significant number of measurements both to apply parametric criteria (with a higher power than in nonparametric ones) and to reduce the likelihood of a type II error (the incorrectly accepted null hypothesis or incorrect determination of similarity).
As a result of applying the method, a researcher obtains the statistical probability of the fragments belonging to one artifact with an accuracy of 95 % (p = 0.05; if necessary, the probability can be increased). The method is very sensitive to changes in metric parameters; therefore, it is recommended to test the fragments that are supposedly the closest to each other, and to exclude measurements of areas with any defects. It is possible to analyze more than two fragments, subject to statistical constraints, in order to reduce the probability of a type I error (rejection of the true null hypothesis or non-existent differences in the samples).
The technological similarity of flat anthropomorphic figurines from Tourist-2, similar tendencies in changing of their thickness, and the statistically identical distribution of the values of this parameter in two zoomorphic fragments indicate that initially they formed a single whole. At the same time, it is rather difficult to say which part of the sculpture was lost in size. But since the most extreme value of the parameter for the fragment with head is 4.8 mm, and in the terminal part of the fragment with croup the thickness is 4.11 mm, we assume that the lost part of the figurine was approximately 1 cm.
Acknowledgement
This study was performed under the RF President grant MK-2273-2020-6.
