A multi-level parallel system for laws masks abnormality lung detection

Author: Heba A. Elnemr, Ghada F. ElKabbany
Journal: International Journal of Intelligent Systems and Applications @ijisa
Article in issue: 8 vol.10, 2018.
Free access
Lung is a vital organ that plays a pivotal role in every second of our lives. Lungs may be affected by a number of diseases, including pulmonary edema and cancer. These diseases deemed life-sustained diseases, so they possess high preferences in detection, diagnosis, and possible treatments. In this paper, we presented a textural feature analysis framework that is capable of detecting lung abnormalities (edema or cancer) using Laws masks texture features. Laws masks are conventional texture feature extractor, and considered as one of the best methods for texture analysis in image processing. However, computing and extracting the texture features through various masks are very time consuming, whereas lung diseases demand rapid yet accurate diagnosis. Today, increased efficiency is being achieved through parallelism, and this trend is believed to continue in the future, with all computing devices likely to have many processors. Therefore, our objective is to investigate a multi-level parallel algorithm on Laws masks to describe structural variations of lung abnormalities. To our knowledge, there are no published researches that employed parallel strategies for lung abnormalities detection using Laws method. The proposed system has been experimented on real CT lung images. The results indicate that Laws texture features are capable of discriminating among normal, edema and cancerous lungs. Furthermore, applying parallel processing approaches improves significantly the overall system performance.
Lung cancer, Pulmonary Edema, Laws Texture Feature, Texture analysis, parallel processing
Short address: https://sciup.org/15016516
IDR: 15016516 | DOI: 10.5815/ijisa.2018.08.05
Text of the scientific article A multi-level parallel system for laws masks abnormality lung detection
Published Online August 2018 in MECS
Currently, images are widely used in several application areas. One of the greatest significant areas is medicine where Computer-aided diagnostic processing turns out to be an essential part of clinical routines. Medical image processing has to encounter the challenges arise from the rush of the new progress of high technology, the usage of various imaging modalities, as well as the growth of data volumes to produce high-quality information that is suitable for disease diagnosis and treatment. Texture analysis arises to be a substantial strategy in medical image processing that assists graylevel patterns interpretation, pixel mutual relations realization, and an image spectral properties detection. Furthermore, texture analysis approaches can be used to enhance the image appearance for visual analysis.
The process of medical image texture analysis is still a complex and challenging problem due to the various properties of medical images. It incorporates four main issues; texture feature extraction, texture discrimination, texture classification and shape reconstruction from texture information [1]. Feature extraction is the initial and crucial stage of image texture analysis. The obtained results from this stage are used to discriminate the textures, classify the textures or determine the object shape [2].
Research in the literature have tackled this problem, and hence utilized many approaches for texture analysis [3-6].
Some algorithms implement structural approaches that characterize texture by well-defined primitive textual elements organized according to a particular replacement rule [7].
Others apply model-based methods, in these methods; fractal and stochastic models are used to interpret image texture. Parameters of these models are estimated then used for image analysis [8].
Statistical texture analysis methods are firmly fixed in the computer vision area and have been comprehensively harnessed to several tasks. These methods characterize the texture quantitatively with parameters that are computed from the spatial distribution of pixels intensities and their relationships [9-10]. Furthermore, filter-based approaches are widely used in the literature [11-13]. In these methods, filter banks are applied on the images to extract relevant textural information using spatial, frequency and joint spatial-frequency filtering techniques.
All these methods suffered from the main problem, they are computationally expensive due to a large amount of processed data. Typically, in medical applications, the processing time has to be very small and sometimes realtime processing is necessitated. Hence, during the last decade parallel algorithms has become an important tool for implementing medical image processing techniques [14-16].
In this study, we submit an efficient multi-level parallel algorithm for lung abnormality detection. The algorithm is an extension of the lung abnormality detection algorithm presented in [17]. The results disclose that our procedure significantly outperforms the other technique as it considerably reduces the computation complexity and increases the processing speed. Moreover, to investigate and analyze more texture properties, the latter algorithm is extended to include sixteen Laws masks instead of five masks in the previous work.
Our parallel solution allocates images in a distributed system for local or remote inter-process communication. Based on our previous sequential implementation, the Laws texture feature detection scheme is, therefore, established in parallel by distributing and transferring information between different processing elements (PEs).
The organization of this paper is as follows: Section 2 discusses the previous related work. Section 3 presents the lung abnormality detection algorithm proposed by [17]. Section 4 explains our comprehensive approach for lung abnormality detection using parallel processing. In section 5, we provide and discuss the experimental results. Finally, section 6 concludes the paper.
-
II. Related Work
This section generally presents the current challenges and weaknesses of texture analysis in medical images. In addition, it introduces some existing parallel textural analysis models, and finally, it illustrates the deficiencies of using parallel processing in texture analysis for medical images.
-
A. Texture Analysis for Medical Images
Analyzing texture parameters is a useful computational manner for pathologically differentiating between different regions on medical images. It has been proven to perform better than human eyesight at different applications; segmentation of particular anatomical structures, detection of lesions, discrimination between pathological and healthy tissue in various organs.
Sun et al. [18] studied and tested the use of threedimensional (3D) texture features to recognize the malignancy level. Five sets of features were realized and examined, Grey Level Co-occurrence Matrix (GLCM), Local Binary Pattern (LBP), Scale-Invariant Feature Transform (SIFT), steerable, and wavelet features.
Yao et al. [19] developed a computer-assisted detection technique to identify and measure the pulmonary abnormalities on Chest Computed Tomography (CT) imaging in infection cases. Each lung image is subdivided into texture blocks of size 16×16 pixels, from which 25 different texture features are computed from histogram statistics, co-occurrence matrix and run-length matrix.
These features are fed to the support vector machine classifier to discriminate areas of the abnormal lung on CT in H1N1 influenza patients from those of normal lungs, fibrosis, and other infections. Also, those texture features are quantified to measure the disease progression and severity.
Zayed and Elnemr [10] introduced an automated texture analysis based scheme to detect and distinguish lung abnormalities, whether lung tumor or pulmonary edema. Haralick’s features computed from the GLCM are tested and evaluated to select the most discriminating and significant texture features that can be utilized to distinguish between the two types of abnormalities, comparing to normal.
Filter-based texture analysis using wavelet transform has been used for automatic image segmentation system to classify the region of interest [20], besides it has been adopted for medical image retrieval [21]. Furthermore, texture features extracted from discrete wavelet frame along with grey–level histogram features were combined and used to diagnose and classify interstitial lung diseases [22].
The study of [23] displayed a computer-aided diagnostic hierarchal classifier for discriminating between normal, fatty, and heterogeneous liver ultrasound images using feature fusion techniques. GLCM and LBP features were extracted as spatial domain features, 2-D wavelet packet transforms sub-images and 2-D Gabor filter banks transformed images were obtained as transform domain features. The dominant features of the parallel and serial fused feature spaces were selected using particle swarm optimization algorithm.
A major challenge faces texture analysis approaches is that they are computationally expensive and, thus, timeconsuming. Whereas, medical applications require high-efficiency performance with small processing time and sometimes real-time is desired. Fortunately, parallel processing approaches have become a dominant trend to solve complicated scientific problems. Parallel processing schemes and their implementations for texture analysis will be discussed in the next section.
-
B. Parallelization of Texture Analysis
In order to perform different medical image tasks, especially texture analysis, a very long time as well as a huge amount of data are required, which are considered significant problems. Therefore, parallel algorithms are used to speed up image processing tasks.
Parallel Processing Architectures
Parallel computation can be defined as “efficiently use of multiple processors/computers to execute independent tasks/problems concurrently”. Parallel algorithms should take into consideration both CPU and I/O computation times, data dependency, and communication overheads [24-26].
Parallel architectures are classified as Single Instruction Single Data (SISD), Multiple Instruction Single Data (MISD), Single Instruction Multiple Data (SIMD), and Multiple Instruction Multiple Data (MIMD)
models. SIMD architecture which contains a large number of simple processing elements (PEs) is suitable for low-level image processing such as point or neighborhood operators. On the other hand, MIMD architectures, which consist of sets of interconnected processors/computers (called nodes), are fitting for high-level image processing. MIMD architectures are divided into Shared Memory (SM), Distributed Memory (DM), and Distributed-Shared Memory (DSM) systems. In SM systems, image/images are stored in a common memory and can be accessed by any PE/node at any time. While in DM architectures; where each node has its own local memory; image/ images must be split and distributed to different PEs/nodes and the data are exchanged through messages [27].
Parallel machines that are based on the combination of both shared and distributed memory models are called Distributed-Shared Memory (DSM). In a DSM system, the shared memory is physically distributed to all processors (called local memories). The collection of all local memories forms a global address space accessible by all PEs. Besides distributed memories, globally shared memory can be added to the system. In this case, there are three memory-access patterns, the fastest is local memory access, the next is global memory access, and the slowest is remote memory access. Global image processing operators can be executed on DSM architectures.
Parallel Texture Analysis Related Work
This subsection introduces some existing parallel textural analysis algorithms.
Mursalin [24] in his work designed a "C" coded parallel algorithm to extract textural features from High Content Screening (HCS) data. Threshold adjacency statistics features introduced by Hamilton et al. [28], have been computed to discriminate sub-cellular localization of cells.
You and Bhattacharya [29] proposed a high-performance hierarchical image matching scheme based on wavelet transform. The hierarchical image matching scheme was carried out on an interesting points image pyramid, that is extracted from different levels of sub and images obtained from wavelet transform. The interesting points were obtained at each level based on adaptive thresholding through fuzzy compactness. The matching procedure was directed from the coarse-level in the pyramid to the fine-level through the hierarchical structure. The proposed hierarchical matching scheme was performed on a network of workstation clusters using a parallel virtual machine on the basis of divide-and-conquer strategy.
Woods et al. [30] exhibited a parallel implementation scheme for 4D Haralick texture analysis on PC clusters using task and data parallelism.
Sidiropoulos et al. [31] designed a pattern recognition system to differentiate between benign and malignant breast lesions, based on textural features extracted from digital mammography and ultrasound breast concerning the same patient. The system is developed on commercial
Graphics Processing Unit (GPU) cards using parallel programming.
Zolynski et al. [32] presented an implementation of the LBP texture analysis operator on GPU. Leibstein et al. [33] suggested a texture classification method implemented and parallelized so as to be used on a GPU. The submitted algorithm is a Radial Local Binary Pattern (RLBP) and it is based on the ideas of Zolynski et al. [32].
Furthermore, based on the two previous studies, Leibstein et al. [34] submitted a parallel implementation of a texture analysis classification methodology using a GPU. Various descriptors are applied, including LBP, Multi-Block Local Binary Pattern (MB-LBP) and Radial Multi-Block Local Binary Pattern (MB-LBP). Classification is carried out by obtaining these descriptors from various unique texture classes at several spatial resolutions and rotations.
As formerly discussed, parallel computing techniques have been previously employed in research that developed texture analysis approaches for image processing. However, to the best of our knowledge, there is no issued study of parallel implementation to deal with the specific problem of designing Computer Aided Design (CAD) systems for lung abnormality detection using Laws texture analysis method.
-
III. Lungs Abnormality Detection
This section portrays the implemented lung abnormality detection scheme. It is carried out in four phases: first the preprocessing stage, where the original image slices are processed to remove the irrelevant information or noises and improve their visual appearance. Then, an efficient fully automated lung segmentation scheme is applied on the enhanced images [10] and [17]. In the third stage, Laws masks descriptors are anticipated to extract the textural features from the lung images. Finally, a statistical analysis is performed to select the significant features that are capable of distinguishing among normal, cancerous and pulmonary edema lungs. These stages will be explored in the following subsections.
-
A. The Dataset
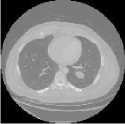
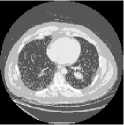
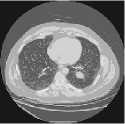
The research is conducted on a real-image set provided by the radiology department at New Elkasr ElAiny teaching hospital, the University of Cairo for the evaluation of lung cancer. The image set consists of nine patients (average age 50.44 years, range from 33 to 75 years, 7 males and 2 females). Four patients (3 males and a female) suffer from lung cancer and five patients (4 males and a female) suffer from pulmonary edema. All patients underwent one imaging session, and they were at the acute stage of lung cancer or pulmonary edema when subjected to the imaging session. In this study, we had excluded patients who had relative contradictions for a CT scan and who had other suspected reasons of lung problems. Twenty CT scans for each patient are considered yielding a total of 180 investigated images. The ethics board of the institution approved this study, which followed the tenets of the Declaration of Helsinki, and all participants provided informed written consent prior to their participation.
-
B. Preprocessing and Lung Segmentation
Preprocessing is a mandatory task in image processing that aims to reduce the noise artifacts and enhance the image quality.
In this work, we implemented the preprocessing algorithm introduced in [10] and [17]. The utilized preprocessing scheme proceeds by first using histogram equalization to improve the lung image contrast. Then, Wiener filter is applied to remove blur in lung images.
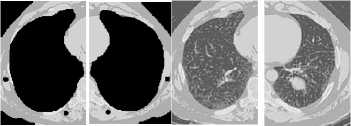
Afterward, we fulfilled the fully automated lung segmentation technique suggested by [10] and [17]. This lung segmentation technique is a two-step method to split up the voxels belonging to lung tissues from the surrounding anatomy within the enhanced CT images. The first step is based on the fact that the air-filled lung tissue is highly distinctive in density from its surrounding tissues. While the second step benefited from the fact that, in the human body, both lungs roughly resemble mirror images of each other.
In the first step, a binary image is created from the enhanced CT image using a threshold of 128. The two lungs are marked and cropped out from the surrounding area. Then, in order to remove white areas within the two lungs, erosion morphological operation is performed.
The second step comprises dividing both the eroded and the cropped original images into two equal parts. In the eroded image, the region that enfolds larger black area is deemed as a lung mask. The lung mask is mirrored in the reverse direction in order to obtain right and left lung masks. These lung masks are projected on the original left and right lung images by multiplying them with the corresponding original image parts. Ultimately, the black pixels in the resulted images are replaced by their corresponding original values other pixels are set to 255. The preprocessing and lung segmentation algorithms are presented in figure 1.
-
C. Laws Texture Features Extraction
Feature extraction is one of the substantive tasks that work toward obtaining high-level information as color, shape, and texture to understand the details of the image. After lung segmentation step Laws texture features are extracted from the segmented lung regions. The Laws technique applies a bank of texture filters to an image to create filtered images from which various texture features are determined.
There are four main primitive geometric attributes that can be explored for an image. Therefore, Laws developed two-dimensional convolution masks or kernels by combining labeled vectors that each signifies a specific feature identified as Level, Edge, Spot, and Ripple. These masks are: L5 = [ 1, 4, 6, 4, 1], E5 = [-1,-2, 0, 2, 1], S5 = [-1, 0, 2, 0,-1] and R5 = [ 1,-4, 6,-4, 1]. Accordingly, 16 different masks are generated each of size 5×5 as illustrated in table 1.
Table 1. The 16 2-D combined Laws masks
|
L5L5 |
L5E5 |
L5S5 |
L5R5 |
|
E5L5 |
E5E5 |
E5S5 |
E5R5 |
|
S5L5 |
S5E5 |
S5S5 |
S5R5 |
|
R5L5 |
R5E5 |
R5S5 |
R5R5 |
Original image
Histogram equalized
Wiener filtered
image image

Thresholded image
The eroded image
The lung mask
Mask projection
Segmented lungs
Fig.1. Preprocessing and segmentation of lungs image
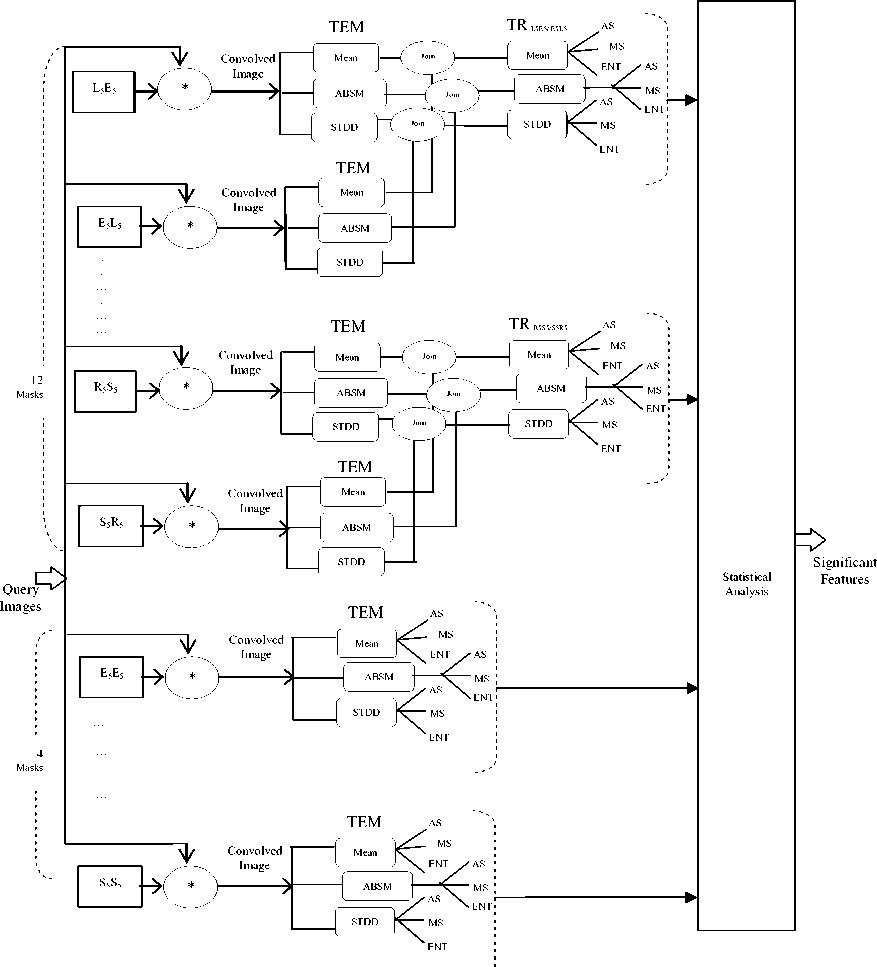
Laws masks are convolved with the segmented lung images, the outputs are then filtered using the Texture Energy Measurement (TEM) filters. This is performed by moving a nonlinear window through the image. Every pixel is compared with its local neighbourhood and consequently replaced with the mean, absolute mean (ABSM) and standard deviation (STDD) of the neighbouring pixels. The three statistical descriptors (S.D.) can be realized as follows:
Yneieighbouring pixels mean =-------------------- w
Y w neighbouring pixels
ABSM =---!-----------------L
w
Y w I neighbouring pixels-mean I
STDD = ^
w
where W is the window size. In this study, we applied 7×7 pixels window.
As a result, three TEM images are created for each image, by replacing every pixel with its corresponding statistical descriptor. Each TEM image is normalized using min-max normalization method so that it is invariant to illumination and contrast variations.
In order to remove the dimensionality bias from the extracted features, TEM descriptors are combined. Thus, For example, since L5E5 and E5L5 measure vertical and horizontal edge content, respectively, joining them generates total edge content [35-36]. Hence, the combined texture energy measurement (TRL5E5/E5L5) is given as follows:
TEMt^ + TEM 5
TRl 5 E 5/ E 5 L 5 =---- L 5^ E 5 L 5 (4)
Accordingly, there are 10 combined texture energy measurements (TR) as shown in Table 2.
Table 2. Combined texture energy measurements (TR)
|
TR L5L5 |
TR S5S5 |
TR L5E5/ E5L5 |
TR E5R5/ R5E5 |
TR S5E5/ E5S5 |
|
TR E5E5 |
TR R5R5 |
TR S5L5/ L5S5 |
TR R5S5/ S5R5 |
TR L5R5/ R5L5 |
Afterward, we calculate three statistical features (S.F.); absolute mean (AS), mean square (MS) or energy and entropy (ENT) for each TR image as follows:
RC
AS = — Y S| I (x, y )|(5)
RCx = 1 y = 1
RC
MS = — Y YI (x, y )2(6)
RCx = 1 y = 1
RC
ENT = — Y YI (x, y)(- ln(I (x, y)))
RCx = 1 y = 1
where I(x,y) is the pixel value, and R and C are image dimensions.
It is clear that the computation of both TR images and extracting texture features are very processing intensive. Therefore, in order to improve the performance of the whole system, we developed a multi-level parallel system for the proposed lung abnormality detection algorithm. Figure 2 presents the proposed system architecture.
-
IV. A Multi-level Parallel System for Lung Abnormality Detection
In this work, a multi-level parallel system is used to speed up the texture analysis for lung abnormality detection process. The first level of parallelization is the coarse grained level where the parallelization is done at the image level (each PE can compute one or more images). In the second level (medium level) parallelization is done in the lung level (that is to say each PE computes one or more lung image). Moreover, in the third level (fine grained level) more than one PE cooperate to compute the work of each lung image. In this level the parallelization is done in the instruction level; (laws masks texture feature extraction level); where feature extraction and feature tracking tasks are divided into small subtasks and executed in parallel.
-
A. Problem Description (Lung abnormality detection process)
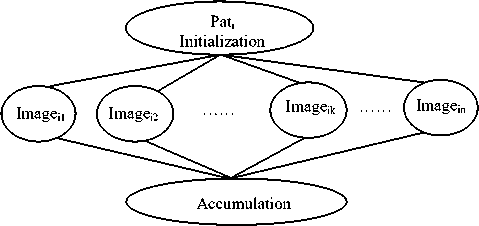
Assume that there are " N " patients, {Pat1, Pat2,..., PatN}.
Each patient Pati has " n " lung images, {imagei1, imagei2,….., imagein} as presented in figure 3-a. Each image is divided into two images namely: left lung image represented by L ij and right lung image signified by R ij . Moreover, each R ij and L ij image is convolved with 16 selected Laws masks. Then, the attained images are filtered and thus three TEM images are constructed for each convolved image. The lung abnormality detection process can be divided into small processes that can be executed in parallel as shown in figure 3-b.
-
B. Parallel Machine Structure
The choice of parallel architecture is an important factor that affects the performance of the parallel design. As mentioned in the previous section there are "N" patients, each patient has "n" lung images, each one is divided into two images, and these images are convolved with Laws masks to detect lung abnormality. The lung abnormality detection operation is capable of being divided into small procedures that can be executed in parallel. That is to say, each patient can be computed separately from the others and they are independent. Therefore, they can be considered as separated tasks. This leads us to use cluster computing architecture. In clusters, powerful low-cost nodes/processing elements are linked through a high-speed network to achieve high-performance parallel computing. Any task that has been assigned to the cluster would run on all cluster nodes in a parallel fashion by breaking the whole task into smaller tasks. Then, the result of the smaller tasks would be combined to form the final result. Clusters are used primarily to run applications that require high availability and high throughput processing [37-38].
Let "N" be the homogenous clusters {C1, C2, ….., CN}, where N = the number of patients. These clusters are connected through an external network. Each cluster consists of "M" PEs {PE0, PE1, PE2, … PEM-1}.
-
C. The Proposed Parallel Model
To exploit parallelism for each patient Pat i , first, the " n " images of that patient are assigned priorities and placed in a list ordered in decreasing values of priority. We assume that the image which needs largest execution time takes the highest priority. In this work, a multi-level parallel scheme is implemented to speed up the texture analysis for lung abnormality detection process.
-
1) Coarse Grained Level of Parallelization (n ≥ M)
When the number of PEs " M " is smaller than or equal to the number of images " n” , each PE will compute "n/M" images.
-
2) Medium Grained Level of Parallelism (n < M ≤ 2n)
When the number of PEs "M" is greater than the number of images "n", more than one PE will cooperate to execute each image. In this case, the parallelization is done on the lung level (PE computes one lung).
That is to say, for M = n + i:
-
■ For the first "i" images in the queue, each image is assigned two PEs (one for each lung),
-
■ For the remaining images, each image is assigned one PE.
-
■ When M=2n, each image is assigned two PEs (one for each lung).
-
3) Third Level of Parallelism (2n < M ≤ 20n)
For both lung images "Rij and Lij" the parallelization is done at the mask level. As mentioned at in section 3.2, the TEM descriptors are combined to generate 10 TRs. As the time needed to generate each TR is very small, we have assumed that one PE is needed for this process. Thus, there will be only 10 tasks to be carried out for each lung.
Assuming that the number of PEs assigned to "R ij and Li j " are "RMi j and LMi j " respectively. For simplicity, we assume that RMi j = LMi j = M/2n. Hence, there will be three cases:
-
■ First , M <20n, RM ij = LM j <10
In this case, each PE assigned 10/LMi j masks, and the remaining (LMij-10) masks are assigned to the lightly loaded PEs.
-
■ Second , M= 20n, RM j = LM y =10
Each PE is assigned one mask.
-
■ Third , 3*20n >M >20n, RM ij = LM ij = (M/2n) >
In this case, the parallelization is done in the level of masks. Initially, the masks of each image are located in a list arranged in descending order of execution time, and three functions Mean, ABSM and STDD are calculated for each mask, as stated in section 3.2. When LMij < 30, each mask is assigned one PE and the remaining (LMi j -10) PEs are assigned to the first ((LM ij -10) /2) masks (each mask is assigned two PEs). In the case of LM ij equals 30, each mask is assigned three PEs (the maximum number of PEs= 600n).
In the next section, we will present an analysis of the various experiments conducted and results obtained.
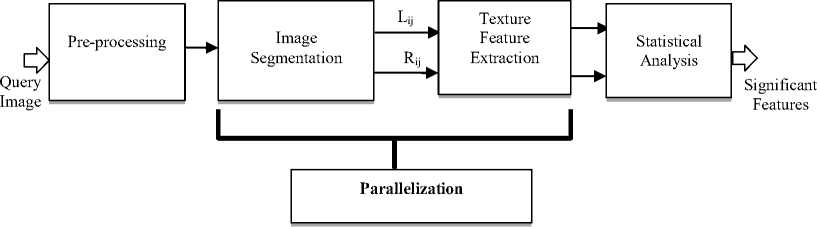
Fig.2. Parallel lung abnormality detection model
(a) DAG representation of the patient Pati
(b) DAG representation of the lung abnormality detection process
Fig.3. Parallel lung abnormalities detection
-
V. Results
This section presents the experiments accomplished to obtain the most significant Laws texture features that can be exploited to detect and discriminate lung abnormalities (cancer or edema). Furthermore, the attained performance improvements of our parallel implementation to the proposed lung abnormality detection system are displayed.
-
A. Statistical Analysis
The statistical values (mean ± standard deviation (STDV)) for all studied Laws masks are reported. Single factor Analysis of Variance (ANOVA) method is fulfilled for each Laws texture feature to obtain the significant features that can discriminate between diseased (cancer or pulmonary edema) and normal lungs, cancer and normal lungs, pulmonary edema and normal lungs, and finally between cancerous and pulmonary edema lungs. The significance level is selected at P < 0.001.
Table 3 displays the significant Laws texture features that can discriminate tumor affected lungs from their normal fellows, while Table 4 illustrates the significant Laws texture features that can differentiate among pulmonary edema and normal lungs. Moreover, the significant Laws texture features are provided: for lung cancer patients vs. pulmonary edema patients in Table 5; for diseased (cancer or edema) lungs vs. normal lungs in Table 6.
Table 3. ANOVA results for cancer patients significant Laws texture features (comparison between AL and FL). AL = Affected Lung; FL = Fellow Lung.
|
Laws mask |
S.D. |
S.F. |
mean ± STDV |
P |
F |
|
|
AL |
FL |
|||||
|
L5S5/S5L5 |
MEAN |
AS |
0.481 ± 0.030 |
0.505 ± 0.036 |
7.9E-06 |
2.1E+01 |
|
MS |
0.236 ± 0.030 |
0.260 ± 0.034 |
4.4E-06 |
2.3E+01 |
||
|
STDD |
AS |
0.184 ± 0.036 |
0.161 ± 0.039 |
6.5E-05 |
1.7E+01 |
|
|
MS |
0.057 ± 0.018 |
0.045 ± 0.016 |
9.8E-06 |
2.1E+01 |
||
|
E5S5/S5E5 |
ABSM |
AS |
0.185 ± 0.038 |
0.160 ± 0.037 |
5.9E-05 |
1.7E+01 |
|
MS |
0.063 ± 0.021 |
0.049 ± 0.019 |
2.2E-05 |
1.9E+01 |
||
|
STDD |
AS |
0.206 ± 0.043 |
0.169 ± 0.052 |
9.5E-08 |
3.1E+01 |
|
|
MS |
0.074 ± 0.024 |
0.052 ± 0.026 |
2.6E-08 |
3.4E+01 |
||
|
L5R5/R5L5 |
STDD |
AS |
0.084 ± 0.021 |
0.071 ± 0.022 |
2.8E-04 |
1.4E+01 |
|
E5R5/R5E5 |
ABSM |
AS |
0.081 ± 0.018 |
0.065 ± 0.020 |
4.0E-07 |
2.8E+01 |
|
MS |
0.020 ± 0.008 |
0.014 ± 0.009 |
2.1E-05 |
1.9E+01 |
||
|
STDD |
AS |
0.091 ± 0.023 |
0.073 ± 0.029 |
1.4E-05 |
2.0E+01 |
|
|
MS |
0.025 ± 0.012 |
0.018 ± 0.013 |
3.0E-04 |
1.4E+01 |
||
|
R5S5/S5R5 |
ABSM |
AS |
0.068 ± 0.017 |
0.056 ± 0.019 |
4.1E-05 |
1.8E+01 |
|
MS |
0.019 ± 0.008 |
0.014 ± 0.008 |
2.1E-04 |
1.4E+01 |
||
|
STDD |
AS |
0.085 ± 0.024 |
0.069 ± 0.029 |
1.1E-04 |
1.6E+01 |
|
|
MS |
0.027 ± 0.012 |
0.020 ± 0.013 |
3.3E-04 |
1.3E+01 |
||
|
S5S5 |
ABSM |
AS |
0.149 ± 0.035 |
0.117 ± 0.034 |
2.5E-08 |
3.4E+01 |
|
MS |
0.045 ± 0.017 |
0.031 ± 0.016 |
6.0E-08 |
3.2E+01 |
||
|
L5L5 |
MEAN |
AS |
0.587 ± 0.097 |
0.649 ± 0.093 |
5.9E-05 |
1.7E+01 |
|
MS |
0.481 ± 0.087 |
0.532 ± 0.089 |
3.7E-04 |
1.3E+01 |
||
|
ABSM |
AS |
0.587 ± 0.097 |
0.649 ± 0.093 |
5.9E-05 |
1.7E+01 |
|
|
MS |
0.481 ± 0.087 |
0.532 ± 0.089 |
3.7E-04 |
1.3E+01 |
||
Table 4. ANOVA results for edema patients significant Laws texture features (comparison between AL and FL). AL = Affected Lung; FL = Fellow Lung.
|
Laws mask |
S.D. |
S.F. |
mean ± STDV |
P |
F |
|
|
AL |
FL |
|||||
|
L5E5/E5L5 |
ABSM |
AS |
0.187 ± 0.040 |
0.143 ± 0.036 |
4.2E-14 |
6.6E+01 |
|
MS |
0.062 ± 0.020 |
0.040 ± 0.015 |
2.0E-16 |
8.1E+01 |
||
|
STDD |
AS |
0.193 ± 0.040 |
0.155 ± 0.038 |
8.3E-11 |
4.7E+01 |
|
|
MS |
0.062 ± 0.020 |
0.044 ± 0.017 |
1.1E-11 |
5.2E+01 |
||
|
L5S5/S5L5 |
ABSM |
AS |
0.168 ± 0.035 |
0.133 ± 0.036 |
1.9E-10 |
4.5E+01 |
|
MS |
0.048 ± 0.017 |
0.034 ± 0.014 |
1.6E-10 |
4.6E+01 |
||
|
STDD |
AS |
0.189 ± 0.039 |
0.148 ± 0.039 |
7.6E-12 |
5.3E+01 |
|
|
MS |
0.060 ± 0.020 |
0.040 ± 0.016 |
4.0E-12 |
5.5E+01 |
||
|
E5S5/S5E5 |
ABSM |
AS |
0.203 ± 0.045 |
0.135 ± 0.048 |
1.7E-18 |
9.4E+01 |
|
MS |
0.073 ± 0.025 |
0.038 ± 0.022 |
2.6E-19 |
1.0E+02 |
||
|
STDD |
AS |
0.224 ± 0.049 |
0.147 ± 0.052 |
1.7E-19 |
1.0E+02 |
|
|
MS |
0.085 ± 0.029 |
0.044 ± 0.026 |
3.0E-20 |
1.1E+02 |
||
|
L5R5/R5L5 |
MEAN |
AS |
0.542 ± 0.042 |
0.515 ± 0.033 |
2.9E-06 |
2.3E+01 |
|
MS |
0.296 ± 0.045 |
0.267 ± 0.035 |
2.6E-06 |
2.3E+01 |
||
|
ABSM |
AS |
0.075 ± 0.014 |
0.064 ± 0.019 |
9.7E-06 |
2.1E+01 |
|
|
STDD |
AS |
0.084 ± 0.016 |
0.072 ± 0.022 |
2.0E-05 |
1.9E+01 |
|
|
E5R5/R5E5 |
ABSM |
AS |
0.088 ± 0.020 |
0.070 ± 0.023 |
3.6E-08 |
3.3E+01 |
|
MS |
0.022 ± 0.007 |
0.017 ± 0.009 |
4.9E-06 |
2.2E+01 |
||
|
STDD |
AS |
0.103 ± 0.024 |
0.083 ± 0.029 |
8.6E-07 |
2.6E+01 |
|
|
MS |
0.031 ± 0.010 |
0.023 ± 0.013 |
8.2E-06 |
2.1E+01 |
||
|
R5S5/S5R5 |
ABSM |
AS |
0.077 ± 0.019 |
0.062 ± 0.022 |
2.2E-06 |
2.4E+01 |
|
MS |
0.022 ± 0.007 |
0.017 ± 0.009 |
6.3E-06 |
2.2E+01 |
||
|
STDD |
AS |
0.097 ± 0.025 |
0.079 ± 0.029 |
9.0E-06 |
2.1E+01 |
|
|
MS |
0.033 ± 0.012 |
0.024 ± 0.013 |
3.7E-06 |
2.3E+01 |
||
|
S5S5 |
ABSM |
AS |
0.157 ± 0.034 |
0.100 ± 0.041 |
4.7E-20 |
1.1E+02 |
|
MS |
0.048 ± 0.015 |
0.025 ± 0.017 |
4.0E-19 |
9.9E+01 |
||
|
L5L5 |
MEAN |
AS |
0.610 ± 0.098 |
0.693 ± 0.078 |
9.8E-12 |
5.2E+01 |
|
MS |
0.488 ± 0.096 |
0.554 ± 0.084 |
2.3E-07 |
2.9E+01 |
||
|
ABSM |
AS |
0.610 ± 0.098 |
0.693 ± 0.078 |
9.8E-12 |
5.2E+01 |
|
|
MS |
0.488 ± 0.096 |
0.554 ± 0.084 |
2.3E-07 |
2.9E+01 |
||
|
E5E5 |
ABSM |
AS |
0.218 ± 0.040 |
0.148 ± 0.047 |
6.6E-23 |
1.3E+02 |
|
MS |
0.084 ± 0.024 |
0.045 ± 0.025 |
8.2E-26 |
1.5E+02 |
||
|
R5R5 |
ABSM |
AS |
0.062 ± 0.015 |
0.050 ± 0.021 |
1.8E-05 |
1.9E+01 |
|
MS |
0.019 ± 0.006 |
0.014 ± 0.009 |
4.5E-07 |
2.7E+01 |
||
Table 5. ANOVA results for patients significant Laws texture features edema vs. cancer patients (comparison between EL and CL). EL = Edema Lung; CL = Cancer Lung.
|
Laws mask |
S.D. |
S.F. |
mean ± STDV |
P |
F |
|
|
EL |
CL |
|||||
|
L5E5/E5L5 |
MEAN |
ENT |
4.522 ± 0.230 |
4.737 ± 0.044 |
5.0E-07 |
2.7E+01 |
|
ABSM |
AS |
0.275 ± 0.070 |
0.273 ± 0.025 |
7.8E-04 |
1.2E+01 |
|
|
ENT |
4.384 ± 0.246 |
4.615 ± 0.047 |
6.4E-04 |
1.2E+01 |
||
|
STDD |
ENT |
4.406 ± 0.248 |
4.645 ± 0.047 |
3.6E-04 |
1.3E+01 |
|
|
L5S5/S5L5 |
MEAN |
AS |
0.546 ± 0.031 |
0.508 ± 0.023 |
9.5E-16 |
7.8E+01 |
|
MS |
0.303 ± 0.033 |
0.263 ± 0.024 |
9.2E-16 |
7.8E+01 |
||
|
ENT |
4.529 ± 0.230 |
4.743 ± 0.042 |
6.9E-07 |
2.7E+01 |
||
|
ABSM |
ENT |
4.388 ± 0.249 |
4.622 ± 0.047 |
4.2E-04 |
1.3E+01 |
|
|
STDD |
ENT |
4.408 ± 0.249 |
4.648 ± 0.047 |
2.6E-04 |
1.4E+01 |
|
|
E5S5/S5E5 |
MEAN |
ENT |
4.528 ± 0.229 |
4.743 ± 0.042 |
5.8E-07 |
2.7E+01 |
|
ABSM |
ENT |
4.388 ± 0.249 |
4.622 ± 0.046 |
4.1E-04 |
1.3E+01 |
|
|
STDD |
ENT |
4.407 ± 0.247 |
4.647 ± 0.046 |
2.4E-04 |
1.4E+01 |
|
|
L5R5/R5L5 |
MEAN |
AS |
0.556 ± 0.042 |
0.482 ± 0.031 |
1.1E-16 |
8.4E+01 |
|
MS |
0.312 ± 0.046 |
0.234 ± 0.029 |
9.3E-17 |
8.5E+01 |
||
|
ENT |
4.531 ± 0.229 |
4.745 ± 0.042 |
6.1E-07 |
2.7E+01 |
||
|
ABSM |
ENT |
4.346 ± 0.235 |
4.593 ± 0.047 |
1.4E-04 |
1.5E+01 |
|
|
STDD |
ENT |
4.323 ± 0.229 |
4.572 ± 0.048 |
8.0E-05 |
1.6E+01 |
|
|
E5R5/R5E5 |
MEAN |
ENT |
4.531 ± 0.229 |
4.745 ± 0.042 |
6.0E-07 |
2.7E+01 |
|
ABSM |
ENT |
4.321 ± 0.233 |
4.567 ± 0.043 |
1.8E-04 |
1.5E+01 |
|
|
STDD |
ENT |
4.301 ± 0.229 |
4.543 ± 0.044 |
1.2E-04 |
1.6E+01 |
|
|
R5S5/S5R5 |
MEAN |
ENT |
4.530 ± 0.229 |
4.745 ± 0.042 |
5.9E-07 |
2.7E+01 |
|
ABSM |
ENT |
4.253 ± 0.236 |
4.499 ± 0.043 |
2.3E-04 |
1.4E+01 |
|
|
STDD |
ENT |
4.244 ± 0.234 |
4.480 ± 0.047 |
1.7E-04 |
1.5E+01 |
|
|
S5S5 |
MEAN |
ENT |
4.516 ± 0.230 |
4.727 ± 0.042 |
6.2E-07 |
2.7E+01 |
|
ABSM |
ENT |
4.373 ± 0.241 |
4.601 ± 0.045 |
3.3E-04 |
1.3E+01 |
|
|
STDD |
AS |
0.278 ± 0.079 |
0.319 ± 0.041 |
3.9E-07 |
2.8E+01 |
|
|
MS |
0.118 ± 0.060 |
0.144 ± 0.033 |
7.7E-07 |
2.6E+01 |
||
|
ENT |
4.395 ± 0.245 |
4.636 ± 0.047 |
4.2E-04 |
1.3E+01 |
||
|
L5L5 |
MEAN |
ENT |
4.474 ± 0.246 |
4.726 ± 0.044 |
4.2E-05 |
1.8E+01 |
|
ABSM |
ENT |
4.377 ± 0.241 |
4.601 ± 0.046 |
4.2E-05 |
1.8E+01 |
|
|
STDD |
AS |
0.319 ± 0.096 |
0.304 ± 0.036 |
6.1E-06 |
2.2E+01 |
|
|
MS |
0.154 ± 0.066 |
0.131 ± 0.025 |
7.5E-08 |
3.2E+01 |
||
|
ENT |
4.389 ± 0.249 |
4.633 ± 0.047 |
2.6E-04 |
1.4E+01 |
||
|
E5E5 |
MEAN |
ENT |
4.527 ± 0.230 |
4.741 ± 0.042 |
5.5E-07 |
2.7E+01 |
|
ABSM |
AS |
0.258 ± 0.072 |
0.260 ± 0.042 |
2.6E-06 |
2.4E+01 |
|
|
MS |
0.110 ± 0.054 |
0.108 ± 0.033 |
6.6E-06 |
2.2E+01 |
||
|
ENT |
4.372 ± 0.243 |
4.602 ± 0.044 |
5.6E-04 |
1.2E+01 |
||
|
STDD |
AS |
0.292 ± 0.073 |
0.303 ± 0.051 |
9.6E-05 |
1.6E+01 |
|
|
ENT |
4.394 ± 0.246 |
4.631 ± 0.046 |
4.2E-04 |
1.3E+01 |
||
|
R5R5 |
MEAN |
ENT |
4.526 ± 0.230 |
4.740 ± 0.042 |
5.9E-07 |
2.7E+01 |
|
ABSM |
ENT |
4.296 ± 0.313 |
4.601 ± 0.046 |
2.7E-04 |
1.4E+01 |
|
|
STDD |
AS |
0.278 ± 0.133 |
0.304 ± 0.039 |
1.3E-06 |
2.5E+01 |
|
|
MS |
0.132 ± 0.076 |
0.134 ± 0.028 |
2.4E-06 |
2.4E+01 |
||
|
ENT |
4.310 ± 0.322 |
4.628 ± 0.046 |
8.6E-04 |
1.1E+01 |
||
From Table 3, we can realize that • the masks E5S5/S5E5, E5R5/R5E5 and
R5S5/S5R5 with ABSM and STDD descriptors
-
• the mask L5S5/S5L5 with mean and STDD (AS and MS features),
descriptors (AS and MS features), • the mask L5R5/R5L5 with STDD descriptor (AS feature),
-
• the mask S5S5 with ABSM descriptor (AS and MS features) and
-
• the mask L5L5 with mean and ABSM descriptors (AS and MS features)
represent the significant Laws texture features that can discriminate between cancerous lungs and their normal fellows.
Table 4, on the other hand, indicates that
-
• the masks L5E5/E5L5, L5S5/S5L5, E5S5/S5E5, E5R5/R5E5 and R5S5/S5R5 with ABSM and
STDD descriptors (AS and MS features),
-
• the mask L5R5/R5L5 with mean (AS and MS features), ABSM and STDD descriptors (AS feature) and
-
• the masks S5S5, E5E5 and R5R5 with ABSM descriptor (AS and MS features)
-
• the mask L5L5 with mean and ABSM descriptors (AS and MS features)
are the most discriminating Laws texture features that can separate pulmonary edema lungs from their normal fellows.
Table 6. ANOVA results for (cancer or edema) patients significant Laws texture features (comparison between DL and NL). DL = Diseased Lung; NL = Normal Lung.
|
Laws mask |
S.F. |
S.D. |
mean ± STDV |
P |
F |
|
|
DL |
NL |
|||||
|
L5E5/E5L5 |
ABSM |
AS |
0.180 ± 0.036 |
0.155 ± 0.036 |
1.5E-10 |
4.3E+01 |
|
MS |
0.058 ± 0.017 |
0.046 ± 0.015 |
2.7E-12 |
5.2E+01 |
||
|
STDD |
AS |
0.188 ± 0.036 |
0.164 ± 0.038 |
3.4E-09 |
3.7E+01 |
|
|
MS |
0.060 ± 0.018 |
0.049 ± 0.017 |
2.1E-09 |
3.8E+01 |
||
|
L5S5/S5L5 |
ABSM |
AS |
0.165 ± 0.034 |
0.140 ± 0.036 |
4.2E-11 |
4.6E+01 |
|
MS |
0.047 ± 0.016 |
0.036 ± 0.014 |
1.0E-11 |
5.0E+01 |
||
|
STDD |
AS |
0.187 ± 0.037 |
0.154 ± 0.039 |
3.8E-15 |
6.8E+01 |
|
|
MS |
0.058 ± 0.019 |
0.042 ± 0.016 |
2.8E-16 |
7.4E+01 |
||
|
E5S5/S5E5 |
ABSM |
AS |
0.195 ± 0.043 |
0.146 ± 0.048 |
3.4E-21 |
1.0E+02 |
|
MS |
0.068 ± 0.024 |
0.043 ± 0.022 |
2.5E-22 |
1.1E+02 |
||
|
STDD |
AS |
0.216 ± 0.047 |
0.157 ± 0.052 |
2.2E-25 |
1.3E+02 |
|
|
MS |
0.080 ± 0.028 |
0.048 ± 0.026 |
1.2E-26 |
1.3E+02 |
||
|
L5R5/R5L5 |
ABSM |
AS |
0.074 ± 0.016 |
0.064 ± 0.019 |
6.3E-08 |
3.1E+01 |
|
MS |
0.014 ± 0.005 |
0.012 ± 0.006 |
5.4E-04 |
1.2E+01 |
||
|
STDD |
AS |
0.084 ± 0.019 |
0.072 ± 0.022 |
2.2E-08 |
3.3E+01 |
|
|
MS |
0.019 ± 0.008 |
0.016 ± 0.009 |
8.5E-05 |
1.6E+01 |
||
|
E5R5/R5E5 |
ABSM |
AS |
0.085 ± 0.019 |
0.068 ± 0.023 |
1.3E-13 |
5.9E+01 |
|
MS |
0.021 ± 0.008 |
0.016 ± 0.009 |
6.6E-10 |
4.0E+01 |
||
|
STDD |
AS |
0.097 ± 0.025 |
0.078 ± 0.029 |
1.1E-10 |
4.4E+01 |
|
|
MS |
0.028 ± 0.011 |
0.021 ± 0.013 |
2.2E-08 |
3.3E+01 |
||
|
R5S5/S5R5 |
ABSM |
AS |
0.073 ± 0.019 |
0.059 ± 0.022 |
7.1E-10 |
4.0E+01 |
|
MS |
0.020 ± 0.008 |
0.015 ± 0.009 |
8.0E-09 |
3.5E+01 |
||
|
STDD |
AS |
0.092 ± 0.025 |
0.075 ± 0.029 |
7.1E-09 |
3.5E+01 |
|
|
MS |
0.030 ± 0.012 |
0.022 ± 0.013 |
9.6E-09 |
3.5E+01 |
||
|
S5S5 |
ABSM |
AS |
0.174 ± 0.040 |
0.151 ± 0.038 |
2.2E-26 |
1.3E+02 |
|
MS |
0.061 ± 0.022 |
0.048 ± 0.019 |
7.4E-25 |
1.2E+02 |
||
|
L5L5 |
MEAN |
AS |
0.480 ± 0.051 |
0.491 ± 0.063 |
5.0E-14 |
6.2E+01 |
|
MS |
0.247 ± 0.065 |
0.255 ± 0.074 |
4.7E-10 |
4.1E+01 |
||
|
ABSM |
AS |
0.185 ± 0.038 |
0.159 ± 0.041 |
5.0E-14 |
6.2E+01 |
|
|
MS |
0.067 ± 0.021 |
0.053 ± 0.022 |
4.7E-10 |
4.1E+01 |
||
|
E5E5 |
ABSM |
AS |
0.157 ± 0.038 |
0.132 ± 0.036 |
1.1E-15 |
7.0E+01 |
|
MS |
0.050 ± 0.019 |
0.037 ± 0.015 |
6.3E-16 |
7.2E+01 |
||
|
R5R5 |
ABSM |
AS |
0.173 ± 0.040 |
0.147 ± 0.045 |
2.2E-07 |
2.8E+01 |
|
MS |
0.059 ± 0.025 |
0.046 ± 0.026 |
4.1E-08 |
3.1E+01 |
||
Furthermore, from Table 5, we can perceive that some Laws texture features of pulmonary edema affected lungs are significantly different than that of the tumor affected lungs. These features are described below:
-
• the mask L5E5/E5L5 with ABSM descriptor (AS and ENT features), mean and STDD descriptors (ENT feature),
-
• the mask L5S5/S5L5 and L5R5/R5L5 with mean descriptor (AS, MS and ENT features), ABSM and STDD descriptors (ENT feature),
-
• the masks E5S5/S5E5, E5R5/R5E5 and
R5S5/S5R5 with mean, ABSM and STDD descriptors (ENT feature),
-
• the masks and S5S5, L5L5 and R5R5 with mean and ABSM descriptors (ENT feature) and STDD descriptor (AS, MS and ENT features) and
the mask E5E5 with mean and STDD descriptors (ENT feature) and ABSM descriptor (AS, MS and ENT features).
In addition, the significant features that differentiate among diseased and normal lungs are reported in Table 6 as follows:
-
• the masks L5E5/E5L5, L5S5/S5L5, E5S5/S5E5,
L5R5/R5L5, E5R5/R5E5 and R5S5/S5R5 with ABSM and STDD descriptors (AS and MS features),
-
• the masks S5S5, E5E5 and R5R5 with ABSM descriptor (AS and MS features) and
-
• the mask L5L5 with mean and ABSM descriptors (AS and MS features).
-
B. Parallel Performance
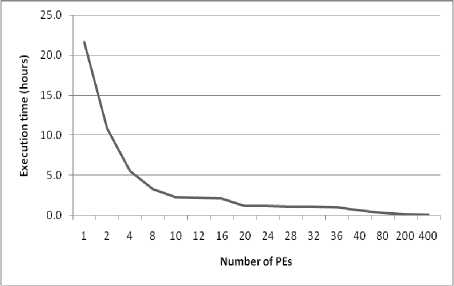
Both sequential and parallel implementations of texture feature analysis scheme for lung abnormality detection are reported. The time needed to execute all images sequentially is almost 22 hours on an Intel processor with a quad core of 4GHz. Extracting the texture features through various masks are very time-consuming. Hence, it is necessary to find out an optimized implementation to solve this problem. By using parallel computation the implementation of texture features extraction can be recovered to improve the performance of the lung abnormality detection. Many performance metrics have been proposed to quantify the parallel systems. Among of them are: parallel execution time, speed up, efficiency and sequential versus parallel execution [39]. Figure 4 depicts the performance of the proposed parallel lung abnormality detection model for different cluster architecture (M= 2 to 400).
-
• Figure (4-a) summarizes the total parallel execution time for a different number of PEs (from 2 to 400). It is shown that as the number of PEs increases, the execution time decreases. The reduction is approximately 50% as the number of PEs increases from one to two, while the total execution time decreases by about 25% when the number of PEs equals four. In the case of increasing the number of PEs to 20 the execution time decreases to 10% of its equivalent sequential time.
-
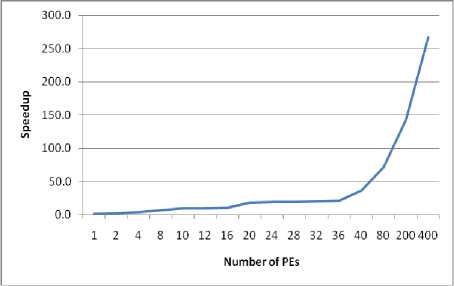
• Upon increasing the number of PEs, the speed up will increase as presented in figure (4-b).
-
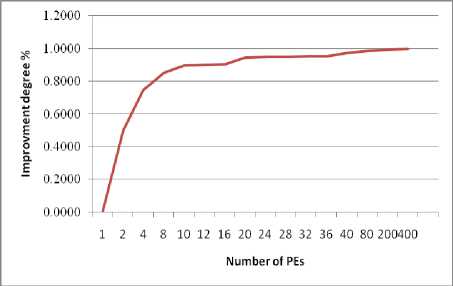
• Figure (4-c) portrays the degree of improvement, compared to the sequential performance for M =2 to 400. The proposed parallel method enhance the performance of the lung abnormality detection algorithm by 49.8%, 74.4%, 84.9%, 89.6%, 94.5%, 95%, 97.2%, 98.5%, 99.2%, and 99.6% for 2, 4, 8, 10, 20, 32, 40, 80, 200, and 400 PEs, respectively.
-
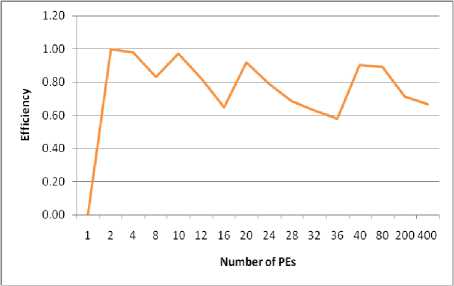
• Figure (4-d) illustrates the system efficiency. This figure shows that the efficiency decreases at (M mod n =1) until reaches (M mod n =0) it increases. That is because at each (M mod n =0) all PEs are assigned the same number of tasks
(images/lungs/or masks) and the load is balanced between all PEs.
-
• Increasing the number of PEs reduces the total execution time but correspondingly increases the cost overhead and reduces the system efficiency. To obtain a reasonable efficiency, we will be satisfied with an improved degree equals to 98% with efficiency equals to 66%, which can be satisfied when M=20n. That is to say when increasing the number of PEs than "20n" the
system will not become optimal in terms of cost. Furthermore, to increase the system efficiency, the load can be redistributed between PEs. In this case, two underloaded PEs can help each overloaded PE to execute its task (mask level). Hence, after load balancing, the efficiency is significantly increased to 75%.
-
C. Discussion
In view of the obtained results, we can conclude that MS (using L5R5/R5L5 with ABSM and STDD descriptors) are deemed better biomarkers to significantly distinguish among diseased and normal lungs, while they are not in other cases. Similarly, AS (using S5S5, L5L5, E5E5 and R5R5 with STDD descriptor) and MS (using S5S5, L5L5, and R5R5 with STDD descriptor) are considered discriminative attributes between pulmonary edema and cancerous lungs only. The most interesting parameter in these results is “ENT” (for all masks using all feature descriptors), which exclusively differentiates cancer cases from edema cases.
Furthermore, the features that are significantly discriminate cancerous lungs vs. normal or pulmonary edema are AS and MS (using L5S5 with mean descriptor). While those who substantially distinguish among edema and normal or tumorous lungs are AS and MS (using L5R5 with mean descriptor). Besides, AS (using L5S5/S5L5, L5R5/R5L5 and R5R5 with ABSM descriptor as well as L5E5/E5L5 with STDD descriptor) and MS (using L5E5/E5L5, L5S5/S5L5 and R5R5 with ABSM descriptor as well as L5E5/E5L5 with STDD descriptor) differentiate significantly between normal lungs and diseased or edema affected lungs.
On the other hand, our suggested parallel framework has tremendously improved the entire system performance. Our findings show that the parallel scheme reduces the computational time by a factor of "98%" over non-parallel implementations with efficiency equals to 66%. After load balancing, a reasonable efficiency equals to 75% is obtained. Moreover, the proposed parallel design is scalable (increasing the number of images and the number of PEs improves the system performance).
Fulfilling the global throughput targets of different applications is an important challenge in parallel computing. Different parameters such as the number of nodes, communication overhead, and etc. affect the overall system performance. Optimizing the cost of system resources usage is an important problem. The cost of optimal cluster composition specifies the number of PEs/nodes that enables the execution of the given tasks while minimizing the cost. In this work, we tried to balance the trade-off between cost and performance by implementing cluster architecture. In the case of a small number of patients (tens), one cluster can be used to compute patients sequentially, while the tasks of each patient are executed in parallel. While In the case of a large number of patients (hundreds) more than one cluster can compute one or more patients.
(a)
abnormalities emerged in human lungs. Our focus in this work is on two common abnormalities; pulmonary edema and lung tumor. The proposed algorithm rooted on extracting Laws texture features, which are based on micro-texture masks that are designed to detect certain texture patterns at different orientations.
(b)
The results demonstrate that Laws texture features exhibited high efficiency in differentiating among normal, edema and cancerous lungs. The performed feature analysis shows that “ENT” (for all masks using all feature descriptors) is significantly different in edema patients vs. cancer patients while it is not in edema or cancer patients vs. normal. In view of the fact that “ENT” refers to the amount of randomness or the amount of disorder in the image, this can be explained as cancer produces a localized heterogeneous masses in the diseased region within the lung, while edema generates heterogeneous disorder within the entire lung image. Moreover, AS (using S5S5, L5L5, E5E5, and R5R5 with STDD descriptor) and MS (using S5S5, L5L5, and R5R5 with STDD descriptor) are good biomarkers that can separate tumor cases from edema cases. Additionally, MS (using L5R5/R5L5 with ABSM and STDD descriptors) are good biomarkers that can significantly discriminate among normal and diseased lungs (cancer or edema).
(c)
Even though the proposed method has proven to be very efficient, a huge amount of time and data are needed. Therefore, parallel algorithms are used to speed up the overall system. In this work, multi-level parallel architecture is implemented to handle the huge amount of data as well as reduce the computational time. The proposed parallel scheme achieves 49.8%, 74.4%, 84.9%, 89.6%, 94.5%, 95%, 97.2%, 98.5%, 99.2%, and 99.6% execution time improvement comparing with its sequential method, for 2, 4, 8, 10, 20, 32, 40, 80, 200, and 400 PEs respectively.
(d)
Fig.4. System performance for different cluster architectures
The choice of parallel architecture is an important factor that affects the performance of the parallel design. Our experimental results indicate that the proposed algorithm's performance using the clusters system is the best choice. Meanwhile, the experiments also disclose that clusters are useful when only a large number of patients are available.
The proposed system may be extended to include other lung diseases. Furthermore, once a computer cluster is available, we will be able to test the proposed algorithm in a much larger dataset. Hence, the overall system performance can be improved.
References A multi-level parallel system for laws masks abnormality lung detection
- A. Materka and M. Strzelecki, “Texture analysis methods: a review,” Technical Univ. of Lodz, Institute of Electronics, COST B11 report, Brussels, 1998.
- H. Elnemr, N. Zayed and M. Fakhreldein, “Feature extraction techniques: fundamental concepts and survey,” Handbook of Research on Emerging Perspectives in Intelligent Pattern Recognition, Analysis, and Image Processing, 2015.
- U. Paul, P. Banerjee, A. Mukherjee and S. Bandhyopadhyay, “Technologies in texture analysis: a review,” British Journal of Applied Science & Technology, vol. 13, pp. 1-21, 2016.
- A. Ahmad and M. R. Daliri, “A review on texture analysis methods in biomedical image processing,” OMICS Journal of Radiology, vol. 5, pp. e136, April 2016. doi:10.4172/2167-7964.1000e136
- R. Lakshmi, E. Reddy and K. Sekharaiah, “Texture Analysis Based on Micro Primitive Descriptor (MPD),” I. J. Modern Education and Computer Science, vol. 2, pp. 32-41, February 2015. doi: 10.5815/ijmecs.2015.02.05
- M. Soumya, K. Sneha and C. Arunvinodh, “Cervical cancer detection and classification using texture analysis,” Biomedical & Pharmacology J., vol. 9, pp. 663-671, 2016.
- N. Sharma, A. K. Ray, S. Sharma, K. K. Shukla, S. Pradhan and L. M. Aggarwal, “Segmentation and classification of medical images using texture-primitive features: Application of BAM-type artificial neural network,” J Med Phys, vol. 33, pp. 119-126, July 2008. doi: 10.4103/0971-6203.42763.
- A. Ahmad and P. Kabiri, “Multispectral MRI image segmentation using Markov random field model,” Signal, Image and Video Processing, vol. 10, pp. 251-258, February 2016.
- S. Giraddi, J. Pujari and S. Seeri, “Role of GLCM Features in Identifying Abnormalities in the Retinal Images,” I. J. Image, Graphics and Signal Processing, vol. 6, pp. 45-51, May 2015. doi: 10.5815/ijigsp.2015.06.06.
- N. Zayed and H. Elnemr, “Statistical analysis of haralick texture features to discriminate lung abnormalities,” Int. J. of Biomedical Imaging, vol. 2015, pp. 1-7, September 2015.
- A. Ben Taieb, M. S. Nosrati, H. Li-Chang, D. Huntsman and G. Hamarneh, “Clinically-inspired automatic classification of ovarian carcinoma subtypes,” J. Pathol Inform, vol. 7, pp. 28, September 2016.
- A. Ahmad and M. R. Daliri, “Rotation invariant texture classification using extended wavelet channel combining and LL channel filter bank,” Knowl.-Based Syst., vol. 97, pp. 75–88, April 2016.
- Z. Zou, J. Yang, V. Megalooikonomou, R. Jennane, E. Cheng and H. Ling, “Trabecular bone texture classification using wavelet leaders,” In Proc. SPIE 9788, Medical Imaging 2016: Biomedical Applications in Molecular, Structural, and Functional Imaging, 97880E, 29 March, 2016. doi: 10.1117/12.2216452
- S. Saxena, S. Sharma and N. Sharma, “Parallel image processing techniques, benefits and limitations,” Research Journal of Applied Sciences, Engineering and Technology, vol. 12, pp. 223-238, January 2016.
- M. Emmanuel, D. R. Ramesh-Babu, J. Jagdale, P. Game and G. P. Potdar, “Parallel approach for content based medical image retrieval system,” Journal of. Computer Science, vol. 6, pp. 1258-1262, 2010. doi: 10.3844/jcssp.2010.1258.1262
- A. Reményi, S. Szénási, I. Bándi, Z. Vámossy, G. Valcz, P. Bogdanov, S. Sergyán and M. Kozlovszky, “Parallel biomedical image processing with GPUs in cancer research,” In Proc. 3rd IEEE Int. Symp. on Logistics and Industrial Informatics, Budapest, p. 245-248, August 2011.
- H. Elnemr, “Statistical analysis of laws mask texture features for cancer and water lung detection,” Int. J. of Comput. Sci. Issues, vol. 10, pp. 196-202, November 2013.
- W. Sun, X. Huang, T. Tseng, J. Zhang and W. Qian, “Computerized lung cancer malignancy level analysis using 3D texture features,” SPIE 9785, Medical Imaging 2016: Computer-Aided Diagnosis, March 2016.
- J. Yao, A. Dwyer, R. M. Summers, and D. J. Mollura, “Computer-aided diagnosis of pulmonary infections using texture analysis and support vector machine classification,” Academic Radiology, vol. 18, pp. 306–314, March 2011. doi: 10.1016/j.acra.2010.11.013.
- S. Kulkarni and R. Shelke, “Multiresolution analysis for medical image segmentation using wavelet transform,” Int. J. of Emerging Technology and Advanced Engineering, vol. 4, pp. 543-545, June 2014.
- LD. Wang, XY. Tai and TE. Ba, “Medical image retrieval based on wavelet transform texture analysis,” Chinese Journal of Medical Instrumentation, vol. 30, pp. 102-105, March 2006.
- A. Depeursinge, D. Sage, A. Hidkin, A. Platon, et al., “Lung tissue classification using wavelet frames,” In Proc. 29th Annual Int. Conf. of IEEE, Eng. in Medicine and Biology Society, EMBS, France, August 2007.
- A. Alivar, H. Danyali and M. Helfroush, “Hierarchical classification of normal, fatty and heterogeneous liver diseases from ultrasound images using serial and parallel feature fusion,” Biocybernetics and Biomedical Engineering, vol. 36, pp. 697-707, 2016.
- T. E-Mursalin, “Parallel image processing for high content screening data,” Master Thesis, Mcmaster Univ., Biomedical Engineering, January 2013.
- V. Kumar, A. Grama, A. Gupta and G. Karypis, “Introduction to parallel computing: design and analysis of algorithms,” Benjamin-Cummings Publishing Co., 2nd ed., ACM Press, 2003.
- B. Barney, “Introduction to parallel computing,” Retrieved from Lawsrence Livermore National Laboratory, https://computing.llnl.gov/tutorials/parallel_comp/, 2010.
- T. Bräunl, S. Feyrer, W. Rapf and M. Reinhardt,"Parallel Image Processing," Springer-Verlag Berlin Heidelberg, 2001.
- N. Hamilton, R. Pantelic, K. Hanson and R. Teasdale, “Fast automated cell phenotype image classification,” BMC bioinformatics, vol. 8, March 2007.
- J. You and P. Bhattacharya, “A wavelet-based coarse-to-fine image matching scheme in a parallel virtual machine environment,” IEEE Trans. on Image Processing, vol. 9, pp. 1547-1559, September 2000.
- B. Woods, B. Clymer, J. Saltz and T. Kurc, “A parallel implementation of 4-dimensional haralick texture analysis for disk-resident image datasets,” In Proc. ACM/IEEE Supercomputing Conf., USA, p. 48-48, November 2004.
- K. Sidiropoulos, S. Kostopoulos, D. Glotsos, E. Athanasiadis, et al., “Multimodality GPU-based computer-assisted diagnosis of breast cancer using ultrasound and digital mammography images,”. Int. J. Comput. Assisted Radiology and Surgery, vol. 8, pp. 547–560, July 2013.
- G. Zolynski, T. Braun and K. Berns, “Local binary pattern based texture analysis in real time using a graphics processing unit,” In Proc. Robotik 2008, vol. 2012, p. 321–325, June 2008.
- J. Leibstein, A. Findt and A. Nel, “Texture classification using local binary patterns on modern graphics hardware,” In Proc. SATNAC, Spier Estates, Cape Town, 2010.
- J. Leibstein, A. Findt and A. Nel, “Efficient texture classification using local binary patterns on a graphics processing unit,” In Proc. 21st annual Symp. of the Pattern Recognition Association of South Africa, p.147–152, 2010.
- M. Rachidi, A. Marchadier, C. Gadois, E. Lespessailles, et al., “Laws masks descriptors applied to bone texture analysis: an innovative and discriminate tool in osteoporosis,” Skeletal Radiology, vol. 37, pp. 541–548, June 2008.
- H. Seng, T. Swee and Y. Chai, “Research on laws mask texture analysis system reliability,” Research J. of Applied Sciences, Engineering and Technology, vol. 7, pp. 4002-4007, May 2014.
- K. Hwang, G. Fox and J. Dongarra, “Chapter 1: System Models and Enabling Technologies,” Distributed computing: clusters, grids and clouds, Morgan Kaufmann, Elsevier, Inc., May 2010.
- M. Anjomshoa, M. Salleh and M. Kermani, “A taxonomy and survey of distributed computing systems,” J. Applied Sciences, vol. 15, pp. 46-57, 2015. doi: 10.3923/jas.2015.46.57
- S. Makka and B. Sagar, “Performance analysis of a system that identifies the parallel modules through program dependence graph,” I. J. Intelligent Systems and Applications, vol. 9, pp. 37-45, September 2017. doi: 10.5815/ijisa.2017.09.05
