A Naïve Based approach of Model Pruned trees on Learner’s Response

Author: S.Anupama Kumar, Vijayalakshmi M.N.
Journal: International Journal of Modern Education and Computer Science (IJMECS) @ijmecs
Article in issue: 9 vol.4, 2012.
Free access
Appraisal and feedback have a strong positive influence on teachers and their work. Teachers report that it increases their job satisfaction and, to some degree, their job security, and it significantly increases their development as teachers. Student’s appraisal towards a teacher plays a vital role in building a very good teaching-learning environment in an educational institution. The evaluation report of the student helps the stakeholders to retain qualified teachers for the course. It will also help the teacher to understand the need of the student and the course. Therefore it becomes necessary to evaluate the teacher using appropriate tool to improve the quality of the education. Teacher evaluation can be measured based on the technical knowledge, communication skills, clarity, attitude towards the student etc. Regression trees can be considered as a tool to analyze the teacher appraisal scores. Two regression trees namely the REP tree and M5P algorithms are applied on the data set to bring out new knowledge from it. The algorithms have identified Parameter A as an important factor in teacher’s appraisal. Pruning has been taken as parameter to find the accuracy of the algorithm. The performance of the algorithm is measured using the mean absolute error and the time taken by the algorithms to derive the regression tree. The REP tree algorithm performs better than the M5P algorithm in terms of accuracy as well as the performance.
Appraisal, Parameter, Scores, REP tree, M5P tree
Short address: https://sciup.org/15014487
IDR: 15014487
Text of the scientific article A Naïve Based approach of Model Pruned trees on Learner’s Response
Published Online September 2012 in MECS
Higher education is becoming a major driver of economic competitiveness in an increasingly knowledge-driven global economy. As higher education systems grow and diversify, society is increasingly concerned about the quality of courses offered. Much attention is given to public assessments and international rankings of higher education institutions. These comparisons tend to overemphasise research, using research performance as a yardstick of institutional value. If these processes fail to address the quality of teaching, it is in part because measuring teaching quality is challenging. Institutions may implement different evaluation mechanisms to identify and promote good teachers through which they can achieve a global recognition. To get global recognition institutions should provide quality education and educators to stakeholders. Teachers play a major role in building a good institution as well as a student community. Therefore it becomes important for the education institutions to identify good teachers to provide better education. Teachers can be identified through their educational qualification in the initial stage and can be evaluated through various methodologies for further improvement. Teachers can be evaluated using their technical knowledge, teaching ability, communication skills, attitude towards students etc. HounselDa (2003) explains the key stages in a teacher evaluation cycle represented through the figure 1.
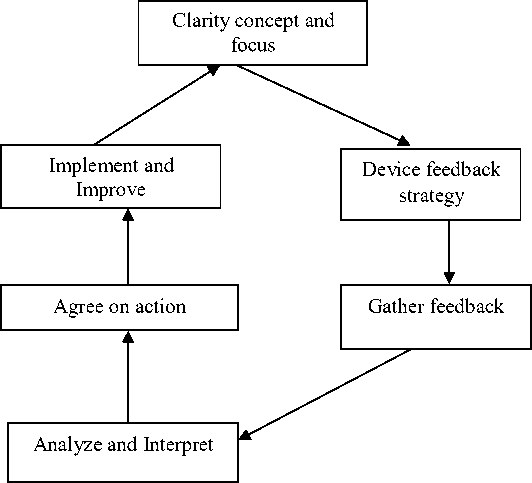
Fig 1 : The evaluation cycle (Hounsell, 2003)
The first phase is evaluate the aim and need of the process itself. The second stage is to create an appropriate tool for designing a feedback and then implemented by collecting the data. The collected feedback is analysed by the institution first and given back to teachers to make necessary action if any.
The paper is divided to three sections viz section II explaining the background investigation and related work, III explaining the various applications of data mining techniques in evaluating teachers feedback followed by section IV comprising of result and conclusion.
-
II. Background investigation
Assessment plays a key role in how teachers teach and how students learn. There are different types of assessment and not all are about results and exams. The best forms of assessment will combine data analysis with ways of getting to know pupils and understand their educational needs.. Effective assessment enables teachers to:
-
• Reflect on the quality of their own
-
• Assess and identify student’s learning needs
-
• Determine the appropriate level, depth and pace of work for students.
The appraisal tool comprises of a questionnaire which is divided into four sections. The sections consist of questions which evaluates the teacher depending upon (i) subject knowledge; (ii) teaching skills and assessment methods; (iii) behaviour towards students; and (iv) communication skills. Each section comprises of minimum three to a maximum of five questions with a total of 15 questions. All the four sections are evaluated using 4 parameters which is set up according to the need of the question. At an outset the parameter A is assessed with 10 marks, B with 8 , C with 6 and D with 4 marks. The percentage is calculated using the summation of all the parameters / (Total no of questions * total number of students evaluated) * 100. The aim of this paper is to find out the effect of each parameter in the total score of the teacher.
Fabrice Hénard [1] in his review report suggests that Quality teaching must be thought of dynamically, in light of contextual shifts in the higher education environment. Studies are becoming internationalised, and higher education is being asked to contribute to new areas (such as innovation, civic and regional development) in order to produce an appropriately skilled workforce to meet the challenges of the 21st century. Elaine Keane and et al [2] has explained the importance of student’s feedback as a source of teachers appraisal. The author in [3] has explained how the feedback will help the teacher to improve teaching and the impact of the appraisal in the employment market. Neha Sharma and et al [4] have explained how data mining techniques can be effectively used to find the impact of the faculty performance over student’s results.
-
III. Application of data mining techniques
Data mining is an integral part of Knowledge discovery in data bases which is overall process of converting raw data into useful information .Data mining, one of the steps in the process of knowledge discovery, “consists of applying data analysis and discovery (learning) algorithms that produce a particular enumeration of patterns (or models) over the data.” [5]. Knowledge discovery involves the additional steps of target data set selection, data pre-processing, and data reduction (reducing the number of variables), which occur prior to data mining. It also involves the additional steps of information interpretation and consolidation of the information extracted during the data mining process. These extracted patterns will provide useful knowledge to decision makers [6]. The process of data mining consists of series steps of transformation from data preprocessing to post processing of data mining results. The process is depicted in figure [2] given below.
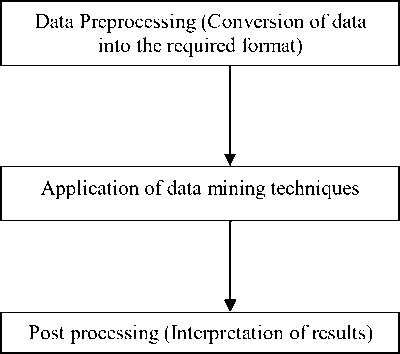
Fig 2 : Process of data mining
Education is one of the prime area in social research where large data repositories are available without analyzing the hidden knowledge available in it. By using the data mining techniques researchers are trying to find out the relationship among the various entities available in an education institution so as to bringout betterment in education. In [7] the authors have explained how regression techniques and decision trees can be used in analyzing teaching performance of Instructors using CHAID and CART trees. This paper aims to concentrate on the applications of model trees in educational data mining. Model trees are a sub-class of regression trees having linear models at the leaf node. In comparison with classical regression trees, model trees deliver better compactness and prediction accuracy. These advantages issue from the ability of model trees to leverage potential linearity at leaf nodes.This paper aims to use two model trees namely M5P and REP trees to analyze the appraisal of the teachers. It combines both the data mining techniques with Hounsell’s evaluation model. The following section explains the steps involved in appraising the teachers.
-
A. Data Collection:
Educational institutions collect feedback from students at the end of every term so as to analyze the potential of the teacher for further improvement. A questionnaire comprising of 15 questions which evaluates the teacher based on the subject knowledge, teaching skills and assessment methods, behavior towards students and communication skills is prepared and uploaded in the collage data base. Students are allowed to fill the online form with an stipulated period in the absence of the teachers. The data collected in the data base is then preprocessed according to the need of the system. Data preprocessing is one of the most important step in the data mining process. The purpose of data preprocessing is to transform the raw input data into an appropriate format for further analysis.
The steps involve extracting the data from the data base, cleaning data to remove noise and duplicate observations and selecting records and features relevant to the data mining tasks. It is one of the time consuming step in the data mining process.
-
B. Application of Data Mining Techniques
Data mining techniques can be categorized into classification, clustering and association mining. Classification is the task of assigning objects to one of the several predefined categories that encompasses many diverse applications. Some popular classification methods include decision trees, logistic regression.. REP tree and M5P trees are used in this paper to predict the factor affecting the teacher appraisal. The general procedure for the application of the trees is given in figure4.
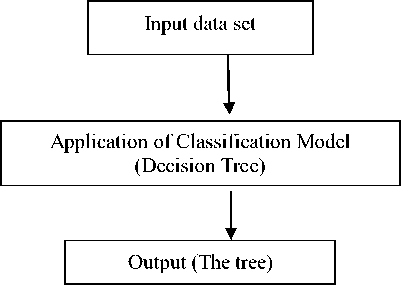
Fig 3 : General approach for a classification problem the nodes. Pruning is a technique used to reduce the size of decision trees by removing sections of the tree that provide little power to classify instances. The dual goal of pruning is reduced complexity of the final classifier as well as better predictive accuracy by the reduction of overfitting and removal of sections of a classifier that may be based on noisy or erroneous data.
-
a) REP tree
Reduced Error Pruning (REP) is a model based tree proposed by Quinlan. Starting at the leaves, each node is replaced with its most popular class. If the prediction accuracy is not affected then the change is kept. Reduced error pruning has the advantage of simplicity and speed. It uses a pruning set to evaluate the goodness of the subtrees of a model tree T. The pruning set is independent of the set of observations used to build the tree T, therefore, the training set must be partitioned into a growing set used to build the tree and a pruning set used to simplify T. The algorithm analyzes the complete tree T and, for each internal node t , it compares the mean square error (MSE) computed on the pruning set when the subtree Tt is kept, with the MSE computed on the same set when Tt is pruned and the best regression function is associated to the leaf t[8] . The attributes are fed to the REP tree without applying pruning. It has applied on with a tenfold cross validation. The following rule has been applied by the algorithm to build the table.
If a < 1135
Then
If d < 2 : 210.93 (30/124.2)[0/0]
Then d >= 2 : 354 (30/180.8)[0/0]
End if
Else
If a >= 1135
Then a < 2825 : 3164 (2/0) [0/0] Else a >= 2825 : 5310 (2/0) [0/0]
Rule 1 : REP tree – before Pruning
From the given rule it is clear that the parameter “a” and “d” has played a vital rule in building the teacher’s feedback. The parameter “b” and “c” has minimum values which can be ignored while building the tree. The diagrammatic representation of the REP tree is given below. The figure 4 is the tree produced by the algorithm. It indicates that parameter “a” and “d” are taken as leaf nodes and they end as dead nodes at first iteration only.
The output (Tree) has the following types of nodes.
-
1. A root node that has no incoming edges and zero or more outgoing edges
-
2. Internal nodes, each of which has exacting one incoming edge and one or more outgoing edges
-
3. Leaf or terminal nodes, which has one incoming edge and no outgoing edges.
One of the most important problems that arise in classification trees is to understand where to terminate
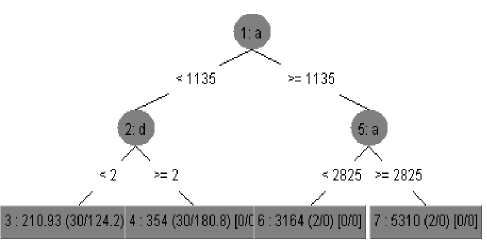
Fig 4: REP tree : Before pruning
The data set is then pruned and analysed using the REP tree without changing all other constraints. The rule obtained after pruning the data set is given below:
If a < 1135
then
If d < 2 : 210.93 (18/112.06) [12/142.46] then
If d >= 2 : 354 (21/202.12) [9/135.4]
End if
Else
If a >= 1135 : 4237 (3/1023403.56)
1/2046807.11]
End if
Rule 2 : REP tree – after Pruning
The REP tree has produced a decision tree of 5 leaves after pruning.
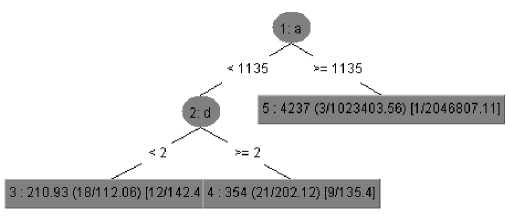
Fig 5: REP tree: After Pruning
The tree stopped growing after the first iteration for the parameter “a” and took parameter “d” for second iteration. also. The algorithm is analyzed using various measures like co-relation co-efficient, the various errors generated and the time taken for generating the tree. It is also clear from the tree that parameter “a” plays a major role than the parameter “d”.
Table 1 : Comparison of Pruned and Un Pruned tree
|
Correlation Co-efficient |
Mean Abs Error |
Root Mean Squared Error |
Relative square error |
|
|
Before Pruning |
0.8927 |
131.95 |
457.99 |
45.424 |
|
After Pruning |
0.9339 |
99.115 |
357.88 |
21.211 |
The table1 shows the various values obtained while processing the data in the algorithm. The time taken by the algorithm before and after pruning is same ie Zero seconds, the other factors differ from each other. It is evident that pruning has reduced the effect of error in the algorithm and the tree is also terminated after the generation of two leaf nodes .
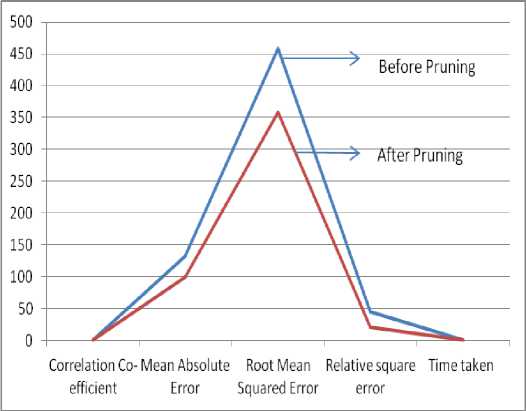
Fig 6 : Graph showing the effect of pruning
The graph in figure 6 indicates that all the comparison measures are relatively high before pruning the data and it is relatively low when the data is pruned. Therefore it is obvious that pruning the data in REP tree makes the decision tree very effective.
-
b) M5P tree:
wo + w1a1 +.......... +wkak, based on some of the input attributes a1,a2, ,ak in the instance and whose respective weights w0,w1, ,wk are calculated using standard regression. As the leaf nodes contain a linear regression model to obtain the predicted output, the tree is called a model tree.
First, a decision-tree induction algorithm is used to build a tree, but instead of maximizing the information gain at each inner node, a splitting criterion is used that minimizes the intra-subset variation in the class values down each branch.
Once the tree has been built, a linear model is constructed at each node. The linear model is a regression equation. The attributes used in the equation are those that are tested or are used in linear models in the subtrees below this node. The attributes tested above this node are not used in the equation as their effect on predicting the output has already been captured in the tests done at the above nodes. The linear model built is further simplified by eliminating attributes in it. The attributes whose removal from the linear model leads to a reduction in the error are eliminated. The error is defined as the absolute difference between the output value predicted by the model and the actual output value seen for a given instance. The splitting procedure in M5P stops if the class values of all instances that reach a node vary very slightly, or only a few instances remain.
The tree built can take a complex form. The tree is pruned so as to make it simpler without losing the basic functionality. Starting from the bottom of the tree, the error is calculated for the linear model at each node. If the error for the linear model at a node is less than the model sub-tree below then the sub-tree for this node is pruned. In the case of missing values in training instances, M5P changes the expected error reduction equation to
A error = m* * 6 ( i ) * | S |
stdev ( S ) -
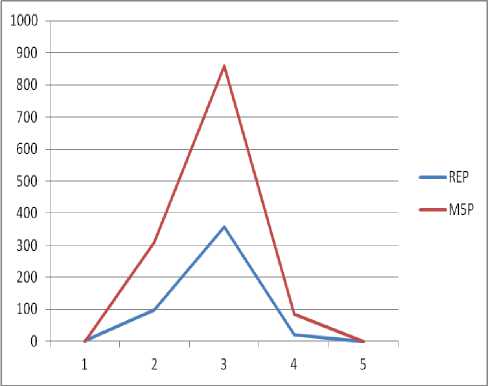
X S|s where m is the number of instances without missing values for that attribute, S is the set of instances at the node, β(i) is the factor multiplied in case of discrete attributes, j takes values L and R with SL and SR being the sets obtained from splitting at that attribute. Therefore the tree is pruned back from each leaf. When pruning an inner node is turned into a leaf with a regression plane. The author in [9] has explained the time efficiency of M5P algorithm to predict the strength of concrete mix when compared to linear regression and multilayer perception. This paper explains the efficiency of M5P in predicting the teacher’s appraisal. The algorithm is tested using the pruned and unpruned data set. Figure 8 explains the unpruned regression obtained by the M5P algorithm. Linear Regression model has been used to derive the tree where it has considered only two parameters Aand D to derive the tree. Parameter “a” has played a major role in contributing to the total while parameter “d” could not be derived after the first level. The model has derived a five level tree and at each level regression has taken place. Figure 8 : M5P tree (Both Pruned and Un pruned) Pruning plays an important role in model fitting of any data set. For the given data set both pruned and unpruned algorithms predicted the same tree and result. The other measures like the co-relation coefficient and the mean square error are also same. But the pruning algorithms takes less time (0.02 seconds) compared to the unpruned algorithm (0.05 seconds). IV. Results Model tree based algorithms are efficient in predicting the parameter leading to the appraisal of the teacher. The efficiency of the algorithms are compared using the mean squared errors. The table 2 explains the efficiency of the Pruned REP tree and M5P tree algorithms. Table 2 Corr-Coeff Mean Abs Error RMSE Relative square error Time taken (secs) REP 0.9339 99.1156 357.88 21.2115 0 M5P 0.6909 308.6869 857.5662 85.05 0.02 From the table2 it is clear that REP tree performs better than the M5P tree in terms of absolute error as well as the time taken to derive the tree. It is also clear that pruning plays an important role in deriving a tree with lesser time. The chart identifies the difference between both the classification models using the various parameters. It is clear from the chart that pruned REP tree algorithm is better in terms of accuracy and time taken to generate the tree than M5P tree. Figure 8 The algorithms are very efficient in identifying the parameters which plays a vital role and least role in analyzing the learner’s response. This identification of parameter will definitely help the teaching community to identify their strength to improve the learner. It will also help the management to identify better teachers and bring out quality education. Data mining techniques can also be used in various other domains of education to improve the teaching and learning community.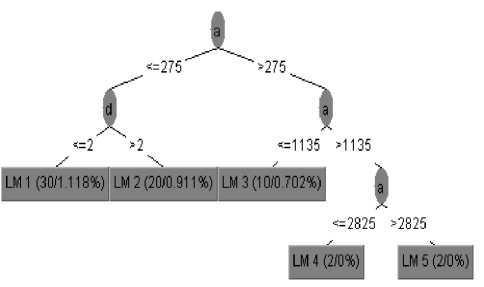
References A Naïve Based approach of Model Pruned trees on Learner’s Response
- Fabrice Hénard ,Learning our lesson: Review of quality teaching in higher educaiton, Review report , Institutional Management in Higher education.
- Elaine Keane & Iain Mac Labhrainn , Obtaining Student Feedback on Teaching & Course Quality , CELT, April 2005.
- BenJensenn, Better Teacher and Appraisal: Improving performance, GRATTAN Institute 2011.
- Neha Sharma and etal, Impact of Faculty Performance on Students Result , proceddings of International Conference on Advances in Computing and Management – 2012 pp 1-6.
- Khosla, R. & Dillon, T. (1997). Knowledge Discovery, Data Mining and Hybrid Systems. In Engineering Intelligent Hybrid Multi-Agent Systems, 143–177. Kluwer Academic Publishers.
- Andrea L. Houston, Hsinchun chen, Susan M. Hubbard, Bruce R. Schatz, Tobun D. Ng, Robin R. Sewell and Kristin M. Tolle, “Medical Data Mining on the Internet: Research on a Cancer Information System”: Artificial Intelligence Review 13: 437–466, 1999.
- Sona MARD˙IKYAN, Bertan BADUR, Analyzing Teaching Performance of Instructors Using Data Mining Techniques, Informatics in Education, 2011, Vol. 10, No. 2, 245–257.
- N. Zhong et al. , Comparing Simplification Methods for Model Trees with Regression and Splitting Nodes, (Eds.): ISMIS 2003, LNAI 2871, pp. 49–56, 2003, Springer-Verlag Berlin Heidelberg 2003.
- C.Deepa and etal, Prediction of the Compressive Strength of High Performance Concrete Mix using Tree Based Modeling, International Journal of Computer Applications (0975 – 8887) Volume 6– No.5, September 2010.
