A New Hybrid Genetic and Information Gain Algorithm for Imputing Missing Values in Cancer Genes Datasets

Author: O. M. Elzeki, M. F. Alrahmawy, Samir Elmougy
Journal: International Journal of Intelligent Systems and Applications @ijisa
Article in issue: 12 vol.11, 2019.
Free access
A DNA microarray can represent thousands of genes for studying tumor and genetic diseases in humans. Datasets of DNA microarray normally have missing values, which requires an undeniably crucial process for handling missing values. This paper presents a new algorithm, named EMII, for imputing missing values in medical datasets. EMII algorithm evolutionarily combines Information Gain (IG) and Genetic Algorithm (GA) to mutually generate imputable values. EMII algorithm is column-oriented not instance oriented than other implementation of GA which increases column correlation to the class in the same dataset. EMII algorithm is evaluated for imputing the generated missing values in four cancer gene expression standard medical datasets (Colon, Leukemia, Lung cancer-Michigan, and Prostate) via comparing the truth original complete datasets against the imputed datasets. The analysis of the experimental results reveals that the imputed values generated by EMII were almost the same as the original values besides having the same impact on the applied classifiers due to accuracy as similar as the original complete datasets. EMII has a running time of θ(n2), where n is the total number of columns.
Data Mining, Genetic Algorithm, Information Gain, Missing Values Imputation, DNA Microarray, Classification
Short address: https://sciup.org/15017114
IDR: 15017114 | DOI: 10.5815/ijisa.2019.12.03
Text of the scientific article A New Hybrid Genetic and Information Gain Algorithm for Imputing Missing Values in Cancer Genes Datasets
Published Online December 2019 in MECS
The DNA is a sophisticated chip data with thousands of attributes that represent gene expression values and DNA datasets that generate substantial biological databases. Various techniques are used to determine the expression of many genes such as microarrays expressed DNA, serial analysis of gene expression, and so on[1, 2]. Each glass slide typically describes a microarray to which DNA molecules (i.e. spots) are always affixed such that each spot is in connection with only one gene. Microarrays demoralize the theory of preferential execution with their contrasting single-stranded DNA sequences (cDNAs). A single-stranded DNA sequence tends to attract interconnected parts by which it produces the attraction of cDNA sequences[3]. Most microarray experimentations compare gene expressions with two different samples: target and control. The results formulate a microarray as a vector in which each feature is being a spot and natural information produced from microarray experiments is called microarray image hybridization. Fig 1 illustrates the general procedure to obtain gene expression information levels, which demand the analysis of image quantitation. Therefore, gene expression datasets are determined upon the quotients of the intensities. Several methods could be used to group the genes into different clusters. Biological experiments employ benchmarks for enormous volumes of microarray data, which can help biologists to gain insights into underlying biological processes. Thus, gene expression is carefully extracted and stored in databases to be retrieved and analyzed subsequently [4].
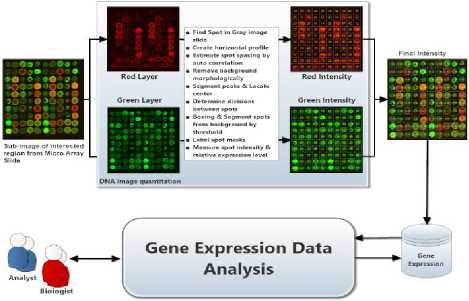
Fig.1. Context overview of gene expression extraction process
In the last few years, researchers have begun to use data estimation techniques if values are missing in the dataset to introduce the required complete datasets for data analysis purposes. There are many practical methods for managing the missing data in data analysis; e.g., deletion methods, single imputation methods, and modelbased methods. Deletion method works on eliminating all patterns where the lost values are at least one signal from the dataset. Unfortunately, the ignored instances may contain precious information and may be deleted in the process. The impact of this is particularly gained when the used dataset is small. In single imputation methods, the missing values are replaced with statistical values such as the mean value of the existing historical data. The quality of the values that are generated by the substitution process depends on how close these values are to the true (unknown) values. The model-based method develops a model, or “learner”, to cover the missing values. Thus, it is more appropriate for applications that need to reconstruct incomplete large datasets since these applications have a lower computational load[5]. In medical data, different missing values management methods are applicable to resolve different types of missing including 1) Missing Completely At Random (MCAR) that determines the administrative errors, 2) Missing At Random (MAR) represents the missing patient characteristics which suffers from missing values that often occur in subjects that may produce random missing values in older subjects from a specific region., and 3) Missing Not At Random (MNAR) defines the missingness related to the value of the predictor, or to some traits not available in the analysis. In which, the missing values are usually not in a casual situation which leads to non-response regarding a particularly critical question [6].
In turn, ascribing the missing values of a dataset is an essential preprocessing step for mining knowledge of a complete microarray dataset, and crucial genes subset selection must be performed. Thus, the use of complete datasets should be error-free in order to achieve accurate classification in disease prediction.
The primary objective of this paper is to generate imputable values for the missing values in experimental microarray datasets and to build a classification model for identifying a human as normal or disease-stricken based on the effect of assigned values. A novel evolutionary algorithm, that explores mutual information, is proposed to suggest probable values by considering the biological relationship between the gene and the class label in the microarray experimental data, which is measured by applying information gain analysis to estimate the dependency rate. In [7], missing values imputation processes are estimated based on the distance between the expression values of the genes with ignoring their biological characteristics. However, this proposed algorithm is based on the relationships between the values.
The remainder of this paper is structured as follows: Section 2 presents a literature review of recent researchers’ work in estimating missing values, especially in medical datasets using different methods. The proposed method and the related strategies for designing the algorithm for missing values imputation are described in Section 3. Section 4 specifies details about the microarray experimental datasets, implementation details, theories of performance measures and metrics, and the performance of the proposed method as well as its effect in building a classification model using the imputed values. The paper is concluded with remarks and provided recommendations for future work in Section 5.
-
II. Recent Related Work
The imputation of missing values in gene microarray datasets has significant involvement in the research regions of pattern recognition, machine learning, and statistics. All over the world, researchers are attracted to the problem of mining exciting biological information in gene microarray datasets. However, there is a key problem of missing values which is the major impact of missing values in incomplete datasets whether or not the designed model performs well regarding the accuracy, precision, and sensitivity rather than biology aspects.
Fabio et al. [8] proposed a multi-objective genetic algorithm, abbreviated as MOGAImp, for data imputation based on the NSGA-II. MOGAImp starts with an individual’s coding schemes to analyze the instances and stores all plausible values that are used later to build chromosomes. Each individual is a complete solution to produce a unique imputed dataset that is used to compute the fitness functions. MOGAImp is suitable for mixed-attribute datasets, tackles conflicting evaluation measures, and considers the information of incomplete instances and the model building. However, it has been found that during huge search space the algorithm failed to obtain optimal individuals and that the lack of a data analyst constitutes another drawback.
The problem of missing data imputation is addressed and the importance of clean (or complete) data in KDD is elaborated by Waseem et. al. [9], in which an evolutionary technique using GAs for filling in missing data on the basis of good estimation is proposed. The main objective of this method was to embed information gain in population-based search mechanisms so as to explore for optimal search space. However, the method consumes search space complexity when striving to obtain all possible solutions.
O. A. Alomari et. al. [10] proposed hybrid Genetic Algorithms (GAs) and decision-tree learning for imputing missing attribute values. Their algorithms use domain values for missing attributes as possible solutions and the set of instances with imputed attribute values is used as a pool of solutions or as chromosomes in GA. The evolutionary decision tree GATree is used to evaluate the fitness function of the chromosomes. The method pursues a global search in the problem space with classification accuracy as a fitness function without being biased towards a local optimum that gives the best classification accuracy. The method was tested against J48 and Simple CART for the validity of its proposed algorithm and was recognized to fit well only with categorical values.
GPMI is a Genetic Programming (GP) algorithm for multiple imputations that was proposed by Tran et. al [11]. GPMI uses GP as a non-parametric regression method to build mathematical functions that regress missing values of one feature on other features under the control of prediction capability and classification accuracy during the evaluation process. With this method, the imputation of missing values can be superb in a feature that has a linear relation with other features but is fairly well when the relationship is nonlinear.
Hernandez et. al. [12] have proposed hybrid GA embedding SVM for gene selection and classification of microarray data. Their method consists of a pre-selection phase and GA search phase. The hybrid method is highly specialized in crossover and mutation operators which were designed in such a way that they integrate gene ranking information provided by the SVM classifier during the fitness evaluation process.
Nguyen et. al. [13]have introduced supervised learning hidden Markov models (HMMs) for classifying cancer through gene expression profiles. The proposed model maximizes the likelihood of the gene expression of each tumor type based on a modification of the analytic hierarchy process (AHP). The proposed AHP form stable and robust gene subsets by aggregation of the sorted results of individual gene selection methods. Their proposed was a useful tool for cancer classification in a real clinical decision support system.
Baraldi et al. [5] presented a fuzzy similarity-based method for reconstructing incomplete data in real-time mode. The method was implemented while grouping the mined information in the reference trajectories into factors. They further developed an algorithm to reconstruct the missing datum as a weighted average reference segment based on assigning the weights of each reference segment of information. Support Vector Regression (SVR) was used to predict missing values using orthogonal input coding scheme to resolve the issues of multiple missing values in DNA sequences [1].
Shi et. al. [14] presented a method for estimating missing values depending on a principal curve with the nonlinear generalization of PCA in DNA microarray gene expression data. For incomplete data in medical applications, particularly in diagnosis modeling, Wojtowicz et. al. [15] introduced an approach to listing the interval diagnoses for a given level of missing data. Their approach uses aggregation and thresholding to evaluate and optimize the performance of reference diagnoses. Zhong et. al. [16] presented two ways to impute missing values: the first is the realization of individual variables while the other is by establishing a structure in the data based on Granular computing.
However, one major restriction of their work is the increase of the fraction of missing data and the deterioration in performance. In our work, we handle this problem by estimating the missing values using a genetic algorithm to optimize the performance of overall system stages even with a large amount of missing data.
-
III. Methodology
DNA analysis can be considered a classification application of data mining and machine learning field. The domain of DNA analysis poses a new complex tradeoff and embraces six challenges due to DNA unique attributes. First, many of DNA datasets have a small number of samples in a universe against hundreds of thousands of genes per every instance representing a key feature of DNA datasets. Second, DNA datasets are subject for missing values of types MAR or MNAR that can be occurred either naturally or technological in many situations. Third, the number of genes associated with a specific disease could be daunting. Fourth, in the same DNA dataset, there is a representation similarity between available instances, having less precise between the different types regarding the same disease. Fifth, the tradeoff between the original meanings and terms of relevant biological domain versus a high accuracy rate of the classification model that is a considerable factor in our problem. Final, time and power consumption for evaluating thousands of genes in DNA datasets requires a high throughput technology.
-
A. Problem formulation
Every dataset of DNA dataset is considered as information table, K, that can be denoted as K = (U, X ∪ {d}), where U represents the instances that are listed in the dataset, X represents a vector of the predictor values with {x 1 , x 2 , …, x n } (i.e., feature set). {d} is a single outcome value or the class attribute in the context of a classification model (i.e., category or label). Because of missing value is a common problem in medical and scientific research, that can be occurred either in predictor (X) or category ({d}), we focus on the missing values of the predictor (X); i.e., the missing values of one or more of {x 1 , x 2 , …, x n }. Since every gene of the predictor vector has a binary correlation with the category attribute, disease, we can heuristically impute a value in a semantic computed manner keeping track the existing correlation.
-
B. Genetic Algorithm (GA)
Evolutionary Algorithms (EA) are optimization algorithms and stochastic search techniques. EA mimics nature’s evolutionary principles in driving a search procedure to an optimal solution. In optimization algorithms, EAs use a population of search space per iteration instead of a singleton mode in classical search algorithms. GAs is considered the most evolutionary algorithms that are used extensively as search and optimization tools in a wide range of various problem domains. Their broad applicability is due to their global perspective and ease of use. GAs is also used in solving Multi-Objective Optimization Problem (MOOP) in which every MOOP has some objective functions that need to be either minimized or maximized. Every problem usually has some constraints that any feasible solution must satisfy. MOOP can be stated in its general form as:
Min or Max fm ( x )․ m =1․2․…․ M ;
Subject to gj ( x )≥0․ j =1․2․… J ;
ℎ к ( X )=0․ к = 1․2․…․ К ; (1)
(L)≤ xt ≤X(u․i=1․2․…․n․ where lower X() and upperX() bounds constitute a decision variable spaceD , or simply decision space, and X is a vector of n decision variables: X=(%1 ․ ■^2 ․…․Xn )T. The set of variable bounds restricts each decision variable X[ to take a value within X() andX() [16, 17].
Fig 2 is a simple and straightforward flowchart of GA that begins its search for a random set of solutions instead of one solution. Each random set is evaluated in the context of the underlying problem and its fitness is assigned to each solution. The termination condition is then applied to check whether it is satisfied or not. If it isn’t, the population for the treatments is revised by the GA operator, and a new population is derived. The counter is incremented for every derivation to specify that one generation of GA is accomplished. Every GA has a different representation of a solution based on the problem domain and differs in both fitness evaluation mechanism and objective weather minimization or maximization. For the representation of a solution, every problem requires a sophisticated representation for the optimal solution. The solution representation must apply to substitute fitness and can be interpreted as a solution. The interpretation of the solution must satisfy the objective function and the constraints. In most cases, the fitness value is the same as the objective function value. Genetic operators include selection, crossover, and mutation operators. The selection operator is designed to produce replicates of superior solutions into the new population while keeping the population size fixed. In effect, multiple copies of good solutions can be generated and bad solutions simultaneously are removed from the population. The second and third operators are used to create new solutions instead of good copies. In the crossover, pairs of solutions are usually selected from a mating pool at random, and different elements of these solutions are interchanged to create new solutions. However, the search aspect of GAs mainly depends on the crossover; mutation operator is needed to keep diversity in the population. Mutation procedure can generate another solution better than the original one by representing a slight difference. These three operators are simple and straightforward [17].
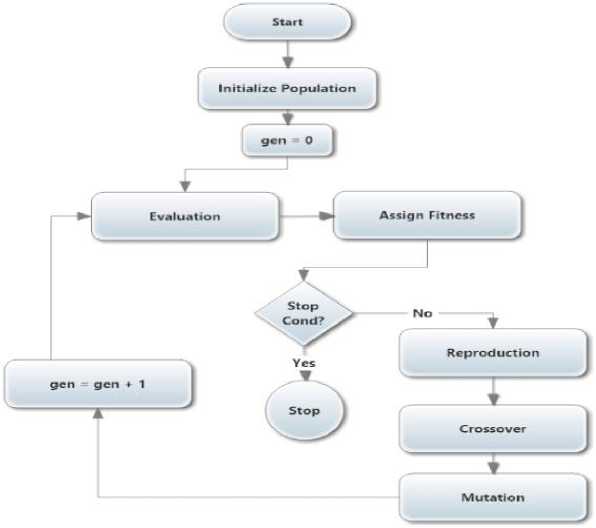
Fig.2. General Genetic Algorithm
Since GA optimizes the generating chromosomes in the population based on a common relation in heuristic approach, we have developed a GA algorithm implementation for generating the heuristic imputed value(s) in each gene or columns in a given dataset having one or more missing value
-
C. Information Gain (IG)
IG favors certain features in investigating more simple selection. Consequently, the selection criteria are dependent on the result of the study of original features at each cycle, in which the features are dependent on weight to the decision by a way of heuristic or statistical measure. IG is an estimating uncertainty conditional (H(D)); i.e. entropy factor, where higher value denotes a higher uncertainty and a lower value denotes a lower uncertainty [8].
For any given information table, K = (U, X ∪ { d }), H(D) relation is defined by Eq. (2) for a given decision, D = {d}, and discrete instances U[ ∈ U where i = 1... ‖ U ‖ or m for short.
H ( D )=-∑’i" 1 Рщ ∗ ^°9гРщ (2)
where рщ is discrete values of D .
Every single selection can be viewed as an arbitrary variable with a set of pre-assigned values; it could be considered as an information column that can be deduced by applying entropy relation according to decision column. In turn, Eq. (2) can be rewritten as the expected information required for classifying instances as shown in Eq. (3).
Info (D) = - z™ t pu . * 1оg 2pu . (3)
Because every attribute an in the given information table K has particular information that leads to overall sequencing attributes based on the certainty of the information relative to D. Each attribute has an expected information factor. The predicted score is comparable to the decision (D) and is computed after partitioning data at the attribute a grouped by the values of the decision D. Eq. (4) defines the expected information of an attribute a, which splits D into v partitions.
Infoa (0) = ^=M/WxIffoQ) (4)
Finally, the total information gain by an attribute a, using the decision D, is defined in Eq. (5).
G a. in (a) = Inf o(D) - Inf о a(D") (5)
We can conclude IG as a binary correlation measurement algorithm representing the amount of information already available in a given gene according to the disease of a DNA dataset. In turn, we have introduced the IG implementation in term of a fitness function for GA. The proposed implementation works on maintaining the existing relationship between the gene and disease.
-
D. Evolutionary Semantic Framework for Imputation Missing Values
The proposed framework works on ascribing missing values which are denoted by (?) in the given information table К = ( U, X U {d}) . In turn, every column has missing value(s) is processed as the input to Evolutionary Mutual Information Imputation (EMII) algorithm after the given table has been converted into a list of columns; see Fig 3. In the proposed framework, every missing value in any column of the column list is imputed during the processing of the context column using the proposed, EMII, algorithm. Our framework focuses on creating complete datasets via apply EMII multiple times (i.e., multiple imputations) although a single imputation is more straightforward it sometimes is insufficient. Every missing value, (?), is imputed and replaced by (v`). When all columns in the list of columns are imputed, the information table is reconstructed again, and the imputed dataset is subsequently used in the classification process using classification algorithms such as Naïve Bayes, and J48.
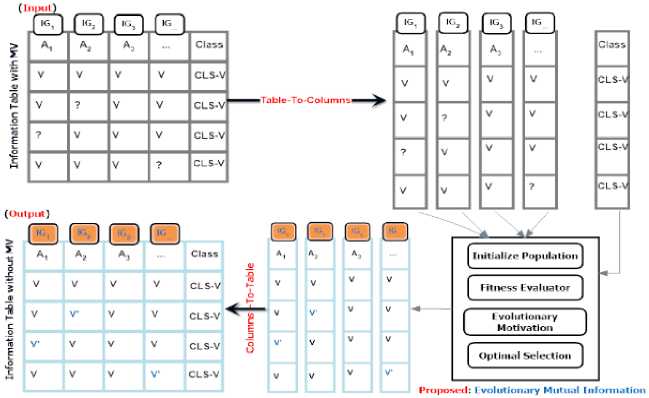
Fig.3. The proposed framework to impute the missing values using the EMII algorithm during the imputation phase
Fig 4. represents the three main steps used for multiple imputations by EMII. The first step includes the imputation process of the missing dataset more than once (i.e., n >1) to produce n distinct imputed datasets. The subsequent step is based on analyzing the different generated imputed datasets using standard performance measures in order to generate n analysis reports. Finally, the available n reports are compared for obtaining the best suitable imputation result. Multiple imputations are helpful in resolving the limitation of a number of instances since it allows the EMII to try different suggestion to reach almost exact value(s) of the missing values.
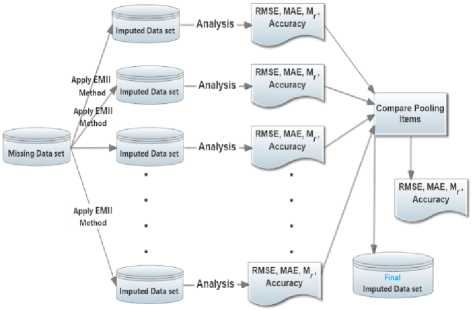
Fig.4. The main steps of multiple imputations using EMII algorithm
Because of every dataset is extracted under certain circumstances and standards for acquiring details of all tuples from the specified sensation nodes in the dataset, there are two logical facts can be taken into consideration during imputation process of a given dataset. First, the whole column (feature) has a dependency relation to the target class, during the collection of information. Second, if there is a missing value(s) in the dataset that could be randomly occurred during the acquisition process, it almost has a value, V E [m in, m ax], where min and max are minimum and maximum values in the current column (feature) of the given dataset. In turn, we can state clearly, in microarray dataset(s), every gene has homogenous value with a slight change over different subjects and the gene type itself has correlation value with the studying disease .
Hence, EMII is introduced to study the relationship between the gene type and the value of the gene at the same time to determine the more reasonable value. EMII suggests a value for every missing value individually in the same gene in the same moment. The process of EMII keeps track of the biology meaning of the suggested values and their interpretation. We have designed EMII for optimizing the suggested value based on the gene value using GA by control initialization process to be controlled by the min and max values in the current gene. Besides, EMII manages the gene type using a fitness function powered by entropy which tracks the relation between the gene and the disease. So, GA’s population is controlled for saving the missing values that can be generated due to a model considering genes’ type and disease labels. Hence, the outcome of GA is a population which precedes the adjustments of the solutions improvement in each iteration. GA has the ability to find multiple optimal solutions in one single simulation run makes GA unique in solving multi-objective problems. So, GA can be used to generate multiple solutions at the final population. In turn, EMII algorithm is based on a hybrid evolutionary and mutual information for imputation of missing values. It is based on GA and IG algorithms to generate optimal estimation values for the missing values. Also, it differs from the most recent implementation of GAs imputing missing data in three ways: 1) the chromosome definition is related to the gene or attribute itself and not to the instance in the dataset, 2) the fitness function optimizes the correlation dependency between the gene type and regularity for the gene’s values of the instances in the gene and 3) the homogeneity of the chromosome which holds the same type and structure of data within a predefined range regrading to the studied gene.
Fig 5 represents a gene microarray dataset which is converted into a list of columns (see Fig 6) for illustrating EMII steps. We have converted the given information table into a list of columns in order to:
-
a) Increase the precision of the generated values through isolation of random number generator engine,
Execute the columns simultaneously since they are independent even, they use the class column that is already read-only shared between them.

|
u |
A1 |
A, |
A, |
A |
CLASS |
|
X1 |
-66 |
-0.113 |
Y |
||
|
X2 |
-28 |
0419 |
7 |
0 12 |
N |
|
X3 |
-6 |
0 3/2 |
0 389 |
0 143 |
Y |
|
X4 |
7 |
0 594 |
0 0/8 |
0 019 |
Y |
|
X5 |
12 |
? |
06 |
-0 007 |
Y |
|
X6 |
7 |
0 142 |
0 356 |
0 1 |
N |
|
X7 |
31 |
0.719 |
0.722 |
? |
N |
|
X8 |
21 |
0.2 |
0.778 |
0.918 |
Y |
|
X9 |
12 |
0 |
? |
-0 128 |
Y |
|
X |
|||||
|
Xn |
7 |
0 197 |
? |
0 090 |
N |
Fig.5. A sample gene expression dataset
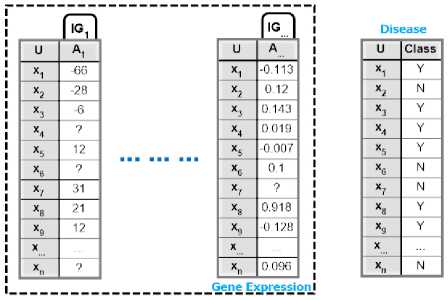
Fig.6. Gene expression dataset, from Fig.5., in columns and class structure
Each column in Fig 6 is passed through a complete EMII call. In turn, for a given dataset consisting of M genes (columns) and a disease (class label), there are M calls for imputation procedure, EMII, divided as one call per gene. Every call initializes a complete GA problem which consumes N iterations for producing N imputation. The representation of the chromosome is designed to impute any missing values, if existent, in the column that is being processed. If the chromosome doesn’t contain missing values in the original input state, or in the column, then the procedure exists for optimizing the runtime complexity. Otherwise, EMII goes through to replace the missing values until the optimal suggestion is achieved. During the substitution procedure, genetic operators are applied which are illustrated in Fig 7, where BLUE represents input chromosomes, RED shows the effect of reproduction, ORANGE represents results of cross over and GREEN describes effects of mutation operator.
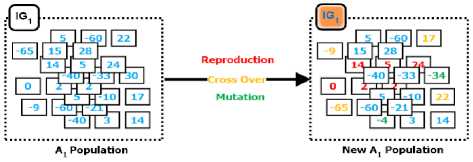
Fig.7. Evolutionary operators (reproduction, crossover, and mutation) for the first column in the first iteration.
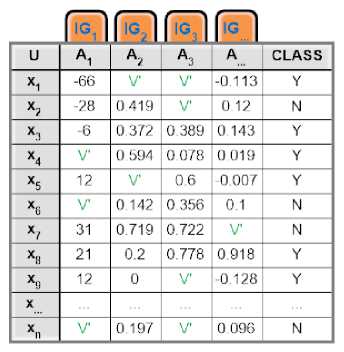
Fig.8. A sample imputed dataset, from an incomplete dataset in Fig.5.
The N imputed genes were evaluated using the standard performance measures for selecting the optimal imputed gene in the final result.
The selection operator of GA makes duplicates of the right genes into the new population while keeping the size of the population fixed, i.e. reproduction. Next, in crossover operator, every two treatments are selected from the breeding pool at random while some elements of the treatments are swapped between the treatments to create two new treatments seeking more accurate values for the genes’ values. However, the mutation procedure generates better genes’ values than the handled one, and thus represents a slight difference by randomly changing the value of the missing values. Slight difference in random number generation is intended to manage the biology meaning and interpretation of genes’ value and type. The process is repeated until either the maximum number of iterations is achieved or optimal fitness is achieved using the designed fitness function for all genes. The formulated fitness function is defined in terms of the relation of current gene type and disease using entropy, IG, algorithm. It keeps or maximizes the relationship between the current gene and the class label.
After EMII have been finished imputing all missing values over different genes in the given dataset, the imputed columns were merged again into a single information table; see Fig 8, where every missed value was denoted by (?) is already replaced by a suggested value (V') and every column that was including a missing value has a new weight generated by IG algorithm after substitution by a new value(s) (V'). We can formulate the different steps of the EMII algorithm into a single flowchart representing the straightforward execution of EMII, see Fig 9. Fig 10 represents its related algorithm.
This algorithm consists of two P rocedures: EMII-P and EVALUATE-P . EMII-P accepts two inputs: a column list which is being processed and a class list that represents the disease type. This procedure returns the best solution for the input column while the returned solution holds the imputed values for the missing value. EVALUATE-P is a fitness function estimator that calculates the fitness function for the solution in the current population using standard implementation details of IG. This procedure accepts the population of the current iteration and class label that represents the disease type. It returns a list of scores, where each score represents the fitness of the different solutions in the current population.
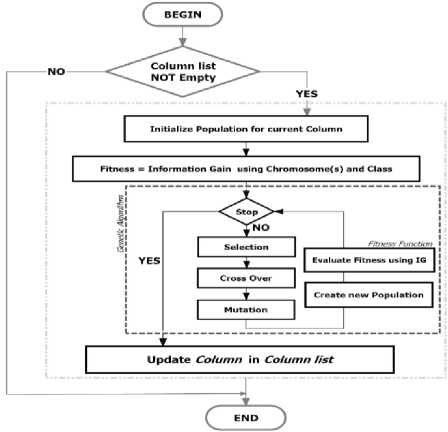
Fig.9. Flowchart of Evolutionary Mutual Information Imputation algorithm.
The EMII algorithm utilizes the work of IG as a fitness evaluator which causes a higher probability of reaching pure category in classification. But pure random value generation can lead to higher IG rate without considering biology nature of gene value which represents a contradiction. In turn, the EMII algorithm imputes the values under controlled of an interval [m in, max ], where min and max are minimum and maximum values in the current gene of the dataset. The population of GA is initialized randomly based on the control interval per each chromosome. Every chromosome has a length equal to the number of instances in the dataset.
Only the missing values in each chromosome is imputed randomly to make the chromosome ready to be evolved and evaluated using the fitness function. In turn, the GA seeks an optimal solution that satisfies the hypothesis where the changes keep imputed values within designated limits and have a biology relation between both gene and human disease types. Because the EMII algorithm works on NP-Complete partition problem, it consumes asymptotically average running time up to 9 (n2), where n is the total number of columns because generally, GA finds at least 4/3 of the approximated solution in the expected running time [18]. The proposed algorithm is considered moderate complexity running time verse the original GA which costs 0 (nmpg) rather information gain measure that consumes O(nlgn) and the IG/SGA which is proposed in 2017 by [24], that costs O(nmpg(nlgn + nmpg)) ; where n denotes the number of instances, m denotes to the dimension of the data, p characterizes the population size and g denotes the total of generations. In turn, EMII is better than IG/SGA and standard GA in computationally expensive.
Algorithm 1 Evolutionary Mutual Information Imputation
Input:
DataColumn ; Input column > which have missing values
Classlxibcl ; < 'lass attribute > which is user! for information gain evaluation
Output:
Hext — chromosome ; Imputeri column t> with no missing values
-
1: prucedure mM.ll(,UataC*o(umn,Cia.4xLabet) 2: AT <— KM) ;default population size
-
3: min <— Afinimum(DataC'olumii)
-
4: mux <— M
-
5: P°P *— generate N valid chruiuosunie Г> using random values in [min,max)
-
6: eualuute^pop. Glass Labtl)
-
7: while xlupc'tmditiuii ^ true do
-
8: lM^lJ' *— evo/ve(pup/ri) C> use selection. C7"uxx over uud niutute operaton»
-
9: evaluate ^pop*, Glass Label) О .fitness JuTictioii |>owered by IG
-
IO: end while
-
11: Return Best — chromoxomt.

Input:
Population : represents population of current iteration
ClassLabel : ('lass attribute
Output:
fitness List : a list of fitness score [IG] t> one per chromosome in population
-
1: procedure KVALU А'ГК.(, Population.Glas я Label)
-
2: JitnessList ч— empty
-
3: for each chromosome c in Popoulation do
-
4: IGacorc <— Jitncss^c, ClassLabel)
-
5: fit ncssList.add^IGscore)
в: end for
-
7: Return /itnessList
-
8: end procedure
Fig.10. The pseudocode of the EMII algorithm.
-
IV. Experimental Analysis
In this section, two experiments are designed to evaluate the performance of the proposed algorithm. The first experiment is on imputation quality and the second is on the impact of imputation on classification. Imputation quality is performed on three gene expression datasets (Colon, Leukemia, and Prostate), called original datasets, and impact of imputation on classification is performed using Naïve Bayes and J48 classifiers and the same three datasets. Imputation quality uses an incomplete version of the three datasets to generate three complete versions of datasets, called imputed datasets. Impact of imputation on classification uses three imputed datasets to produces three classification models per classifier algorithm. The imputation quality measures the difference of the dataset’s characteristics between the original dataset and the imputed dataset while the impact of imputation on classification analyses the difference in the classification model’s characteristics which have been generated using the original dataset and imputed dataset. The implementation environment is HP Z800 workstation with two Intel Xeon 2.4 GHz, 64 GB memory. The workstation runs Windows 10 x64 bit and pre-configured with JAVA version 8 x64 bit, WEKA library and JENETICS library which are open source implementation library that is used to fully supporting in developing the proposed EMII algorithm.
-
A. Datasets
In our experiments, we have used three highdimensional biomedical datasets (Colon, Leukemia, and Prostate) from Kent Ridge Biomedical repository, The datasets include gene expression data, protein profiling data, and genomic sequence data. Every dataset is considered as information table К = (U . C U {d}), where {d} represents the class column and C represents the list of gene features in the dataset. Every dataset has a set of tuples denoted by U.
Table 1. Gene Expression Datasets for Three Human Cancer Diseases
|
Dataset |
#Instance |
#Attributes |
#Nominal |
#Numeric |
#Class |
Label of Class |
Frequency |
Imbalance |
|
Colon Cancer[19] |
62 |
2001 |
1 |
2000 |
2 |
Normal: Positive |
22 |
1.82 |
|
Cancer: Negative |
40 |
|||||||
|
Leukemia [20] |
72 |
7130 |
1 |
7129 |
2 |
AML |
25 |
1.88 |
|
ALL |
47 |
|||||||
|
Prostate Cancer[21] |
136 |
12601 |
1 |
12600 |
2 |
Normal |
77 |
1.3 |
|
Tumor |
59 |
Table 1 compares and summarizes the used three datasets, where the cardinality of и is the total number of samples and с is the total number of attributes minus one; i.e., class label. It is noticeable, from table 1, each category has two class labels and they are not fair and balanced in terms of frequency. Also, the associated genes per tuple can be at least 2000 and at most 12600 with an irregular, a small number of samples. Table 2 highlights the challenges in the estimation of missing values which are:
-
a) a number of genes verse number of samples,
-
b) rare of samples availability,
-
c) imbalance of tuples in the dataset.
-
B. Parameter Settings
During the experimental evaluation, the population size is defined to include 100 chromosomes. Different genetic operators are applied in the experiment where the crossover is set to 0.8, and a single mutation has a probability rate equal to 0.1. These two operators are performed after the execution of the selection operator with a probability rate of 0.1. So, there is a group of 10 chromosomes being selected and transferred to the new population.
In the experiments, the missing values occur as a result of applying a filter which creates missing values randomly. The filter generates random values with given 5% as a ratio in these experiments. Hence, the total number of missing values in a dataset equals to 0.05 * a number of samples * a number of genes. We intend to use the original dataset(s) as the ground truth state of the problem besides we can’t determine the truth of the imputed value for a dataset already includes missing value. Every dataset is randomly splatted into 75% training and 25% testing. Table 2 summarizes overall parameters which were used in the experiments.
Table 2. Parameter settings used in the experiments
|
Parameter |
Value |
|
Population Size |
100 |
|
Initialization |
Random float values but must be in [ min , max ] |
|
Generations |
10 |
|
Reproduction rate |
10 % |
|
Crossover probability |
10 % |
|
Mutation probability |
80 % |
|
Selection type |
Tournament (size=7) |
|
Missing value filter ratio |
5 % |
|
Method of missing value occurrence |
missing completely at random (MCAR) |
|
Classification algorithms |
NB and J48 |
|
Training ratio |
75 % |
|
Testing ratio |
25 % |
|
Split type |
Random |
B. Evaluation Metrics
Two categories of metrics are used to evaluate the EMII algorithm. The first category is used as performance metrics to measure the quality of the imputed data values instead of the missing values. It includes three metrics: Root Mean Square Error (RMSE), Mean Absolute Error (MAE), and Minimum Ratio (тг). RMSE estimates the difference between the predicted value and the correspondence observed data. It is scaledependent to measure the forecasting error for a particular dataset as given in Eq. (6)[22].
RMSE = √∑ "=1( Vt - xt )5⁄и (6)
where ytand Xi are the predicted and the observed values respectively, and п is the total number of the estimated values.
RMSE has a disproportionate outcome regarding the effect of each error. Thus, large errors have a huge effect on RMSE. MAE is the One-to-One estimator used to measure the average horizontal differences between two variables. Assume (Y, X) is an ordered pair where Y and X represent the predicted and the observed values respectively [22]. MAE is the quantity disagreement value that is given by Eq. (7) where Vi ․ Xiand n are the predicted value, the observed value and the total number of values.
MAE = 1⁄ n ∑ ^i | yi - Xi | (7)
mr is one of the most common dissimilarity measures that are used to measure the dissimilarity between two variables: the estimated value(s) A versus the groundtruth value(s) B. As mr approaches zero, the predicted values almost match the original values. From Eq. (8), mr is computed, where di ․ bt ․ and n are the predicted value, the observed value, and the total number of values[23].
mr = 1⁄ n ∑ V=i min( at ⁄ bi , bi ⁄ at ) (8)
Because of DNA gene expression is a binary class and is classified either normal or abnormal, i.e. cancer infected, the second category of evaluation measurement estimates the impact of the imputed value(s) on the applied classification techniques. Table 3 shows the atoms factors of the used performance metrics: True Positive (TP), False Positive (FP), False Negative (FN), True Negative (TN), Positive (P), and Negative (N) instances[24].
Table 3. Classification Evaluation Metrics
|
Normal |
Cancer |
Total |
|
|
Normal |
TP |
FN |
P |
|
Cancer |
FP |
TN |
N |
|
Total |
^ |
^ |
P + N |
TP and TN are the numbers of positive instances and negative diagnosed correctly respectively. However, FP is Type I error and is the number of negative instances detected as positive and FN is Type II error and is the number of positive instances detected as negative. Precision, Recall, F-measure, and accuracy are computed using TP, TN, FP, and FN as given in Equations (9), (10), (11) and (12) respectively[25]. `
„ . . TP
=
TP+FP
=
TP+FN
1 measure
2 ∗ Percision ∗ Recall Percision+Recall
Accuracy = (12)
Table 4. Average of the imputed value(s) over 10 tries
|
Dataset |
Measure |
Value |
|
Colon-Cancer |
RMSE |
0.3911 |
|
MAE |
0.0722 |
|
|
mT |
0.0958 |
|
|
Leukemia |
RMSE |
0.4568 |
|
MAE |
0.0817 |
|
|
mr |
0.455 |
|
|
Prostate-Cancer |
RMSE |
215.35 |
|
MAE |
14.53 |
|
|
mr |
0.6329 |
-
C. Experiments Analysis
-
1) Imputation Quality
Fig 11 illustrates the process flow for estimating the quality of the imputed datasets, in which every complete dataset has been filtered by the missing values to be imputed using the EMII algorithm and generates an imputed dataset that is a new complete dataset. Finally, both of the original and imputed complete datasets are estimated using standard measures including RMSE, MAE, and mT .
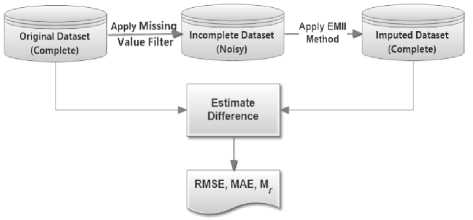
Fig.11. Measuring the quality of the imputed dataset
Three datasets are used to evaluate the EMII algorithm in imputing missing values. The imputation process is repeated ten times, and for each repetition, the values of RMSE, MAE and mT are computed. Since the estimated values have different qualities and ranges due to different datasets, the standard deviation, average metrics, and normalized metrics are computed to indicate the quality of the imputed value. Table 4 describes the different values of the averages have been recorded in ten tries. In which, the overall RMSE rate is 0.3911 for the colon dataset, 0.4568 for the leukemia dataset, and 215.35 for the prostate dataset. We notice for MAE is 0.0722, 0. 0817, and 14.53 for colon, leukemia and prostate datasets respectively. We applied the minimum ratio, mT , for determining the dissimilarity of the original values and the imputed values which have been estimated by EMII. Average of ten tries generate imputed values similar by 90.42%, 54.5%, and 36.71% for the colon, leukemia and prostate dataset respectively. So, EMII generates values at least similar by 36.71% up to 90.42%. (i.e. EMII is able to reasonably estimate exactly at least 36.7% values of the missing values in a given dataset).
Since the used datasets have different ranges of values, the standard RMSE and MAE must be normalized for increasing the credibility of the empirical analysis of EMII algorithm.
Table 5. Comparative evaluation of NRMSE and NMAE
|
Measure |
NRMSE |
NMAE |
|
|
function of ten tries |
Dataset |
||
|
Min |
colon-cancer |
0.039663 |
0.007304827 |
|
leukemia |
0.027254 |
0.004868260 |
|
|
prostate |
0.004457 |
0.000302733 |
|
|
Max |
colon-cancer |
0.040453 |
0.007471276 |
|
leukemia |
0.027588 |
0.004938180 |
|
|
prostate |
0.004658 |
0.000309803 |
|
|
Ave |
colon-cancer |
0.040145 |
0.007405721 |
|
leukemia |
0.027399 |
0.004900201 |
|
|
prostate |
0.004542 |
0.000306424 |
|
|
Std. Deviation |
colon-cancer |
0.000252 |
0.000052000 |
|
leukemia |
0.000096 |
0.000019000 |
|
|
prostate |
0.000073 |
0.000002200 |
|
Table 5 describes the overall comparison of the Normalized RMSE (NRMSE) and the Normalized MAE (NMAE) using the colon, leukemia and prostate datasets respectively. Besides, Table 5 compares the imputation quality of minimum, maximum, average, and standard deviation for every dataset over the ten tries. The normalized relation uses the exact result report of the mentioned ten experiments. In Table 5, EMII algorithm finds optimal values for the missing values in leukemia with NRMSE up to 2.7% and NMAE less than 0.5%. In the same treatment, EMII algorithm succeeds in imputing missing values for the prostate dataset with NRMSE and NMAE less than 0.5% and 0.03% respectively. Hence, EMII algorithm has overall NRMSE up to 4.04%, 2.75%, and 0.46% and NMAE up to 0.74%, 0.49%, and 0.03% to impute the missing values for the colon, leukemia and prostate datasets respectively.
Table 6. Evaluation of the best-imputed value(s)
|
Dataset |
RMSE |
MAE |
mr |
|
colon-cancer |
0.03966 |
0.0073 |
0.647907 |
|
Leukemia |
0.02725 |
0.0049 |
0.497174 |
|
Prostate |
0.00446 |
0.0003 |
0.665282 |
Table 6 describes the different rates of RMSE, MAE and тг for three datasets that were derived from previous experiments. Table 6 shows that EMII algorithm can reliably estimate the missing values for leukemia dataset; the imputed values are 49.7% dissimilarity in groundtruth value and differ from the observed values in terms of NRSME (only 2.7%) and NMAE values (only < 0.5%).
-
2) Impact of imputation on the classification
Fig 12 describes the overall process for the proposed framework for handling the missing values using EMII. From the figure, the original dataset is splatted into train and test batches respectively. Then the process starts for multiple imputations and having the final release of the imputed dataset which represents the new train batch. This batch is used to build a classification model which is tested using the original test batch for granting the validation of the evaluation process. Then, the classification model is evaluated using standard measures and is checked for the model quality for a given dataset.
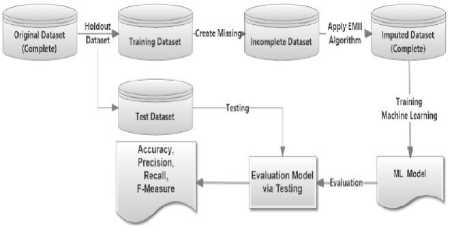
Fig.12. Evaluating final imputed dataset after multiple imputation processes by EMII algorithm
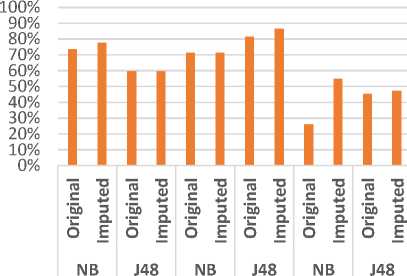
In Table 7, a comparison of two classification algorithms and three datasets in the original state and imputed state are described. This comparison includes three classification performance measures; precision, recall, and f-measure. EMII algorithm has imputed the colon and leukemia datasets in a significant accurate level. The imputed datasets achieved optimal results for precision, recall, and f-measure. The colon datasets have a matched case using J48 classification algorithm while the leukemia results are optimal with NB classifier. For prostate datasets, the J48 classifier has the nearest estimation with respect to precision, recall, and f-measure from the ground truth state. The noise for the J48 classifier is 2.00%, 2.17%, and 4.30% in precision, recall, and f-measure respectively.
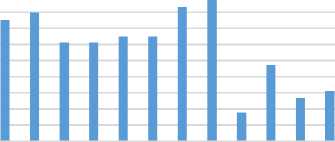
Fig 13 represents a comparison between the classifiers J48 and NB in terms of precision using the three datasets. In which, we have an exact precision level for J48 classifier using Colon dataset and for NB classifier using Leukemia dataset. In the same trend, Fig 14 evaluates the two classifiers in terms of recall metric. The classifiers match the same level of recall using Colon and Leukemia for J48 and NB respectively. Fig 15 represents a comparative study of F-Measure for the classification algorithms using the original datasets versus the imputed dataset(s). It shows that the results of the classifiers J48 and NB match using Colon and Leukemia respectively.
colon-cancer leukemia prostate
Fig.13. Comparative Evaluation of Precision using three datasets.
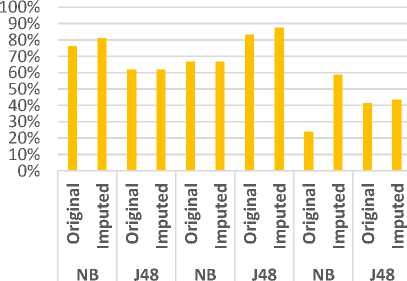
colon-cancer leukemia prostate
Fig.14. Comparative Evaluation of Recall using three datasets.
100%
90%
80%
70%
60%
50%
40%
30%
20%
10% 0%

NB J48 NB J48 NB J48
colon-cancer leukemia prostate
Fig.15. Comparative Evaluation of F-Measure using three datasets.
-
3) Comprehensive Analysis
100.00%
90.00%
80.00%
70.00%
60.00%
50.00%
40.00%
30.00%
20.00%
10.00%
0.00%
We have surveyed recent literature that uses the three datasets (Colon, Leukemia, and Prostate) in their experiments and evaluation. We can conclude almost of researchers are working on feature selection, reduction and classification without handling missing values; if exists so that in this section we are focusing on the impact of using the datasets; with missing values, after had been imputed by EMII algorithm. The intention of the experiments is to reach the lowest rate of difference between performance metrics using the original datasets verse the imputed datasets. The comparison between the most recent approaches was performed regarding classifiers sensitivity, specificity, and accuracy that are stated in [26]. In order to evaluate the EMII algorithm verse recent literature, we have implemented a recent approach called IG/SGA approach that has been introduced in [24]. Since the hybrid Information Gain and Standard Genetic Algorithm (IG/SGA) approach has a higher performance against other recent literature, we compared the impact of EMII in a preprocessing stage on the same three datasets using IG/SGA approach. We have recorded the overall experiment results in Table 8. In which, the symbol, “—”, represents that the actual values are not available in the cited work due to the original author. The imputed values by EMII algorithm achieve accuracy rates that differ by 1%, 2.2%, and 4.8% for the use of leukemia, prostate, and colon datasets respectively from the use of original datasets. In turn, EMII algorithm imputes the missing values and generates a dataset that produces a model with accuracy having a noise up to ±5% from the original dataset. Fig 16 demonstrates the classification accuracy using the imputed datasets and IG/SGA approach versus other approaches.
H. Salem et. al. [24] classified human cancer diseases based on their prediction of gene expression profiles, whose dimensionality was then optimized with GA. The study focuses on feature subset selection using a genetic algorithm and increases classification rates of genetic programming. The authors exploited the structural information for evolutionary selecting a set of genes using GA and classified this set based on genetic programming classifier. We are totally different from their framework since they built a feature reduction hybrid method while we introduce EMII which is missing value imputation algorithm. EMII algorithm is used in the pre-processing stage of feature dimensional reduction.
Table 9 describes the comparison between the features that were chosen from both of the original and imputed datasets. The features were selected based on their IG values that were higher than the predefined threshold. Various thresholds are used to select a subset of features to obtain the genes that are most relevant to the disease in the three datasets. For threshold 0.0, the hybrid IG/SGA reduces the features of the imputed datasets, namely Colon, Leukemia, and Prostate, to 357, 528, and 1486 respectively. The reduced values of the imputed datasets differ by 0.04, 0.03, and 0.02 from the reduced datasets using the original datasets with respect to accuracy.
Different threshold values have been used to evaluate imputable datasets for subset selection of genes. For the colon dataset, the threshold is set to 0.1, which generates 85.48%, and 90.3% for original dataset against imputed dataset by EMII using IG/SGA approach. With 0.8, and 0.2 as thresholds for leukemia, 97.06%, and 96% are measured for the original and the imputed datasets respectively. EMII algorithm can impute the datasets which cause accuracy rates with noise up to ±1% compared with the original leukemia dataset. Also, with 0.4 as the threshold for the prostate dataset, the accuracy level with noise is ±9%.
Comparitive Analysis
D.Singhet. H.Salem
T. Nguyen et. al. [13]
The al. [23] et. al. [26] Proposed
■ Co bn ■Leukemia ■Prostate
Fig.16. Comparative evaluation of accuracy rates using the imputed dataset(s) by EMII versus the original dataset(s) in recent researches.
-
V. Conclusion
The main aim of this paper is to propose an EMII algorithm as a hybrid imputation algorithm. We have applied the new algorithm in estimating missing values of DNA microarray expression datasets before classification because biologists are often interested in identifying the genes involved in biological human tests or checkups for a disease. The new imputation algorithm leads to enhance both knowledge mining and model interpretation in terms of RMSE, MAE, and MR. We had validated the proposed algorithm using three DNA microarray datasets. There are two experiments which were designed to evaluate the performance of the EMII algorithm. The first experiment is on imputation quality and the second is on the impact of imputation on classification. From the results of our study, we deduce that the EMII algorithm is highly significant and can impute missing values that are at least 36.7% exactly to the accurate values, in some cases reaches 90.42% and average overall at least 60% over sixty tries have been done. The analysis of the final results showed that EMII algorithm can generate imputed datasets that can be used for classifying human cancer diseases with accuracy as high as the accuracy obtained when using original datasets. EMII algorithm reaches classification accuracy with noise up to ±9%. Hence EMII can be efficiently applied for imputing missing values in medical datasets. Also, it has a running time of θ(n2), where n is the total number of columns when the algorithm achieves at least 4/3 of the approximated solutions in the expected running time.
Even the EMII algorithm has a significantly improved running time, it works sequentially and this limits its efficiency, particularly when it is used with modern parallel architectures. In the future, we plan to build a parallelized version of the algorithm. Additionally, we will extend the imputation process to consider the problem of having missing values in multi-class and multi-label datasets. Also, we plan to build a generic framework based on the proposed algorithm to handle missing values in any dataset.
Table 7. Comparative evaluation using the original dataset(s) versus the imputed dataset(s) by EMII
|
Dataset |
Algorithm |
State |
Precision |
Recall |
F-Measure |
|
colon-cancer |
NB |
Original |
73.611% |
76.190% |
75.132% |
|
Imputed |
77.778% |
80.952% |
79.592% |
||
|
J48 |
Original |
59.722% |
61.905% |
60.989% |
|
|
Imputed |
59.722% |
61.905% |
60.989% |
||
|
Leukemia |
NB |
Original |
71.429% |
66.667% |
64.762% |
|
Imputed |
71.429% |
66.667% |
64.762% |
||
|
J48 |
Original |
81.429% |
83.333% |
82.963% |
|
|
Imputed |
86.429% |
87.500% |
87.387% |
||
|
Prostate |
NB |
Original |
26.190% |
23.913% |
17.620% |
|
Imputed |
54.762% |
58.696% |
47.322% |
||
|
J48 |
Original |
45.238% |
41.304% |
26.689% |
|
|
Imputed |
47.238% |
43.478% |
30.988% |
Table 8. The impact of classification accuracy for the dataset(s) using the IG/SGA approach
|
Author |
Imputation Method |
Method |
Colon |
Leukemia |
Prostate |
|
|
Feature Selection |
Classifier |
|||||
|
T. Nguyen et. al. [13] |
None |
Analytic Hierarchy Process (AHP) |
Hidden Markov Models (HMMs) |
81.47% |
96.48% |
95.60% |
|
D. Singh et. al. [12] |
None |
Genetic Algorithm (GA) |
Support Vector Machine (SVM) |
84.60% |
91.50% |
— |
|
H. Salem et. al. [24] |
None |
Information Gain (IG) |
Standard Genetic Algorithm (SGA) |
85.48% |
97.06% |
100% |
|
The Proposed |
EMII |
IG |
SGA |
90.30% |
96% |
97.80% |
Table 9. The accuracy rate of the classification of the imputed dataset(s) using different thresholds values for IG
|
Dataset |
Authors |
#Attributes |
Threshold Value = 0.0 |
Different Threshold Value(s) |
||||
|
#Attributes IG |
#Attributes IG-GA |
Accuracy |
Threshold Value |
#Attributes IG-GA |
Accuracy |
|||
|
Colon |
[24] |
2000 |
135 |
60 |
85.48% |
0.1 |
60 |
85.48% |
|
EMII |
296 |
138 |
91.90% |
87 |
90.30% |
|||
|
leukemia |
[24] |
7129 |
585 |
316 |
91.17% |
0.8 |
3 |
97.06% |
|
EMII |
1042 |
524 |
92.60% |
0.2 |
137 |
96% |
||
|
Prostate |
[24] |
12600 |
2457 |
1235 |
100% |
0.4 |
26 |
100% |
|
EMII |
2980 |
1486 |
97.30% |
16 |
91.1 |
|||
References A New Hybrid Genetic and Information Gain Algorithm for Imputing Missing Values in Cancer Genes Datasets
- J. Li Y. Wang, Y. Cao, “Weighted doubly regularized support vector machine and its application to microarray classification with noise,” Neurocomputing, vol. 173, no. 5, pp. 595–605, 2016.
- X. Liu, S. Wang, H. Zhang, H. Zhang, Z. Yang, and Y. Liang, “Novel regularization method for biomarker selection and cancer classification,” IEEE/ACM Transactions on Computational Biology and Bioinformatics, pp. 1–1, 2019.
- H.-H. Huang X. Y. Liu and Y. Liang, “Feature selection and cancer classification via sparse logistic regression with the hybrid L1/2+2 regularization,” PLoS ONE, vol. 11, no. 5, 2016.
- P. Chanda, K. Manali, R. Dhananjay, and W. Dipak, “Imputation of Missing Gene Expressions for DNA Microarray Using Particle Swarm Optimization,” in Proceedings of the Second International Conference on Computer and Communication Technologies: IC3T 2015, Volume 3, S. C. Satapathy, K. S. Raju, J. K. Mandal, and V. Bhateja, Eds. New Delhi: Springer India, 2016, pp. 65–74.
- P. Baraldi, F. D. Maio, D. Genini, and E. Zio, “Reconstruction of missing data in multidimensional time series by fuzzy similarity,” Applied Soft Computing, vol. 26, no. Supplement C, pp. 1–9, 2015.
- J. Li W. Dong and D. Meng, “Grouped gene selection of cancer via adaptive sparse group lasso based on conditional mutual information,” IEEE/ACM Transactions on Computational Biology and Bioinformatics, vol. 15, no. 6, pp. 2028–2038, 2017.
- O. T. M. C. G. S. P. B. T. H. R. T. D. B. R. B. Altman, “Missing value estimation methods for DNA microarrays,” Bioinformatics, vol. 17, no. 6, pp. 520–525, Jun. 2001.
- L. Fabio et al., “Multi-objective genetic algorithm for missing data imputation,” Pattern Recognition Letters, vol. 68, pp. 126–131, 2015.
- S. Waseem, R. Qamar, and A. Ejaz, “Missing Data Imputation using Genetic Algorithm for Supervised Learning,” INTERNATIONAL JOURNAL OF ADVANCED COMPUTER SCIENCE AND APPLICATIONS, vol. 8, no. 3, pp. 438–445, 2017.
- O. A. Alomari, A. T. Khader, M. A. Al-Betar, and Z. A. A. Alyasseri, “A Hybrid Filter-Wrapper Gene Selection Method for Cancer Classification,” in 2018 2nd International Conference on BioSignal Analysis, Processing and Systems (ICBAPS), 2018, pp. 113–118.
- C. T. Tran, M. Zhang, and P. Andreae, “Multiple imputation for missing data using genetic programming,” in Proceedings of the 2015 annual conference on genetic and evolutionary computation, 2015, pp. 583–590.
- J. C. Hernandez, B. Duval, and J. K. Hao, “A genetic embedded approach for gene selection and classification of microarray data,” EvoBio’07 Lecture Notes in Computer Science, p. 90–101, 2007.
- T. Nguyen, A. Khosravi, D. Creighton, and S. Nahavandi, “Hidden Markov models for cancer classification using gene expression profiles,” Information Sciences, vol. 316, no. Supplement C, pp. 293–307, 2015.
- J. Shi and Z. Luo, “Missing value estimation for DNA microarray gene expression data with principal curves,” in 2010 International Conference on Bioinformatics and Biomedical Technology, 2010, pp. 262–265.
- A. Wojtowicz, P. Zywica, A. Stachowiak, and K. Dyczkowski, “Solving the problem of incomplete data in medical diagnosis via interval modeling,” Applied Soft Computing, vol. 47, no. Supplement C, pp. 424–437, 2016.
- C. Zhong, W. Pedrycz, D. Wang, L. Li, and Z. Li, “Granular data imputation: A framework of Granular Computing,” Applied Soft Computing, vol. 46, no. Supplement C, pp. 307–316, 2016.
- K. Deb, Multi-Objective Optimization using Evolutionary Algorithms. Wiley, 2001.
- P. S. Oliveto, J. He, and X. Yao, “Time Complexity of Evolutionary Algorithms for Combinatorial Optimization: A Decade of Results,” International Journal of Automation and Computing, vol. 4, no. 1, pp. 100–106, Jan. 2007.
- Z. Y. X. Liu Y. Liang, S. Wang and H. Ye, “A Hybrid Genetic Algorithm With Wrapper-Embedded Approaches for Feature Selection,” IEEE Access, vol. 6, pp. 22863–22874, Mar. 2018.
- Y. Wang, G. Yang, and Y. Lu, “Informative gene selection for microarray classification via adaptive elastic net with conditional mutual information,” Applied Mathematical Modelling, vol. 71, no. 5439, pp. 286–297, Jul. 2019.
- D. Singh et al., “Gene expression correlates of clinical prostate cancer behavior,” Cancer Cell, vol. 1, no. 2, pp. 203–209, 2002.
- M. Shams, A. Tolba, and S. Sarhan, “A Vision System for Multi-View Face Recognition,” International Journal of Circuits, Systems, and Signal Processing, vol. 10, no. 1, pp. 455–461, 2017.
- A. A. Goshtasby, Image Registration: Principles, Tools and Methods. Springer London, 2014.
- H. Salem, G. Attiya, and N. El-Fishawy, “Classification of human cancer diseases by gene expression profiles,” Applied Soft Computing, vol. 50, no. Supplement C, pp. 124–134, 2017.
- K. J. Danjuma, “Performance evaluation of machine learning algorithms in post-operative life expectancy in the lung cancer patients,” International Journal of Computer Science Issues, vol. 12, no. 2, 2015.
- A. Paul, J. Sil, and C. D. Mukhopadhyay, “Gene selection for designing optimal fuzzy rule base classifier by estimating missing value,” Applied Soft Computing, vol. 55, no. Supplement C, pp. 276–288, 2017.
