A new point on ECG: point l as identifier of rapid and slow ejection phases boundary

Author: Rudenko Sergey M.
Journal: Cardiometry @cardiometry
Section: Basic research
Article in issue: 2, 2013.
Free access
Aims Description of rapid and slow ejection phases in the cardiac cycle. Materials and methods The theory of cardiac cycle phase analysis and mathematical equations of hemodynamics were used in the paper. The equations were employed to verify the balance of the phase-related diastolic and systolic blood volumes reliant on phase durations, and the identification of boundaries of the cardiac cycle phases on the ECG. Further, synchronous ECG & RHEO recording was used. Aortic blood filling was studied in the stated phases. Results The location of boundaries of rapid and slow ejection phases is traced. The boundaries did not have a precise definition before. Thus, a new symbol, the L point, on the ECG has been introduced to identify the boundaries of phases S - L, L - j. Conclusion Previously the location of point j on the ECG was impossible to identify. It was considered as a hypothermic wave on the ECG that could not always be traced. Point j was defined as the j (Osborn) wave. Thereby the location of boundaries of rapid and slow ejection phases, where volumetric parameters were equal to the stroke volume, was not accurately identified. The research enabled detecting the ECG recording criteria of the rapid and slow ejection phases. The results of the present research are published for the first time.
Cardiology, cardiometry, ecg, hemodynamics, point j, rheogram
Short address: https://sciup.org/148308731
IDR: 148308731
Text of the scientific article A new point on ECG: point l as identifier of rapid and slow ejection phases boundary
Aims Description of rapid and slow ejection phases in the cardiac cycle. Materials and methods The theory of cardiac cycle phase analysis and mathematical equations of hemodynamics were used in the paper. The equations were employed to verify the balance of the phase-related diastolic and systolic blood volumes reliant on phase durations, and the identification of boundaries of the cardiac cycle phases on the ECG. Further, synchronous ECG & RHEO recording was used. Aortic blood filling was studied in the stated phases. Results The location of boundaries of rapid and slow ejection phases is traced. The boundaries did not have a precise definition before. Thus, a new symbol, the L point, on the ECG has been introduced to identify the boundaries of phases S - L, L - j. Conclusion Previously the location of point j on the ECG was impossible to identify. It was considered as a hypothermic wave on the ECG that could not always be traced. Point j was defined as the j (Osborn) wave. Thereby the location of boundaries of rapid and slow ejection phases, where volumetric parameters were equal to the stroke volume, was not accurately identified. The research enabled detecting the ECG recording criteria of the rapid and slow ejection phases. The results of the present research are published for the first time. Keywords Cardiometry ≈ Cardiology ≈ Hemodynamics ≈ ECG ≈ Rheogram ≈ Point j Imprint S. Rudenko. ECG periodic table: a new ECG classification based on heart cycle phase analysis; Cardiometry; No.2; May 2013; p.30-39; doi: 10.12710/cardiometry.2013.2.3039 Available from:
The clinical interpretation of the ECG has an important function in the classical theory of electrocardiography. It is based on the analysis of the ECG intervals, segments, points and waves [1,2]. Despite the long period of practical application of the present analysis, no unique criteria for beginning and end of the intervals and waves existed. Numerous contradictions contributed to understanding of the ECG systolic cardiac cycle structure.
This is true for the S-T segment which structure is poorly known. The reason is its research complexity. Ambiguous and irregular variations of the S-T segment form have not enabled its accurate analysis yet.
To study the S-T segment the high resolution electrocardiography was recommended [3]. However, the aims have not been achieved and the S-T segment is regarded as Terra incognita by the researchers.
The controversial aspect is the j point location on the ECG. The uncertainty of its recording criteria led to refer to it as wave j following the QRS complex on the ECG curve [4, 5]. A number of researches consider wave j to appear close to wave T [6]. Hypothermia is considered to be a clinical cause for its appearing [7].
Since the S-T segment takes a half of the systole in the cardiac cycle, it becomes apparent that there is much to be studied in electrocardiography. Dissenting opinions confirm the existence of invisible zones on the ECG curves [8].
Studies on cardiac cycle phase analysis [9] appeared in the early 2000s. The research results on the noted problem became the subject for two theses [10,11]. To find out the truth of biological processes appropriate for the ECG systolic segment, the author of the present paper had to introduce new electrocardiological notions determining clear boundaries of the phase structure of the systolic part of the cardiac cycle.
Materials and methods
The theory of cardiac cycle phase analysis [9] was applied in this paper. The goal of the research was to identify the recording criteria of the cardiac cycle phases in the S-T segment on the ECG. Since there had been no boundary criteria of the cardiac cycle phases described in the literature, hemodynamics equations by G.Poyedintsev – O.Voronova [9] were applied in the paper. The present equations are based on the phase blood volume calculations by the indirect method. The cardiac cycle phase durations serve as volume characteristics for calculation functions. The S-T segment phase structure includes several phases: the load phase, rapid and slow ejection phases. Considering the fact that boundary recording criteria of these phases were not determined, the comparison principle of the known and unknown was employed. Thus, the hemodynamics equations by G.Poyedintsev – O.Voronova enable calculating phase-related diastolic and systolic blood volumes. The boundaries of diastolic cardiac cycle phases are clearly identified on the ECG curve. The criteria of identification of early atrial diastole and systole in the theory of electrocardiography are absolutely true. The equation is based on the law of conservation of energy, i.e., the amount of blood entering the heart is the same as the amount of blood ejected from the heart. Thus, setting up the equation of blood volumes of systolic and diastolic phases it is possible to find the causes for equation discrepancies and avoid them.
The equation is as follows:
PV1+PV2 = PV3+PV4
where:
PV1 is the volume of blood entering the ventricle in the early diastole (ml);
PV2 is the volume of blood entering the left ventricle in the atrial systole (ml);
PV3 is the volume of blood ejected by the ventricle during the rapid ejection phase (ml);
PV4 is the volume of blood ejected by the ventricle during the slow ejection phase (ml).
The first stage was to verify the recording criterion of point S, i.e., the load phase beginning. The recorded ECGs showed the S point was at the deflection point of the right part of the S wave. It conformed to the logic of biophysical processes creating the ECG form [9]. The first order derivative helped to identify it with 100% of the actual ECGs.
As a result the equality of diastolic and systolic blood volumes was obtained. It pointed out the validity of the S point identification criteria.
Further it was necessary to obtain individual components of systolic blood volume, namely PV3+PV4. The criterion of identification for boundaries of rapid and slow ejection phases should be identified. The load phase of the S-T segment was to be considered as well.
Within this phase the aortic valve is closed with no blood entering the aorta.
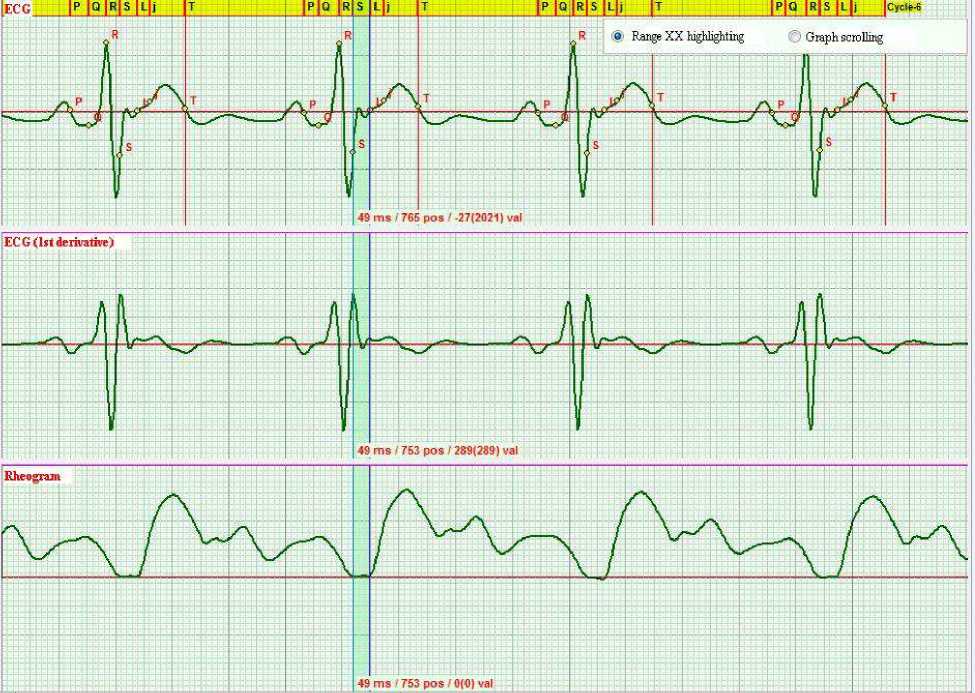
Figure 1. The synchronous ECG & RHEO recording. The beginning of the aortic valve opening procedure corresponds to the beginning of rapid ejection phase. To denote this moment on the ECG, a new symbol, the L point, was introduced.
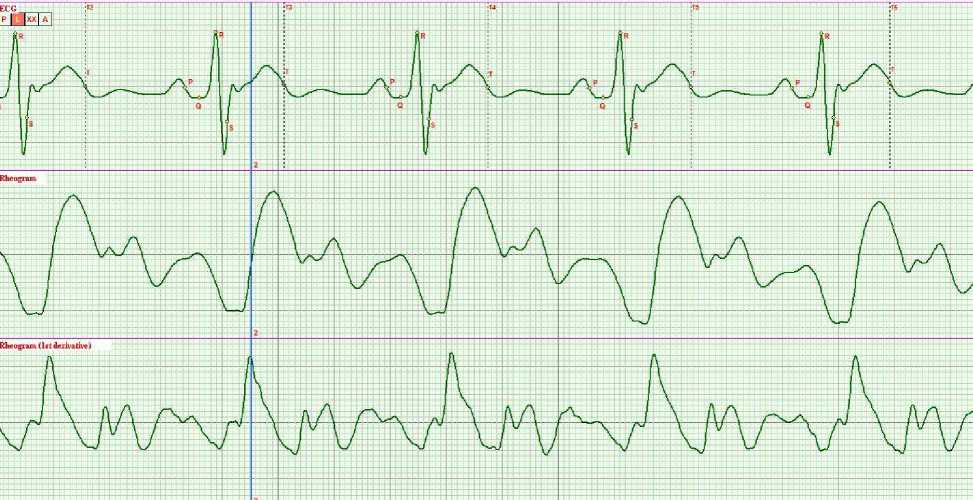
Figure 2. The synchronous ECG & RHEO recording. The j point corresponds to deflection point of the RHEO curve elevation segment and is identified with the maximum of the first order RHEO derivative. It represents the end of the small ECG wave before the Т wave.
Figure 2 represents the deflection point of the RHEO curve elevation segment clearly defined with the maximum of the first order derivative. However, it reflects the end of the small ECG wave located before the T wave. The approximate location of the point j corresponding to its registered location is described in the existing studies. Substituting the S-L and L-j phase durations into the G.Poyedintsev – O.Voronova hemodynamics equations, we obtain phase-related systolic blood volumes with their sum equal to the sum of diastolic blood volumes.
Further research completely confirmed that the use of S-L and L-j phase identification criteria proved to be true, and the equation mentioned above holds in 100% of cases.
Results
The main result is the identification of registration criteria of the boundaries of the rapid and slow ejection phases in cardiac cycle phase structure.
The second significant result is practical use of the mathematical model of hemodynamics that enables calculating the phase blood volumes.
The third result is the acquired possibility to measure the rapid and slow ejection phases in clinical trials.
Discussion and conclusions
Not knowing the location of the S wave as one of the key points, the RHEO was synchronized by fixing its minimum with respect to isoelectric baseline.
In the present paper the RHEO baseline was fixed in the point of the S wave [9]. The exact S point location enabled analyzing the mechanism of the regulation of the diastolic arterial pressure by the RHEO [9]. It was measured by the availability or deficit of blood filling with the RHEO curve up to point S, as Figure 3 shows. We are pioneers in solving this problem.
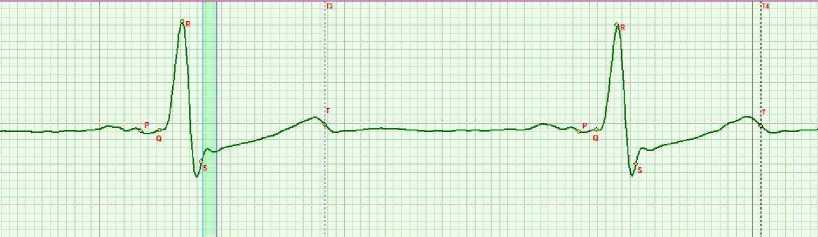
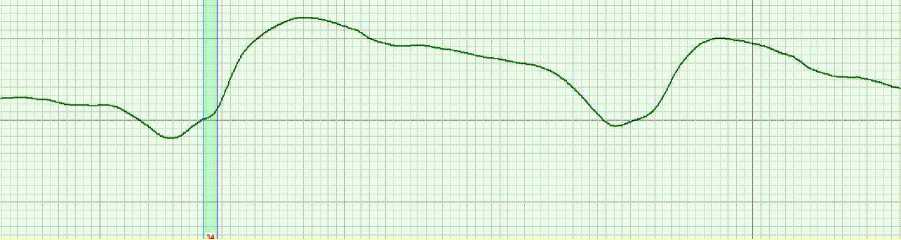
Figure 3. The possibility of qualitative evaluation of changing in aortic blood filling with the aortic valve closed. The RHEO curve elevation to the S point shows the blood volumes entering the aorta through the closed aortic valve.
Figure 3 demonstrates the RHEO curve elevation to the S point. When comparing with Figures 1 and 2, the blood penetration through the closed aortic valve is observed. If the RHEO was fixed on the isoelectric baseline by the RHEO minimum, it would be hard to define this elevation being a criterion of significant changes in the aortic valve functioning.
New solutions are opened up in the evaluation of the rapid and slow ejection phases. Figure 4 shows no elevation of the RHEO in the L-j phase. This entails significant clinical effects, namely, the impossibility of formation of the blood flow structure showing the elevated fluidity properties [9]. This can result in the large vessel thrombosis.
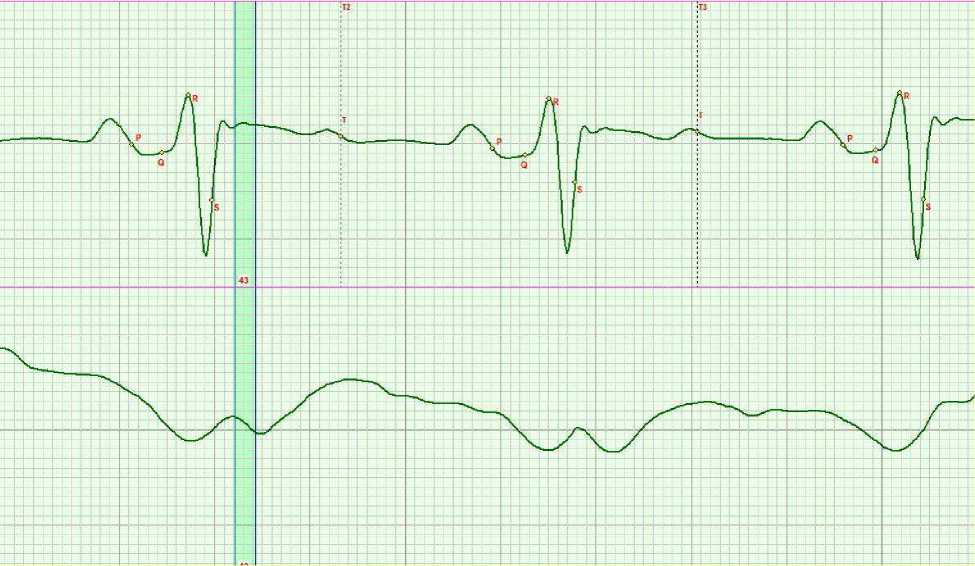
Figure 4. No normal growth of the rapid ejection phase. There is a negative slope in the L-j phase of the RHEO curve.
The definition of the Osborn wave can be treated from a new viewpoint. Figure 5 shows the ECG recording indicating the Osborn wave. However, the “wave” and “point” are to be separated. Point j reflects the rapid ejection phase end marked with a vertical stripe in Fig. 5. It is a middle portion of elevation of the RHEO curve. The Osborn wave is to the left of the phase.
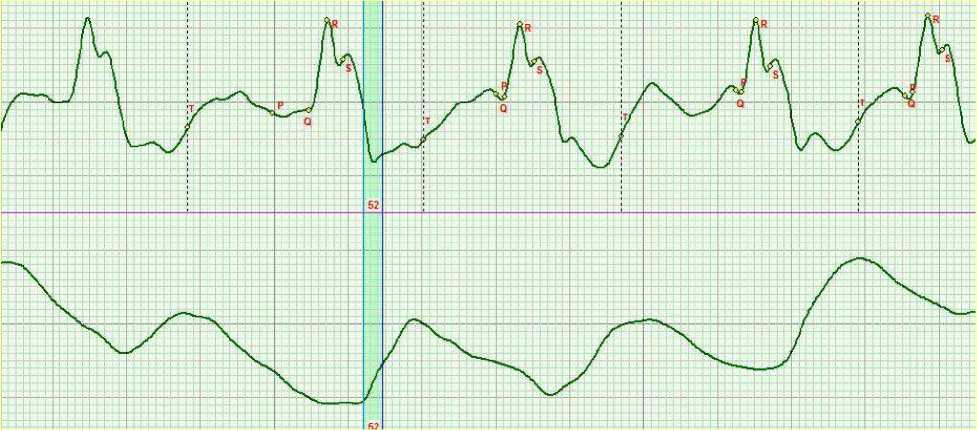
Figure 5. Point j location reflects the rapid ejection phase end marked in the Figure. It is verified by the middle of the RHEO leading edge.
The cardiac cycle phase analysis based on the mathematical models of hemodynamics by G.Poyedintsev – O.Voronova exposed Terra incognita in ECG hiding the structure of three systolic cardiac cycle phases, namely, the load, rapid and slow ejection phases. Indisputably, the research results will contribute to the electrocardiographic notions [12-17].
Awakening of the phase formation will enable experts to hold the key to the yet unknown functioning mechanisms of the cardiovascular system that remains enigma. If only there had been no Terra incognita in ECG, an artificial heart would have been created. But its creation is still ahead.
Statement on ethical issues
Research involving people and/or animals is in full compliance with current national and international ethical standards.
Conflict of interest
None declared.
References A new point on ECG: point l as identifier of rapid and slow ejection phases boundary
- Recommendations for the Standardization and Interpretation of the Electrocardiogram. http://content.onlinejacc.org/article.aspx?articleid=1188784#bib5
- ECG learning centre. http://ecg.utah.edu/
- Ivanov GG. High-resolution Electrocardiography. Triada-X;1999.
- Gussak I, Bjerregaard P, Egan TM, Chaitman BR. ECG phenomenon called the J wave: history, pathophysiology, and clinical significance. J. Electrocardiol.1995;49-58.
- Kalla H, Yan GX, Marinchak R. Ventricular fibrillation in a patient with prominent J (Osborn)waves and ST segment elevation in the inferior electrocardiographic leads: a Brugada syndrome variant? J. Cardiovasc. Electrophysiol. 2000;95-98.
- Marayama M, Atarashi H, Ino T, Kishida H. Osborn waves associated with ventricular fibrillation in a patient with vasospastic angina. J. Cardiovasc. Electrophysiol. 2002;486-489.
- Yan GX, Antzelevitch C. Cellular basis for the electrocardiographic J wave. Circulation.1996;372-379.
- Serafinovich DI. «Invisible areas» of anterior wall of the left ventricle. J. of Coronary Artery Disease. 2007; 7:148.
- Rudenko MY, et al. Theoretical principles of Cardiometry. Cardiometry. 2012;1:7-23.
- Rudenko SM. Development of system principles for aortic valve functional diagnostics.Doctorate thesis. Prepared by Mr. S.M.Rudenko, Ph.D., Taganrog, SFU, 2009, 135 pages.
- Mamberger KK. Development of methods for improving the reliability of measuring the duration of rapid ejection phase in the structure of the cardiac cycle. Doctorate Thesis. Prepared by Mr. K.K. Mamberger, Ph.D., Taganrog, SFU, 2012, 136 pages.
- Jalife J, et al. Basic Cardiac Electrophysiology for the Clinician. ISBN 978-1-4051-8333-8. (2009) DOI: 10.1002/9781444316940
- Zipes DP, Jalife J. Cardiac Electrophysiology:from Cell to Bedside.ISBN 978-1-4160-5973-8. (2009)
- Sclarovsky S, Nikus K. The electrocardiographic paradox of Tako-Tsubo cardiomyopathy-comparison with acute ischemic syndromes and consideration of molecular biology and electrophysiology to understand the electrical-mechanical mismatching. J Electrocardiol. 2009.
- Camm JA, Malik M. Dynamic Electrocardiography. Wiley-Blackwell; 2004. ISBN 9781405119603
- Macfarlane PW. Basic Electrocardiology: Cardiac Electrophysiology, ECG Systems and Mathematical Modeling. (2011).
- Macfarlane PW. Specialized Aspects of ECG. ISBN 978-0-85729-879-9. (2011).
