A New Similarity Measure Based on Gravitational Attraction for Improving the Accuracy of Collaborative Recommendations

Author: Vijay Verma, Rajesh Kumar Aggarwal
Journal: International Journal of Intelligent Systems and Applications @ijisa
Article in issue: 2 vol.12, 2020.
Free access
Recommender Systems (RSs) work as a personal agent for individuals who are not able to make decisions from the potentially overwhelming number of alternatives available on the World Wide Web (or simply Web). Neighborhood-based algorithms are traditional approaches for collaborative recommendations and are very popular due to their simplicity and efficiency. Neighborhood-based recommender systems use numerous kinds of similarity measures between users or items in order to achieve diverse goals for designing an RS such as accuracy, novelty, diversity etc. However, the existing similarity measures cannot manage well the data sparsity problems, which results in either very few co-rated items or absolutely no co-rated items. Furthermore, there are also situations where only the associations between users and items, such as buying/browsing behaviors, exist in form of unary ratings, a special case of ratings. In such situations, the existing similarity measures are either undefined or provide extreme values such as either 0 or 1. Thus, there is a compelling need to define a similarity measure that can deal with data sparsity problem and/or unary rating data. This article proposes a new similarity measure for neighborhood-based collaborative recommender systems based on Newton's law of universal gravitation. In order to achieve this, a new way of interpreting the relative mass as well as the relative distance has been taken into consideration by using the rating data from the user-item matrix. Finally, for evaluating the proposed approach against baseline approaches, several experiments have been conducted using standardized benchmark datasets such as MovieLens-100K and MovieLens-1M. Results obtained demonstrate that the proposed method provides better predictive accuracy in terms of RMSE and significantly improves the classification accuracy in terms of precision-recall.
Recommender Systems, Collaborative Filtering, Similarity Measures, Newton's law of universal gravitation, E-commerce
Short address: https://sciup.org/15017494
IDR: 15017494 | DOI: 10.5815/ijisa.2020.02.05
Text of the scientific article A New Similarity Measure Based on Gravitational Attraction for Improving the Accuracy of Collaborative Recommendations
Published Online April 2020 in MECS
Recommender Systems (RSs) help individuals who are not able to make decisions from the potentially overwhelming number of alternatives available on the World Wide Web (or simply Web) [1,2]. A number of commercially successful websites including YouTube[3] and Netflix[4] have employed RSs to facilitate their customers to find interesting items e.g. videos, movies. RSs are the crucial technique for e-commerce websites for providing personalized services to their customers[5]. RS provide relevant suggestions, that may be interesting/useful to users, by exploiting the various sources of data related to users, items and their interactions[6]. Fig.1 shows a high-level abstract view of an RS in general.
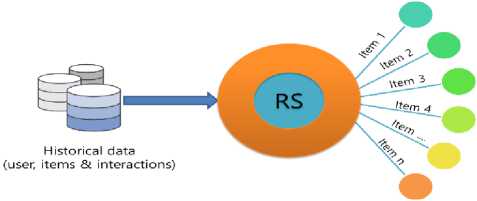
Fig.1. A high-level abstract view of an RS.
Among various recommendation approaches, collaborative filtering-based approaches are the most popular techniques. The articles [6], [16], and [17] provide excellent surveys on collaborative filtering-based recommendations. According to [16], collaborative recommendation approaches can further be classified into two general classes as memory-based and model-based. Memory-based approaches [17-19], also referred to as neighborhood-based collaborative filtering algorithms, use the entire collection of user-item rating data stored in the system for the recommendations process. In contrast to neighborhood-based approaches, the model-based approaches build a model by learning from rating data [20–23]. Particularly, neighborhood-based algorithms (for an example k-Nearest Neighbors) are the traditional algorithms for collaborative recommendation approaches [24]. These algorithms are very popular due to their simplicity, in terms of implementation, and efficiency in terms of performance. Neighborhood-based recommender systems use numerous definitions of similarities between either users or items. The similarity measure is the core component of the neighborhood-based collaborative recommendation as explained by Herlocker et al. in the articles [25], [26].
Traditionally, the similarity between users or items is defined using statistical measures such as Pearson Correlation Coefficient (PCC) [27, 28], Constrained Pearson Correlation Coefficient (CPCC) [11], Mean Squared Difference (MSD) [11], Cosine similarity (COS) [16] and Adjusted Cosine Similarity (ACOS) [19]. Moreover, few researchers utilized heuristic information to define the similarity between users/items such as Proximity-Impact-Popularity (PIP-measure) [29], and Proximity-Significance-Singularity (PSS-measure) [30].
In recent years, different contextual information along with hybridization of two or more existing similarity measures, is also exploited for defining similarity such as Jaccard-Mean-Squared- Difference (JMSD) [31], Coverage-based JMSD (CJMSD) [32], singularity-based (SING) [33], and significance-based (s-metric) [34].
Several experiments have been performed using the standardized benchmark datasets, MovieLens-1M and MovieLens-100k, for validating the effectiveness of the proposed similarity measure against various accuracy matrices such as RMSE, precision, and recall; which are considered as the most examined goals for designing an RS.
The rest of the article is organized as follows: Section II highlights some of the related work for the similarity measures. Section III explains the proposed similarity measure in detail; Section IV discusses the experimental details and results; finally, we conclude the article in Section V.
-
II. Related Works
In the past, there have been several efforts in designing similarity measures to be used with the neighborhoodbased collaborative recommendation. In RS literature, there are numerous similarity measures have been proposed to calculate the similarity between users or items.
Traditionally, Pearson Correlation Coefficient (PCC) [27, 28], Constrained Pearson Correlation Coefficient (CPCC) [11], Mean Squared Difference (MSD) [11], Cosine similarity (COS) [16] and Adjusted Cosine Similarity (ACOS) [19] are used to find out the similarity between either users or items. Table 1 summarizes these traditional similarity measures with their formulae and major drawbacks.
Apart from the traditional similarity measures, there are some new similarity measures proposed in recent times. Ahn [29] proposed a new similarity measure, called PIP (Proximity, Impact, and Popularity), for solving the cold starting problem and Liu et al. [30] further improves this PIP measure.
Bobadilla et al. proposed several similarity measures in order to remove the limitations of existing traditional similarity measures [31-34]. In [31], Bobadilla et al. combined the Jaccard index with MSD to define a new similarity metric, called JMSD. This JMSD metric had been further enhanced in [32] by adding an additional term corresponding to improve the coverage of an RS, therefore called as Coverage-based JMSD (CJMSD). Different contextual information related to items and users such as singularities, significances etc. have been utilized to propose new similarity measures in [33, 34].
Further, Patra et al. [36], has proposed a new similarity measure by utilizing Bhattacharyya Coefficient to handle the data sparsity problem. In addition, there are numerous articles present in the recommender systems literature, which combine two or more similarity measures in order to introduce a new hybrid similarity measure.
-
A. Motivation
There exist numerous ways to define the similarity between users or items in the neighborhood-based collaborative recommendations, as explained in the previous section. These similarity measures facilitate the development of an RS with diverse goals such as accuracy, novelty, coverage, serendipity etc. Particularly, some of the model-based approaches are better than neighborhood-based approaches in terms of prediction accuracy, still, for better users’ experience, the accuracy alone is not sufficient. Another important factor for effective and satisfying users’ experience is the concept of serendipity [38], which may help the users to discover absolutely different items. Serendipity enhances the idea of novelty by adding a factor of surprise, however, serendipitous recommendations may not always result in guaranteed success.
Table 1. The traditional similarity measures with their definitive formulae
|
Measure |
Definitive Formula |
Drawbacks |
|
Pearson Correlation Coefficient (PCC) |
∑ ( rui - ru )( rvi - rv ) PCC ( u , v ) = i ∈ Iuv ∑ ( rui - ru )2 ∑ ( rvi - rv )2 i ∈ I uv i ∈ I uv |
Few co-rated items Data sparsity problem Misleading results* |
|
Constrained Pearson Correlation Coefficient (CPCC) |
∑ ( rui - rmed )( rvi - rmed ) CPCC ( u , v ) = i ∈ Iuv ∑ ( rui - rmed ) 2 ∑ ( rvi - rmed ) 2 i ∈ I uv i ∈ I uv |
Few co-rated items Data sparsity problem |
|
Mean Squared Difference (MSD) |
∑ ( r ui - r vi )2 MSD ( u , v ) = 1 - i ∈ Iuv | Iuv | |
Few co-rated items Data sparsity problem |
|
Cosine similarity (COS) |
∑ ( rui )( rvi ) COS ( u , v ) = i ∈ Iuv ∑ ( r ui )2 ∑ ( r vi )2 i ∈ Iuv i ∈ Iuv |
Few co-rated items Data sparsity problem Misleading results |
|
Adjusted Cosine Similarity (ACOS) |
∑ ( rui - ru )( ruj - ru ) ACOS ( i , j ) = u ∈ Uij ( r - r )2( r - r )2 ui u uj u u ∈ Uij u ∈ Uij |
Few co-rated items Data sparsity problem |
|
Notation Used : Following notations are used to define the above formulae:
|
||
Neighborhood-based approaches favor the serendipitous recommendations along with following advantages [39]:
-
• Simplicity: these methods are comparatively
simple to implement and require just one parameter, the number of neighbors, generally.
-
• Efficiency: these methods are very efficient in term of performance and memory because there is no costly training phase, therefore makes them suitable for scalable applications.
-
• Justifiability: these methods are capable to provide concise explanations for the recommendations so that users can better understand the system.
Therefore, finding new similarity measures for neighborhood-based methods is an active thread of research among the researchers. Furthermore, the existing CFRS can be easily refurbished by only replacing the similarity measurement module. The proposed similarity measure overcomes the following limitations of the traditional as well as the state-of-art similarity measures:
Data sparsity: In any RS, the rating data i.e. the useritem matrix is very sparse which results in very few or almost no co-rated items between users. Therefore, existing similarity measures fail to calculate the similarity. The proposed similarity measure works well with no commonly rated items as explained in the illustrative example 2.
Implicit feedback datasets (Unary ratings): In some cases, the users’ preferences are collected from their actions such as buying/browsing behaviors in the form of unary ratings. The state-of-art similarity measures are either not defined or provide always extreme score (0 or 1) for such datasets while the proposed measure works well for the unary rating dataset as explained in the illustrative example 1.
-
III. Proposed Similarity Measure
In 1686, Sir Isaac Newton proposed the universal gravitational law of attraction between two bodies based
on some empirical observations. The law states that the two bodies attract each other with a force (F), which is proportional to the product of their masses and inversely proportional to the square of the distance between them as shown in Fig. 2.
with the lower value of the mass. Another way to model the relative mass of a user may be defined as shown in (2).
mass ( u ) =
Z r ui
‘ 6 Iu
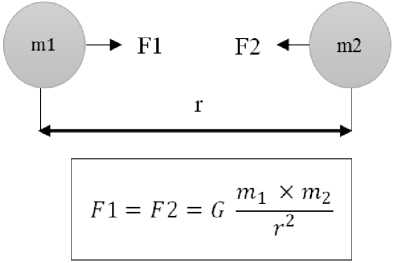
Fig.2. Newton’s Law of Universal Gravitation.
A. Relative Mass
The relative mass of a user can be represented as follows: if a user provides more ratings that means that he/she is an active user of the system. Therefore, the relative mass of a user (u) may be modeled using the activeness of the user as shown in (1).
mass(u) =
total number of ratings given by user i.e. | I |
MAX
The constant MAX is used to normalize the relative mass value between 0 and 1. The constant MAX is defined as the maximum number of ratings given by a user in the system. Therefore, the most active user will have the relative mass equal to 1, who has rated the maximum number of items in the system. Cleary, the relative mass of any user will lies between 0 and 1 so for any two users A and B having masses m1 and m2 respectively then0 < m, < 1 and 0 < m 2< 1which implies that 0 < ( mx * m 2) < 1 .The relative mass value of 0 represents a new user (or a user who has not provided any rating) while the mass value 1 represents the most active user in the system. The user with the higher value of the mass will show greater affinity in comparison to a user
| I u |

Z rui i 6 Iu
| I |
Notations used are already explained in the last row of Table 1. The first term of the expression represents the average rating given by a user u. The second term represents how much items have been rated by the user with respect to the total number of items in the system. Semantically, both terms in combination show the average rating given by the user u over all the items in the system if he/she would rate all the items of the system.
B. Relative Distance
Similar to the relative mass, the relative distance between users is also represented using the rating data, present in the UI-matrix. The basic hypothesis is as follows: if the two users have more number of commonly rated items then they possess the tendency of similar interests. Likewise, if the number of uncommonly rated items between two users increases then these users may have their inclination to different items, therefore, having the tendency to be more apart from each other. We postulate that the relative distance between two users can be defined as the ratio of the number of uncommonly rated items to the number of items rated by both users, as defined by (3).
distance( u,v ) = { n ( “ ) - n ( u П v )} + { n ( v ) - n ( u П v )} (3) n ( u о v )
where,
n ( u ) : the number of items rated by the user u, i.e. | I | n ( v ) : the number of items rated by the user v, i.e. | I | n ( u n v ) : the number of items that are commonly rated by both the users u and v, i.e. | I |
n ( u о v ) : the number of items rated by either the user u or by the user v or by both the users.
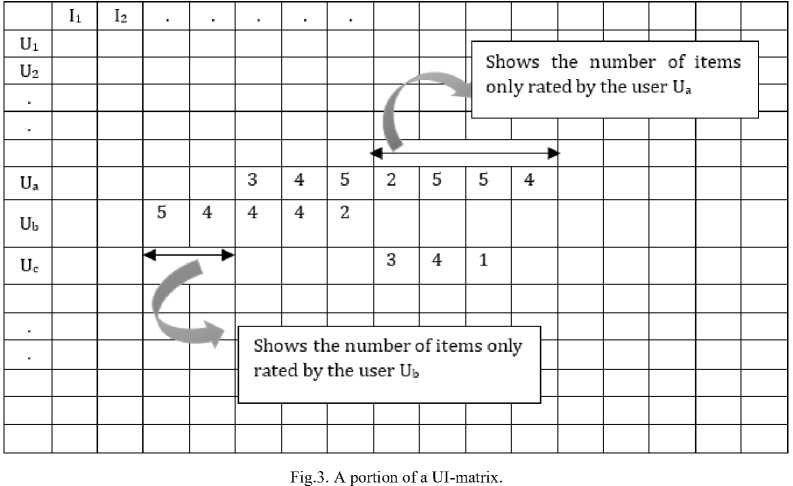
In (3), the term in the denominator, n ( u о v ) , is used to normalize the distance value between 0 and 1. Fig. 3 shows a snippet of a UI-matrix, where the number of uncommonly rated items between the users U and U are shown using line segments. Further, (3) may be rewritten after further simplification as (4).
distance( u , v ) = n ( u ° v )— n ( u П v ) = [ 1 - n ( u П v ) | = ( 1 - jaccard ( u , v ) ) n ( u о v ) ( n ( u о v ) J
Where jaccard ( u , v ) represents the Jaccard similarity index [40], between the users u and v. Therefore, we can conclude that the proposed distance effectively comes out to be equal to the Jaccard distance. We know that the Jaccard index(J) always lies between 0 and 1 i.e. 0 < J < 1 which implies that 0 < (1 - J ) < 1 , therefore the Jaccard distance will also lie between 0 and 1.
-
B.1. Is the proposed distance is a metric or a measure?
Formally, a distance measure(d) is called a metric, if it satisfies the following four conditions:
-
(1) d ( i , j ) > 0
-
(2) d ( i , j ) = 0 ^ i = j
-
(3) d ( i , j ) = d ( j , i )
-
(4) d ( i , k ) < d ( i , j ) + d ( j , k ) .
As the proposed relative distance is equal to the Jaccard distance which satisfies all the above four conditions, the proof is given in the article [41]. Thus, results in making the proposed relative distance as a metric.
-
C. The similarity measure
Finally, the similarity between two users, u1 and u2 are calculated by using the formula analogous to Newton’s law of the gravitational attraction as specified by (5).
F (il aiA sim 1, 2
mass ( u ) * mass ( u ) [distance( u , u )]2
From (5), it is clear that a lower value of distance will provide greater similarity between users. As, (1)-(5) have been written for users, we can also rewrite analogous equations to calculate the similarity between items for the item-based neighborhood approaches.
Illustrative Example1: Consider the UI matrix as shown in Fig. 3, the similarity between the users U and Ub can be calculated as follows: n(Ua ) = 7 ; n(Ub ) = 5 ; n(U a n U b ) = 3 ; n(U a и U b ) = 9 . Therefore, mass (Ua ) = 7 / MAX ; mass (Ub ) = 5/ MAX ; distance( U o, Ub ) = ( 1 - 3/9 ) = 0.67 . The similarity between users, F ( U , U ) , is equal to ( 0.7 x 0.5 ) / ( 0.67 ) 2 = 0.779; assuming the value of the constant MAX is to be 10 for this toy example. It should be noted that the rating values in the UI matrix are on a scale of 1 to 5 i.e. scalar rating; if these ratings are unary ratings i.e. only the association of users with items are known then traditional similarity measures are either not defined or result in extreme values, however, the proposed similarity measure will result in the same value, 0.779, as in the case of scalar rating.
Illustrative Example 2: Again consider the UI matrix as shown in Fig. 3, In order to calculate the similarity between the users U and U , who have no corated items between them, we proceed as follows: n(Ub ) = 5 ; n(Uc ) = 3 ; n(Ub n Uc ) = 0 ; n(Ub и Uc ) = 8 . Therefore, mass (Ub ) = 5 / MAX ; mass (Uc ) = 3/ MAX ; distance( U 6, Uc ) = ( 1 - 0/8 ) = 1 .The similarity between users, Fsi m( U 6, Uc ), is equal to ( 0.5 x 0.3 ) / ( 1.0 ) 2 = 0.15; assuming the value of the constant MAX is to be 10 for this toy example.
Here again, none of the traditional similarity is defined as they operate only on the set of commonly rated items, which is an empty set here. In such cases, the proposed similarity measure returns the maximum value of the distance i.e. 1 and the value of the similarity is measured based on the relative masses of the users.
-
IV. Experiments
In order to validate the effectiveness of the proposed similarity measure, we have performed offline experiments. An offline experiment is typically the easiest because it doesn’t require the interaction with real users [42].
-
A. The dataset
We have used the standard benchmark MovieLens datasets, which are publicly available from GroupLens[43]. Table 2 summarizes datasets briefly, the more detailed description and history of the MovieLens datasets can be found in [44].
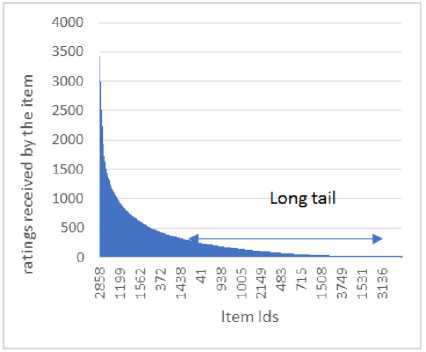
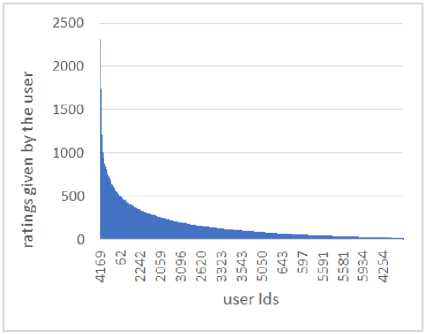
Fig. 4(a) represents the well-known long tail problem associated with recommender systems for the MovieLens-1M dataset. According to this problem, only a limited number of items are rated repeatedly by users, such items are called popular items, while, a very large number of items are rated barely. This problem results in the distribution of ratings to be extremely skewed. Fig. 4(b) shows the rating distribution with respect to the user ids. Here, it is clear that the user with the userId= 4169 has rated the maximum number of movies i.e. 2314 times; hence the constant MAX is equal to 2314 for the MovieLens-1M dataset.
-
B. Experimental design
In order to evaluate the effectiveness of the proposed gravitational similarity measure, we have used the traditional user-based collaborative filtering (UBCF) with k-Nearest Neighbors(kNN) technique. However, the usual similarity measures between users are replaced with the proposed gravity-based similarity measure as shown in (5). All the experiments are performed using the system and software specified in Table 3. Furthermore, we have utilized the Apache Mahout framework[45] for all experiments. Fig. 5 summarizes the basic components of a simple user-based recommender in this framework[46], while Fig. 6 demonstrates a simple flow diagram of the basic steps involved in a UBCF for the
Apache Mahout framework.
-
C. Evaluation Metrics
Accuracy is considered as the most crucial and the most examined goal for designing an RS. We have examined the following two types of accuracy measures in our experiments.
-
• Prediction accuracy
-
• Classification accuracy
C.1. Prediction accuracy
In order to evaluate the capability of an RS to correctly predict the preference for a user-item pair, we have used the Root Mean Squared Error(RMSE) metric. For a given test set T of user-item pairs (u, i), RMSE is defined as follows:
RMSE = 1 ( r ˆ - r )2 (6)
ui ui
| T | ( u , i ) ∈ T
C.2. Classification accuracy
Generally, it is not necessary to predict the rating values for providing the recommendations. Actually, in some cases, it is sufficient to provide a list of top-N recommendations, which may or may not be ordered, without estimated ratings for the items in the list. Therefore, we can also apply basic information retrieval metrics for evaluating recommender. These metrics, such as precision and recall, can be adopted in the recommender system scenario without much difficulty.
Precision: the proportion of top recommendations that are good recommendations
Recall: the proportion of good recommendations that are present in top recommendations.
In a recommender system, the utility of these evaluation metrics relies exclusively upon the fact that how adequately we define: what are good recommendations.
|
Dataset |
Brief Detail |
Sparsity Level |
|
MovieLens 1M |
|
1 - 1000,209 = 95.754 6040 ∗ 3900 |
|
MovieLens-100K |
|
1 - 100,000 = 93.696 943 ∗ 1682 |
(a)
(b)
Fig.4. For MovieLens-1M dataset (a) The long tail problem (b) The distribution of ratings with respect to users
Furthermore, in the case of unary rating datasets, only the classification-based accuracy metrics are available for evaluation purposes.
-
D. Results
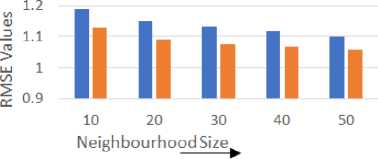
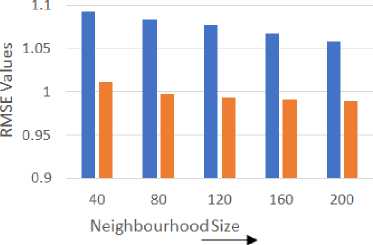
Based on the general bibliography in the recommender system research, the Pearson Correlation Coefficient (PCC), among all the traditional similarity measures, provides the best result for predictive accuracy. Therefore, we have evaluated the proposed gravity-based similarity measure against the PCC measure. We have used 80% of rating data from all the users as training data (used for calculating similarity, nearest neighbors) and the remaining 20% ratings of each user are used for testing purpose. Training and test data are chosen randomly in order to avoid any bias from the data selection. Fig.7 compares the RMSE values for both the similarity measures by varying size of nearest neighbors (a) for the MovieLens-100K dataset and (b) for MovieLens-1M dataset.
It is a well-known fact that the predictive accuracy measures, such as MAE, RMSE etc., alone are not enough to depict the real flavor of the accuracy of an RS. Therefore, other classification-based accuracy metrics such as precision and recall are also examined for the varying size of the Top-N recommendations while keeping the neighborhood size to be fixed. Here, we have chosen the neighborhood size equal to 200 for the MovieLens-1M dataset since after this neighborhood size there is no significant improvement in the RMSE values. Furthermore, these accuracy measures, precision, and recall have been simulated as follows:
-
• for each user, the framework determines the Top-N preferences.
-
• train the model without these Top-N preferences
-
• ask the newly trained model for Top-N recommendation for that user and
-
• compare those excluded top-N preferences with respect to the predicted top-N recommendations
In order to define the notion of good recommendations, the framework selects the set of good recommendations only from those items for which the user has expressed preferences above the certain threshold value. This threshold value can be specified either explicitly or implicitly chosen by the framework on a per-user basis.
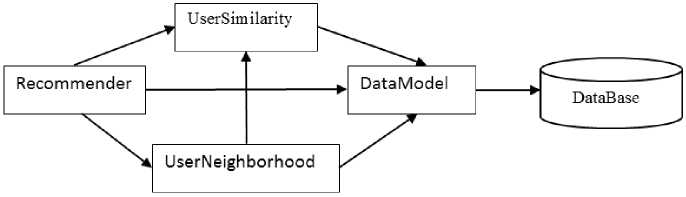
Fig.5. The interaction among basic components of general UBCF in mahout.
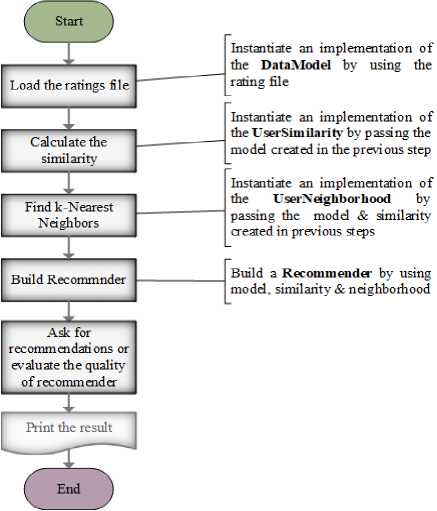
Fig.6. The flow diagram of a general UBCF in Mahout.
We have experimented with the threshold value on a per-user basis, in order to avoid any biases which may arise due to individual differences of rating pattern. For a user, this threshold value is defined as user’s average rating(µ) plus one standard deviation(σ) as shown in Eq. (7).
threshold = ц + ст (7)
Table 4 compares the precision and recall values for the different size of recommendation list (a) for MovieLens-1M dataset (b) for MovieLens-100K dataset. The proposed similarity measure is compared against the PCC and Jaccard similarity index. The precision and recall values are also measured for the Jaccard similarity index because it also considers only the structural associations between users & items rather than actual rating values. The entries in Table 4 can be interpreted as follows: the value Precision@20 = 0.042 means that from a list of Top-20 recommendations 4.2% are good recommendations; by considering the average over all the users in the system.
■ PCC based ■ Gravity based
Table 4. The value of precision and recall for the varying size of the recommended list. (a) for MovieLens-1M dataset (b) for MovieLens-
100K dataset
(a)
|
Metrics |
PCC |
Jaccard index |
Gravity-based |
|
Precision@20 |
0.00782 |
0.02239 |
0.04203 |
|
Recall @20 |
0.00890 |
0.02467 |
0.05025 |
|
Precision@30 |
0.02288 |
0.04598 |
0.06930 |
|
Recall @30 |
0.02501 |
0.05658 |
0.08403 |
|
Precision@40 |
0.03479 |
0.06641 |
0.08973 |
|
Recall @40 |
0.03994 |
0.08486 |
0.11691 |
(a)
■ PCC based ■ Gravity based
(b)
Fig.7. The RMSE values for (a) MovieLens-100K and (b) MovieLens-1M dataset.
Table 3. The particulars of the system and software used in the experiments
|
Processor |
Intel(R) Core (TM) i7-7700 CPU@ 3.60 GHz |
|
Operating System |
Windows 10 pro |
|
RAM |
8.00 GB |
|
Java Runtime Environment (JRE) |
Java 1.8 |
|
Apache Mahout version |
0.5 or higher |
(b)
|
Metrics |
PCC |
Jaccard index |
Gravity-based |
|
Precision@20 |
0.05503 |
0.08093 |
0.12212 |
|
Recall @20 |
0.06525 |
0.11886 |
0.15871 |
|
Precision@30 |
0.08371 |
0.10875 |
0.14562 |
|
Recall @30 |
0.10938 |
0.15816 |
0.19971 |
|
Precision@40 |
0.10128 |
0.13285 |
0.16070 |
|
Recall @40 |
0.14154 |
0.19583 |
0.23514 |
The proposed measure significantly improves these metrics against the traditional measures and the results highlight the effectiveness of the proposed similarity measure. Based on the empirical findings, we believe that significant improvement is due to the following facts:
-
• The proposed measure considers all the items rated by a user rather than considering only the co-rated items.
-
• It gives more weight to the number of uncommonly rated items while calculating the distance between users (by taking the square of the distance in the denominator part).
-
V. Conclusion and Future Work
In this paper, a new similarity measure for collaborative recommender systems, in particular for the user-based collaborative filtering (UBCF), is proposed.
An analogous method can be used to define the similarity between items for the item-based collaborative filtering (IBCF) too. The proposed similarity measure is based on Newton’s law of Gravitational attraction and provides a new way to interpret the relative mass and relative distance by using the rating data from the user-item matrix (UI-matrix).
The results of the experiments show that if we use the proposed similarity measure in a neighborhood-based collaborative recommender system then we can have improved predictive accuracy as well as better results for precision and recall as an assessment of the classification accuracy. From the evaluation performed, the proposed similarity measure also works well for unary rating data, where only the association between users and items are known such as buying/browsing behaviors rather than the actual rating value. This has been evidenced by the various performance metrics obtained and compared against the standard baseline methods such as PCC. For the future work, this gravity-based similarity measure can be expanded into the following directions:
-
• Try to learn the universal constant G, which is present in the natural gravitation law, for a given dataset using some learning strategies as this work ignores the importance/usage of this universal constant G.
-
• Try to solve the new-user cold start problem which arises when a new user joins the system and has no preference data.
-
• In the case of scalar ratings, the proposed work ignores the actual rating values. This limitation may be removed as a future task.
As a summary, proposed new similarity measure provides better predictive accuracy in terms of RMSE and significantly improves the classification accuracy (precision-recall). It is concluded that the proposed approach can provide better recommendations for commercially successful e-commerce websites.
References A New Similarity Measure Based on Gravitational Attraction for Improving the Accuracy of Collaborative Recommendations
- G. Adomavicius and A. Tuzhilin, “Toward the next generation of recommender systems: A survey of the state-of-the-art and possible extensions,” IEEE Trans. Knowl. Data Eng., vol. 17, no. 6, pp. 734–749, 2005.
- J. Bobadilla, F. Ortega, A. Hernando, and A. Gutiérrez, “Recommender systems survey,” Knowledge-Based Syst., vol. 46, pp. 109–132, 2013.
- “YouTube.” [Online]. Available: https://www.youtube.com/. [Accessed: 19-Dec-2018].
- “Netflix India – Watch TV Programmes Online, Watch Films Online.” [Online]. Available: https://www.netflix.com/in/. [Accessed: 19-Dec-2018].
- J. Ben Schafer, J. Konstan, and J. Riedl, “Recommender Systems in E-Commerce,” pp. 158–166, 1999.
- Y. Shi, M. Larson, and A. Hanjalic, “Collaborative Filtering beyond the User-Item Matrix : A Survey of the State of the Art and Future Challenges,” ACM Comput. Surv., vol. 47, no. 1, pp. 1–45, 2014.
- M. Balabanović and Y. Shoham, “Fab: Content-based, Collaborative Recommendation,” Commun. ACM, vol. 40, no. 3, pp. 66–72, Mar. 1997.
- K. Lang, “NewsWeeder : Learning to Filter Netnews ( To appear in ML 95 ),” Proc. 12th Int. Mach. Learn. Conf., 1995.
- C. Science and J. Wnek, “Learning and Revising User Profiles: The Identification of Interesting Web Sites,” Mach. Learn., vol. 331, pp. 313–331, 1997.
- W. Hill, L. Stead, M. Rosenstein, and G. Furnas, “Recommending and evaluating choices in a virtual community of use,” in Proceedings of the SIGCHI conference on Human factors in computing systems - CHI ’95, 1995.
- U. Shardanand and P. Maes, “Social information filtering: Algorithms for Automating ‘Word of Mouth,’” Proc. SIGCHI Conf. Hum. factors Comput. Syst. - CHI ’95, pp. 210–217, 1995.
- Billsus Daniel and Pazzani Michael J., “User modeling for adaptative news access. ,” User Model. User-adapt. Interact., vol. 10, pp. 147–180, 2002.
- R. Burke, “Hybrid recommender systems: Survey and experiments,” User Model. User-Adapted Interact., 2002.
- X. Su and T. M. Khoshgoftaar, “A Survey of Collaborative Filtering Techniques,” Adv. Artif. Intell., vol. 2009, no. Section 3, pp. 1–19, 2009.
- M. D. Ekstrand, “Collaborative Filtering Recommender Systems,” Found. Trends® Human–Computer Interact., vol. 4, no. 2, pp. 81–173, 2011.
- J. S. Breese, D. Heckerman, and C. Kadie, “Empirical analysis of predictive algorithms for collaborative filtering,” Proc. 14th Conf. Uncertain. Artif. Intell., vol. 461, no. 8, pp. 43–52, 1998.
- A. Nakamura and N. Abe, “Collaborative Filtering Using Weighted Majority Prediction Algorithms,” in Proceedings of the Fifteenth International Conference on Machine Learning, 1998, pp. 395–403.
- C. C. Aggarwal, J. L. Wolf, K.-L. Wu, and P. S. Yu, “Horting hatches an egg: A New Graph-Theoretich Approach to Collaborative Filtering,” Proc. fifth ACM SIGKDD Int. Conf. Knowl. Discov. data Min. - KDD ’99, pp. 201–212, 1999.
- B. Sarwar, G. Karypis, J. Konstan, and J. Reidl, “Item-based collaborative filtering recommendation algorithms,” Proc. tenth Int. Conf. World Wide Web - WWW ’01, pp. 285–295, 2001.
- L. Ungar and D. Foster, “Clustering methods for collaborative filtering,” AAAI Work. Recomm. Syst., pp. 114–129, 1998.
- Y.-H. Chen and E. I. George, “A Bayesian model for collaborative filtering,” Proc. 7th Int. Work. Artif. Intell. Stat., no. 1, 1999.
- L. Getoor and M. Sahami, “Using probabilistic relational models for collaborative filtering,” Work. Web Usage Anal. User Profiling, 1999.
- K. Goldberg, T. Roeder, D. Gupta, and C. Perkins, “Eigentaste,” no. August, pp. 1–11, 2000.
- D. Goldberg, D. Nichols, B. M. Oki, and D. Terry, “Using collaborative filtering to weave an information tapestry,” Commun. ACM, vol. 35, no. 12, pp. 61–70, 1992.
- J. L. Herlocker, J. A. Konstan, A. Borchers, and J. Riedl, “An algorithmic framework for performing collaborative filtering,” in Proceedings of the 22nd annual international ACM SIGIR conference on Research and development in information retrieval - SIGIR ’99, 1999, pp. 230–237.
- J. O. N. Herlocker and J. Riedl, “An Empirical Analysis of Design Choices in Neighborhood-Based Collaborative Filtering Algorithms,” Inf. Retr. Boston., pp. 287–310, 2002.
- P. Resnick, N. Iacovou, M. Suchak, P. Bergstrom, and J. Riedl, “GroupLens : An Open Architecture for Collaborative Filtering of Netnews,” in Proceedings of the 1994 ACM conference on Computer supported cooperative work, 1994, pp. 175–186.
- J. A. Konstan, B. N. Miller, D. Maltz, J. L. Herlocker, L. R. Gordon, and J. Riedl, “GroupLens: applying collaborative filtering to Usenet news,” Commun. ACM, vol. 40, no. 3, pp. 77–87, 1997.
- H. J. Ahn, “A new similarity measure for collaborative filtering to alleviate the new user cold-starting problem,” Inf. Sci. (Ny)., vol. 178, no. 1, pp. 37–51, 2008.
- H. Liu, Z. Hu, A. Mian, H. Tian, and X. Zhu, “A new user similarity model to improve the accuracy of collaborative filtering,” Knowledge-Based Syst., vol. 56, pp. 156–166, 2014.
- J. Bobadilla, F. Serradilla, and J. Bernal, “A new collaborative filtering metric that improves the behavior of recommender systems,” Knowledge-Based Syst., vol. 23, no. 6, pp. 520–528, 2010.
- J. Bobadilla, F. Ortega, A. Hernando, and Á. Arroyo, “A balanced memory-based collaborative filtering similarity measure,” Int. J. Intell. Syst., vol. 27, no. 10, pp. 939–946, Oct. 2012.
- J. Bobadilla, F. Ortega, and A. Hernando, “A collaborative filtering similarity measure based on singularities,” Inf. Process. Manag., vol. 48, no. 2, pp. 204–217, 2012.
- J. Bobadilla, A. Hernando, F. Ortega, and A. Gutiérrez, “Collaborative filtering based on significances,” Inf. Sci. (Ny)., vol. 185, no. 1, pp. 1–17, 2012.
- J. Bobadilla, A. Hernando, F. Ortega, and J. Bernal, “A framework for collaborative filtering recommender systems,” Expert Syst. Appl., vol. 38, no. 12, pp. 14609–14623, 2011.
- B. K. Patra, R. Launonen, V. Ollikainen, and S. Nandi, “A new similarity measure using Bhattacharyya coefficient for collaborative filtering in sparse data,” Knowledge-Based Syst., vol. 82, pp. 163–177, 2015.
- V. Kumar and D. A. Shamma, “The Force Within : Recommendations Via Gravitational Att raction Between Items,” [UMAP2017]Proceedings 25th Conf. User Model. Adapt. Pers., pp. 294–297, 2017.
- N. Good et al., “Combining Collaborative Filtering with Personal Agents for Better Recommendations,” in Proceedings of the Sixteenth National Conference on Artificial Intelligence and the Eleventh Innovative Applications of Artificial Intelligence Conference Innovative Applications of Artificial Intelligence, 1999, pp. 439–446.
- F. Ricci, L. Rokach, B. Shapira, and P. B. Kantor, Recommender Systems Handbook, 1st ed. Berlin, Heidelberg: Springer-Verlag, 2010.
- P. Jaccard, “Distribution comparée de la flore alpine dans quelques régions des Alpes occidentales et orientales,” Bull. la Socit Vaudoise des Sci. Nat., vol. 37, pp. 241–272, 1901.
- S. Kosub, “A note on the triangle inequality for the Jaccard distance,” no. 1, pp. 1–5, 2016.
- J. L. Herlocker, J. A. Konstan, L. G. Terveen, and J. T. Riedl, “Evaluating collaborative filtering recommender systems,” ACM Trans. Inf. Syst., vol. 22, no. 1, pp. 5–53, 2004.
- “MovieLens | GroupLens.” [Online]. Available: https://grouplens.org/datasets/movielens/. [Accessed: 22-Dec-2018].
- F. M. Harper and J. A. Konstan, “The MovieLens Datasets,” ACM Trans. Interact. Intell. Syst., vol. 5, no. 4, pp. 1–19, 2015.
- “Apache Mahout.” [Online]. Available: https://mahout.apache.org/. [Accessed: 22-Dec-2018].
- S. Owen, R. Anil, T. Dunning, and E. Friedman, Mahout in Action. Greenwich, CT, USA: Manning Publications Co., 2011.
