A Novel Circular Mapping Technique for Spectral Classification of Exons and Introns in Human DNA Sequences

Author: Mohammed Abo-Zahhad, Sabah M. Ahmed, Shimaa A. Abd-Elrahman
Journal: International Journal of Information Technology and Computer Science(IJITCS) @ijitcs
Article in issue: 4 Vol. 6, 2014.
Free access
Signals that represent information may be classified into two forms: numeric and symbolic. Symbolic signals such as DNA symbolic sequences cannot be directly processed with digital signal processing (DSP) techniques. The only way to apply DSP in genomic field is the mapping of DNA symbolic sequences to numerical sequences. Hence, biological properties are reflected in a numerical domain. This opens a field to present a set of tools for solving genomic problems. In literature many techniques have been developed for numerical representation of DNA sequences. The main drawback of these techniques is that each nucleotide is represented by a numerical value depending on nucleotide type only ignoring its position in codon and DNA sequence. In this paper a new approach for DNA symbolic to numeric representation called Circular Mapping (CM) is introduced. It’s based on graphical representation of DNA sequence that maps each nucleotide by a complex numerical value depending not only on nucleotide type but also on its position in codons. The main applications of this method are the gene prediction that aims to locate the protein-coding regions and the classification of exons and introns in DNA sequences. The proposed approach showed significant improvement in exons and introns classification as compared with the existing techniques. The efficiency of this method in classification depends on the right choice of the mapping angle (θ) as indicated by the power spectral analysis results over the sequences of the human genome (GRch37/hg19).
Genome, Codon, Exons, Introns, DNA sequence, Circular Mapping
Short address: https://sciup.org/15012066
IDR: 15012066
Text of the scientific article A Novel Circular Mapping Technique for Spectral Classification of Exons and Introns in Human DNA Sequences
Published Online March 2014 in MECS
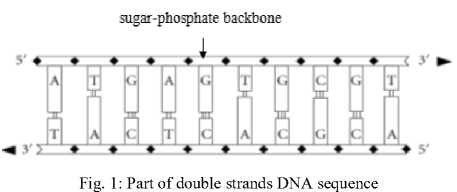
A single strand of DNA is a biomolecule consisting of many linked, smaller components called nucleotides. Each nucleotide is one of four possible types designated by the letters A, T, C, and G. The order of these bases in a gene determines the genetic variation, living, habits and nature of species. Moreover, DNA sequence has two distinct ends, the 5′ end and the 3′ end; as shown in Fig. 1. The 5′ end of a nucleotide is linked to the 3′ end of another nucleotide by a strong chemical bond, thus forming a long, one- dimensional chain (backbone) of a specific directionality [1]. Fig. 1 illustrates part of the DNA double strand DNA sequence.
A protein is also a biomolecule consisting of many linked, smaller components called amino acids. There are 20 possible types of amino acids in proteins and, just as the case in DNA single strands; they are connected with strong bonds, one after the other forming a long one-dimensional chain (backbone) of a specific directionality. Protein synthesis is governed by the genetic code which maps each of the 64 possible triplets (codons) of DNA characters into one of the 20 possible amino acids (or into a punctuation mark, like a stop codon, signaling termination of protein synthesis). As shown in Table 1, the 20 amino acids are indicated by both their one-letter and three-letters symbols. The codon ATG, serves as the START codon and it also codes for the M (methionine) amino acid; where methionine appears as the first amino acid of proteins, but it may also appear in other locations. The complete set of the 20 amino acids and the terminator codons (indicated by serial number 0 in the first row) are included in Table 2. It should be noticed that the first row (shaded row) in this table is not coded as amino acid, but it is a gene end terminator. Also, the thirteenth row (shaded row) represents the ATG amino acid or a gene start.
The DNA contains chromosomes that are blend of genic and intergenic regions as shown in figure 2. The exonic regions exhibit period three property that is not found in intergenic regions. This periodicity is a result of repeated identical nucleotides in identical triplet (codon) positions in these regions. This can be indicated by considering the periodic sequence C - - C - - C - - C - - …, where the blanks ‘-’ can be filled randomly by any one of the four bases A, T, C or G. This sequence gives a periodicity of three due to the repetition of base C at position 1 in each codon. Due to this property of exons, protein coding regions can be predicted and this helps in better identification of these regions. In fact the genetic information is stored in DNA as symbolic sequence. If we properly map a character string into one or more numerical sequences, then DSP provides a set of tools for solving problems in genomic field and reflect the biological properties in a numerical domain which helps to detect three periodicity regions in DNA sequence.
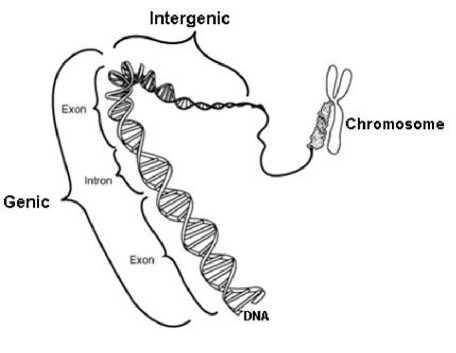
Fig. 2: Eukaryotic DNA consists of genic and intergenic regions
Table 1: Genetic code
|
Second position in codon |
|||||||||||||||
|
T |
C |
A |
G |
||||||||||||
|
TTT |
Phe |
[F] |
TCT |
Ser |
[S] |
TAT |
Tyr |
[Y] |
TGT |
Cys |
[C] |
T |
|||
|
T |
TTC |
Phe |
[F] |
TCC |
Ser |
[S] |
TAC |
Tyr |
[Y] |
TGC |
Cys |
[C] |
C |
||
|
TTA |
Leu |
[L] |
TCA |
Ser |
[S] |
TAA |
Ter |
[stop] |
TGA |
Ter |
[stop] |
A |
|||
|
TTG |
Leu |
[L] |
TCG |
Ser |
[S] |
TAG |
Ter |
[stop] |
TGG |
Trp |
[W] |
G |
|||
|
CTT |
Leu |
[L] |
CCT |
Pro |
[P] |
CAT |
His |
[H] |
CGT |
Arg |
[R] |
T |
|||
|
й о "О о о б й .о о Рч |
C |
CTC CTA |
Leu Leu |
[L] [L] |
CCC CCA |
Pro Pro |
[P] [P] |
CAC CAA |
His Gln |
[H] [Q] |
CGC CGA |
Arg Arg |
[R] [R] |
C A |
й "8 о о ,й й .о о Рч ^ н |
|
CTG |
Leu |
[L] |
CCG |
Pro |
[P] |
CAG |
Gln |
[Q] |
CGG |
Arg |
[R] |
G |
|||
|
ATT |
Ile |
[I] |
ACT |
Thr |
[T] |
AAT |
Asn |
[N] |
AGT |
Ser |
[S] |
T |
|||
|
A |
ATC |
Ile |
[I] |
ACC |
Thr |
[T] |
AAC |
Asn |
[N] |
AGC |
Ser |
[S] |
C |
||
|
ATA |
Ile |
[I] |
ACA |
Thr |
[T] |
AAA |
Lys |
[K] |
AGA |
Arg |
[R] |
A |
|||
|
ATG |
Met |
[M] |
ACG |
Thr |
[T] |
AAG |
Lys |
[K] |
AGG |
Arg |
[R] |
G |
|||
|
GTT |
Val |
[V] |
GCT |
Ala |
[A] |
GAT |
Asp |
[D] |
GGT |
Gly |
[G] |
T |
|||
|
G |
GTC |
Val |
[V] |
GCC |
Ala |
[A] |
GAC |
Asp |
[D] |
GGC |
Gly |
[G] |
C |
||
|
GTA |
Val |
[V] |
GCA |
Ala |
[A] |
GAA |
Glu |
[E] |
GGA |
Gly |
[G] |
A |
|||
|
GTG |
Val |
[V] |
GCG |
Ala |
[A] |
GAG |
Glu |
[E] |
GGG |
Gly |
[G] |
G |
|||
The paper is organized as follows. Section I presents this introduction. Section II introduces the existing numerical representation methods of DNA sequences which are broadly classified into two major groups:
Fixed Mapping (FM) techniques and Physico-Chemical Property Based Mapping (PCPBM) techniques. Section III introduces the main applications of the existing numerical representation methods. Section IV introduces a new develop method called Circular Mapping to overcome the drawbacks of the existing methods for representing the nucleotide, where position of each nucleotide is taken in consideration. Sections V and VI describe the results and discussion of using CM for exons and introns classification in genomic sequences as compared with the existing methods. Finally, section VII concludes the paper.
Table 2: Codons and amino acids symbols
|
Serial number |
Codons representation |
Amino acid long name |
Amino acid short name |
Symbol |
|
0 |
TAA, TAG, TGA |
Terminator |
Ter |
[end] |
|
1 |
TTT, TTC |
Phenylalanine |
Phe |
[F] |
|
2 |
TTA, TTG, CTT, CTC, CTA, CTG |
Leucine |
Leu |
[L] |
|
3 |
TCT, TCC, TCA, TCG, AGT, AGC |
Serine |
Ser |
[S] |
|
4 |
TAT, TAC |
Tyrosine |
Tyr |
[Y] |
|
5 |
TGT, TGC |
Cysteine |
Cys |
[C] |
|
6 |
TGG |
Tryptophan |
Trp |
[W] |
|
7 |
CCT, CCC, CCA, CCG |
Proline |
Pro |
[P] |
|
8 |
CAT, CAC |
Histidine |
His |
[H] |
|
9 |
CAA, CAG |
Glutamine |
Gln |
[Q] |
|
10 |
CGT, CGC, CGA, CGG, AGA, AGG |
Arginine |
Arg |
[R] |
|
11 |
ATT, ATC, ATA |
Isoleucine |
Ile |
[I] |
|
12 |
ATG |
Methionine |
Met |
[M] |
|
13 |
ACT, ACC, ACA, ACG |
Thereonine |
Thr |
[T] |
|
14 |
AAT, AAC |
Asparagine |
Asn |
[N] |
|
15 |
AAA, AAG |
Lysine |
Lys |
[K] |
|
16 |
GTT, GTC, GTA, GTG |
Valine |
Val |
[V] |
|
17 |
GCT, GCC, GCA, GCG |
Alanine |
Ala |
[A] |
|
18 |
GAT, GAC |
Aspartic acid |
Asp |
[D] |
|
19 |
GAA, GAG |
Glutamic Acid |
Glu |
[E] |
|
20 |
GGT, GGC, GGA, GGG |
Glycine |
Gly |
[G] |
-
II. Existing Mapping Techniques of DNA Sequence
-
2.1 Fixed Mapping Techniques
In literature [1] – [15], many different approaches have been proposed to address gene prediction as well as exons and introns classification problems. Existing numerical representation methods of DNA sequences can be broadly classified into two major groups: FM techniques [4] – [10] and PCPBM techniques [1], [11] – [15]
In FM techniques, the nucleotides of DNA data are transformed into a series of arbitrary numerical sequences. In general FM techniques include;
-
• Voss representation technique [5]: It is an efficient method in detecting the coding and non-coding regions in a DNA sequences. Where, it maps the nucleotides A, C, T, and G into the four binary indicator sequences xA(n) , x c(n) , x G(n) , and
xT(n)showing the presence (e.g., 1) or absence (e.g., 0) of the respective nucleotides as shown in the following example.
|
DNA Sequence : |
…… T |
T |
G |
T |
C |
A |
C |
T |
C |
G |
G… |
|
xл00 : |
…… 0 |
0 |
0 |
0 |
0 |
1 |
0 |
0 |
0 |
0 |
0 … |
|
x c 00 : |
…… 0 |
0 |
0 |
0 |
1 |
0 |
1 |
0 |
1 |
0 |
0 … |
|
x G 00 : |
…… 0 |
0 |
1 |
0 |
0 |
0 |
0 |
0 |
0 |
1 |
1 … |
|
xt (n) : |
…… 1 |
1 |
0 |
1 |
0 |
0 |
0 |
1 |
0 |
0 |
0 … |
• Tetrahedron representation technique [6]: It reduces Voss mapping) to three in a manner symmetric to all the number of indicator sequences from four (i.e. four components. In this method the four sequences
хд(n), х c (n), x c (n), and xT(n) are mapped to four 3- dimensional vectors pointing from the center to the vertices of a regular tetrahedron. Thus, the final tetrahedral sequences are calculated from (1) – (3).
The Voss and tetrahedron representations are equivalent representations for the purpose of power spectrum computation, but obtaining DNA spectrograms of bimolecular sequences is the main application of this method.
xr(n) = — (2xT(n) - xc(n) - x6(n))
-
x, (n) = ^(xcW-xtO.))
,, 1,.......
xb(n) = 3 (3xA(n) - XT()) - xc(n)^
-
- x gOO)
-
• Complex representation technique [6]: It reduces the dimensionality of the tetrahedral representation to two by projecting the basic tetrahedron on a complex plane. It reflects the complementary nature of A-T and C- G pairs as A= 1 + j , C = - 1 + j , G = - 1 - j , and T = 1 - j.
-
• Integer representation technique [7]: It is a onedimensional (1-D) mapping of the DNA bases which can be obtained by mapping numerals {0, 1, 2, 3} to the four nucleotides as: T=0, C=1, A=2, and G=3. This method has some mathematical properties which does not exist in a base sequence. Hence its DSP applications are limited suggesting that these integer mappings need to be used carefully for a given application.
-
• Real number technique [8]: It represents A by -1.5, T by 1.5, C by 0.5, and G by -0.5. The assignment of a real number to each of the four bases does not necessarily reflect the structure present in a DNA sequence. In the computation of correlations, real representations are preferred over complex representations.
-
• Quaternion technique [9]: It assigns pure quaternions to each base: A= i + j + к, C= i - j - к, G= -i - j + к , and T= -i + j - к . This method of mapping can be used to compute the 3-periodicity in DNA sequences. It has been often observed that the occurrence of repetitive structures (or tandem repeats) in genomic data is symptomatic of biological phenomena. Perhaps the best known example of this association is the 3-base repetition of codons, which is characteristic of protein coding regions in DNA sequences of eukaryotic cells.
-
• Inter-nucleotide distance technique [10]: It represents each DNA nucleotide (i.e., A, C, G, or T) with a number representing the distance between the current nucleotide and the next similar nucleotide. While scanning the sequence from left to right, if a similar
-
2.2 Physico Chemical Property Based Mapping Techniques
nucleotide is not found, the sequence value of the current nucleotide is the length of the remaining sequence. For example, for the DNA sequence x[n] = AGTTCTACCGAGC, the inter-nucleotide distance sequence would be:
ind [n] = {6,8, 1, 2, 3,7,4,1,4,2, 2, 1,0}.
In PCPBM techniques, biophysical and biochemical properties of DNA biomolecules are used for DNA sequence mapping [4]. So they can be used in searching for biological principles and structures in biomolecules. In general these techniques include:
-
• Electron-Ion Interaction Potential (EIIP) mapping techniqu e [11]: It represents the distribution of the free electrons’ energies along the DNA sequence. EIIP indicator sequence is formed by substituting the EIIP of the nucleotides A=0.1260, C=0.1340, G=0.0806, and T=0.1335 in a DNA sequence. This method may be used as a coding measure to detect probable coding regions in DNA sequences.
-
• Atomic number mapping technique [12]: In this method a single atomic number indicator sequence is formed by assigning the atomic number in each nucleotide as: A=70, C=58, G=78 and T=66 in a DNA sequence. Its DSP applications are also limited as integer representation.
-
• Paired numeric mapping technique [1]: In this technique nucleotides (A-T, C-G) are to be paired in a complementary manner and values of +1 and -1 are to be used respectively to denote A-T and C-G nucleotide pairs. This representation incorporates a very useful DNA structural property, in addition to reducing complexity.
-
• DNA walk mapping technique [13]: It is a graphical representation of DNA sequences that helps to study the scale-invariant long-range correlations of a DNA sequence, a step is taken upwards (+1) if the nucleotide is pyrimidine (C or T) or downwards (-1) if it is purine (A or G). The DNA walk allows one to visualize directly the fluctuations of the purine -pyrimidine content in DNA sequences. It is providing long range correlation information; sequence periodicities; changes in nucleotide composition; offering numerical and graphical visualization.
-
• Z-curve mapping technique [14]: It is a 3-D curve that provides a unique representation for visualization and analysis of a DNA sequence. This representation has been also employed for gene identification and DNA protein coding measure. It converts the DNA sequence into an equivalent three dimensional representation based on the symmetry of the regular tetrahedrons. In order to generate Z-curve sequences, the DNA sequence is first converted into four binary
indicator sequences Хд (n), хс (n), XG (n ) , and Xy (n) by Voss mapping, then the cumulative numbers of the DNA bases for n samples are then calculated using:
I
=
n
∑ Xl [ i ],
1=0
I ∈ { A , C , G , T }
analysis of DNA sequences using wavelet based time series approach for extracting statistical information from DNA sequences. The extracted information contains the variance information of amino/keto, purine/pyrimidine and weak/strong hydrogen bond distribution in a DNA sequence.
The four cumulative sequences A n,Cn, Gn, and T are in turn used to define three Z-curve sequences x n,yn , and z n as follow s [15]:
xn = 2[^n - ^n-1 + ^n - ^n-1]-1,
Уп = 2[^n - ^n-1 + Cn - Cn-1]-1,
Zn =2[ ■^n - + ^n - ^n-1]-1.
-
III. Gene Prediction using Existing Mapping Techniques
Gene prediction which refers to locating the proteincoding regions (exons) of genes in a long DNA sequence is the main problem in genomic field. Many different approaches [16] - [20] have been developed to address this open problem but still a better optimized solution is essential. Kakumani and Devabhaktuni [16], presented a model-based exon detection approach using statistically optimal null filter. In [15] a model of the period-3 characteristic is employed to maximize signal-to-noise ratio, using least-squares optimization criteria to rapidly detect the presence of exons in DNA sequences. Akhtar et al. [17], investigated the effect of window length on selected signal processing-based gene and exon prediction methods. They optimize these methods to improve the prediction accuracy by employing the best DNA representation, selecting a suitable window length, and boosting the output signals to enhance protein coding and suppress non-coding regions. Hota and Srivastavan [18] observed that complex indicator sequence provides strong spectral component compared to EIIP indicator sequence. They also observed that windowed Discrete Fourier Transform (DFT) considering complex indicator sequence provides better exon prediction compared to windowed DFT considering EIIP indicator sequence and digital filters methods. Computational overhead is reduced by 75% in complex indicator sequence compared to binary indicator sequence. Grandhi and Kumar [19], proposed a new lower dimensional mapping ( 2-simplex mapping method ) by assigning the nucleotides to the three corners and one center of a triangle which reduces the computational complexity by half, producing results nearly equal to those produced by a higher dimensional mapping. Gupta et al. [20], presented a novel and generic approach for the
-
IV. Proposed Circular Mapping Approach
In this section a new numerical representation technique for DNA sequence is introduced. In this technique each nucleotide (A, T, C, or G) is represented by a complex numerical value according to nucleotide’s type and its position in codons along the DNA sequence. All values that represent nucleotides are located on circle so that a Circular Mapping of the bases is obtained. This method has many applications but exons and introns classification problem is only considered here. The efficiency of this method in exons and introns classification depends on the correct choice of an angle (θ) between the three positions of nucleotides in codon and the correct arrangement of the four nucleotides around space as will be explained in details in the following paragraphs. All codons are represented on a circle with radius “r”. Although “r” can be any value, it will be considered here one for simplicity.
The space of the circle is divided into four regions; one quarter for each nucleotide. For example, the A, C, G, and T nucleotides are placed in the first, second, third and fourth quadrants respectively as shown in Fig. 3. In fact, this is one possible choice and other arrangements can be adopted by placing the four nucleotides in different quadrants. It should be noticed that, the nucleotides arrangement is the first parameter that affects the precision of exons and introns classification. After selecting the prober arrangement, each nucleotide is placed in one of the three possible positions inside the corresponding quadrant. Thus a total of 12 positions, three for each one of the four nucleotides (A, T, C, or G) are possible. For example, nucleotide “A” (it may be any other nucleotide depending on chosen arrangement) has the three possible positions separated by angle “θ” as shown in figure 4. Where the nucleotide “A” is located in the first position if the codon starts by “A”, in the third position if the codon ends by “A” and is located in the second position if it is in the middle of the codon. The angle (θ) is the second parameter that affects the precision of exons and introns classification. To facilitate understanding the CM method, an example of one codon (three nucleotides) is considered, the positions of the four nucleotides inside the four quarters for the codon “CAT” is shown in figure 5.
Referring to figure 5 it can be deduced that, the three positions only represent each codon on circle and the complex numerical values that represent the four nucleotides can be determined from the following equations.
A(m) = г {cos(^ - 9 + f) + i sin(^ - 9 + f} (8)
C( m) = r {c ss(^ -9 )+f ) + i s in(^ - 9 + f] (9)
G( m) = r {cos(^ -9)+f ) + i s tn^ - 9) +
f )
T(m) = r {co s(y -9)+f) + i si n(y - 9) + f} (11)
Where, f = (m - 1) 9;
-
"m" = 1, 2, 3 denotes the first, second, and third positions in codon;
-
"9" is the angle between the vector directed from the circle origin to the second position and the two other vectors directed from the origin to the first and third positions of nucleotides in codon as shown in figure 4; and
-
" r" is the radius of the circle (assumed constant value).
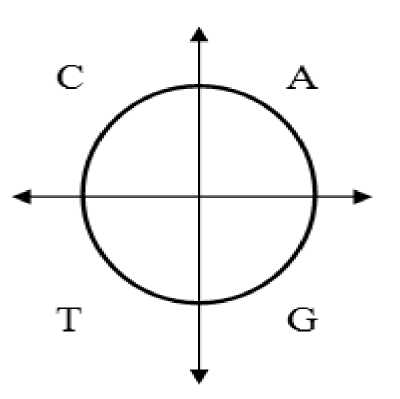
Fig. 3: Nucleotide placement on circle space
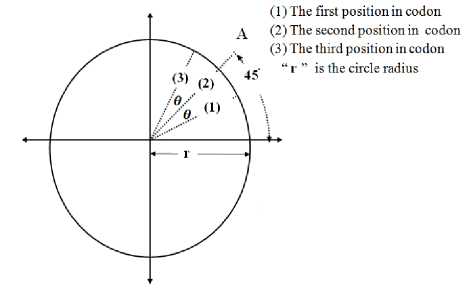
Fig. 4: The three possible positions of nucleotide “A” inside the first quadrant
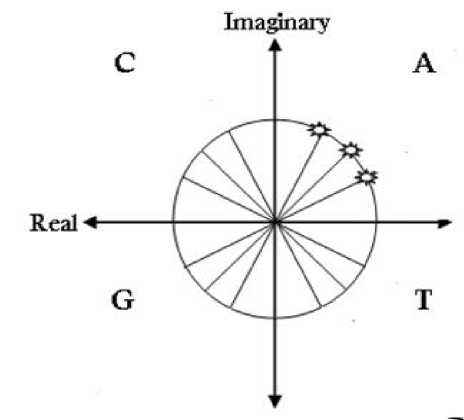
Fig. 5: Circular representation of the “AAA” codon
Representing any nucleotide by this method requires knowing the type of the nucleotide (A, T, C, or G) and its position inside the codon. The type of the nucleotide determines which quadrant the nucleotide belongs to and the choice of one of the three positions inside quadrants depends on the position of the nucleotide inside the codon. The same is applied to all nucleotides in the DNA sequence and the final numerical sequence can be used in exons and intron classification.
Table 3: The all possible 12 arrangements and their equivalents ( Qi denotes the ith Quadrant )
|
Arrangement number |
Arrangement |
Possible positions |
Equivalent arrangement |
|||
|
Q 1 |
Q 2 |
Q 3 |
Q 4 |
|||
|
1 |
ACTG |
A |
C |
T |
G |
TGAC |
|
2 |
ACGT |
A |
C |
G |
T |
GTAC |
|
3 |
AGCT |
A |
G |
C |
T |
CTAG |
|
4 |
AGTC |
A |
G |
T |
C |
TCAG |
|
5 |
ATGC |
A |
T |
G |
C |
GCAT |
|
6 |
ATCG |
A |
T |
C |
G |
CGAT |
|
7 |
CATG |
C |
A |
T |
G |
TGCA |
|
8 |
CAGT |
C |
A |
G |
T |
GTCA |
|
9 |
CGTA |
C |
G |
T |
A |
TACG |
|
10 |
CTGA |
C |
T |
G |
A |
GACT |
|
11 |
TAGC |
T |
A |
G |
C |
GCTA |
|
12 |
TCGA |
T |
C |
G |
A |
GATC |
The best choice of the angle (9) and the selection of the proper arrangement of nucleotides for the circular mapping numerical representation are the most important parameters that have great effects on the precision of exons and introns classification. For the four quadrants and the three possible positions of the nucleotides, 24 possible arrangements exit as illustrated in Table 3. From (8) – (11), it should be noted that when the nucleotide position is rotated by 1800 (i.e., when a certain nucleotide rotated from the first, second, third, and fourth positions to third, fourth, first, second positions respectively) the same numerical mapping results. For example, the AGTC arrangement has the same numerical mapping as the TCAG arrangement. As a result, for each arrangement there exists an equivalent arrangement as shown in the last column of Table 3. So, the number of possible arrangements is reduced from 24 to 12 arrangements. In addition to the selection of the prober arrangement, the angle (θ) also has an effect on the exons and introns classification; where 0 < θ < 450.
-
V. Results and Discussions
To investigate the efficiency of the CM technique in exons and introns classification, the dependence of classification accuracy on the nucleotides arrangements and the value of the angle θ have been investigated. For this propose, θ is varied from 1o to 44o with 1o step and all the twelve possible arrangements are considered. As a result, 528 possible θ values will be considered. Moreover, the period-3 property for the DNA sequences has been adopted.
The period-3 property of the L- length DNA sequence implies that the discrete Fourier transform (DFT) coefficients corresponding to frequency L/3 is large. This property is related to the different statistical distributions of codons between protein-coding and non-coding DNA sections. So, 3-periodicty is used as a basis for identifying the coding and non-coding regions. The considered DNA sequence is first converted to numerical values using the proposed CM technique and then discrete Fourier transform (DFT) based approach is adopted to extract the period-3 value of DNA sequences. The finite-length DFT sequence, X[k] for k = 1 to N for a numerically represented DNA sequence x(n) for n =1 to N is defined by [21].
N
X [ к ]= 1 ∑ x ( n ) W, ( и )( ),
√
- ;2тг for 1≤к≤ N and И/jv =
Using the windowing approach with a rectangular window length of L bases and an overlap width of L-3 bases between two adjacent windows, the normalized sum (X т [k] ) of the DFT spectrum (X m[k]) of each of the windowed sequences (x m (n) for m = 1 to N ) gives
Nw
XT [ к ]= 1∑ ^m [ к ] (13)
m=l
Where, N is the number of shifted windows. The spectral content measure can be obtained by calculating the power spectrum of (13) as
s[ к ] = | XT [ к ]|2 (14)
The period-3 spectral component (P3 ) can be obtained from the power spectral content measure of a numerically represented sequence as p, =[N⁄3 +1] (15)
The statistics of the period-3 values determined from a training set of exon sequences and intron sequences can be used to classify an untrained sequence to be either an exon sequence or an intron sequence. For this purpose let meanPBe and sdPBe represent respectively the mean and standard deviation of the period-3 values obtained from the exon sequences of a training set; and meanP3 j and sdP3 j represent respectively the mean and standard deviation of the period-3 values obtained from the intron sequences of the same training set. Consequently, the threshold value for classification is defined as [21].
T3
sdP3e ∗ meanP3i + sdP3i ∗ meanP3e sdP3e + sdP3i
Using (16), if a test sequence has a period-3 value P3t greater than or equal toTз , the test sequence is classified as an exon sequence; otherwise it is classified as an intron sequence. Here the circular mapping is adopted for exons and introns classifications. The exons classification (EXCLASS), introns classification (INCLASS) and the precision value are evaluated by the following three equations [22];
EXCLASS
NCEC
:---------------------------------------------------------------
Exon number
100 %
INCLASS = ×100 %
Intron number
_ . . NCEC+ NCIC лzi rw
Precision = × 100%
TEIN
Where, NCEC, NCIC and TEIN are the number of correct exons and the number of correct introns classifications and the total number of exons and introns respectively.
Equations (13) - (19) are applied to training and testing sequences downloaded from USCS Assembly database: Feb. 2009 (GRCh37/hg19) (Clade: Mammal, Genome: Human, Assembly: Feb.2009 (GRCh37/hg19), Group: Genes and Gene rediction Tracks, Track: UCSC Genes, Table: knownGene) [23] – [26]. Sequences that are used for training and testing to determine the best angle and arrangement are consisted of a total of 4000 Exon sequences; sequences 1 to 3000 are used for training and sequences 3001 to 4000 are used for testing; and a total of 4000 Intron sequences; sequences 1 to 3000 are used for training and sequences 3001 to 4000 are used
A Novel Circular Mapping Technique for
Spectral Classification of Exons and Introns in Human DNA Sequences for testing. Figure 6(a) and figure 6(b) show the precision of the twelve arrangements at 44 different angles with a window length of 15 bases and an overlap window length of 12 bases for DNA sequences with lengths 100 and 500 base pairs (bp). For best exon and intron recognition, the precision should be maximized by varying the angle (θ) for certain arrangement. For the ATCG arrangement, the maximum precision has been obtained at the angle (θop = 0.267o). This value has been determined using the Matlab optimization tool box. The resulting CM numerical representations for A, T, C, and G nucleotides are obtained from (1) – (4) with θ =0.267o and arrangement ATCG; as illustrated in Table 4. These values will be adopted in exon and intron recognition in the following section.
Table 4: The nucleotide values for circular mapping (α1, α 2, α3 denotes first, second, and third position in codon, α =A, C, G, or T.
|
Nucleotide ( α ) |
Values of nucleotide in numerical sequence |
||
|
Value of nucleotide in the first position in codon (α1) |
Value of nucleotide in the second position in codon (α2) |
Value of nucleotide in the third position in codon (α3) |
|
|
A |
0.7104 + 0.7038i |
0.7071 + 0.7071i |
0.7038 + 0.7104i |
|
T |
-0.7104 + 0.7038i |
-0.7071 + 0.7071i |
-0.7038 + 0.7104i |
|
C |
-0.7104 - 0.7038i |
-0.7071 - 0.7071i |
-0.7038 - 0.7104i |
|
G |
0.7104 - 0.7038i |
0.7071 - 0.7071i |
0.7038 - 0.7104i |
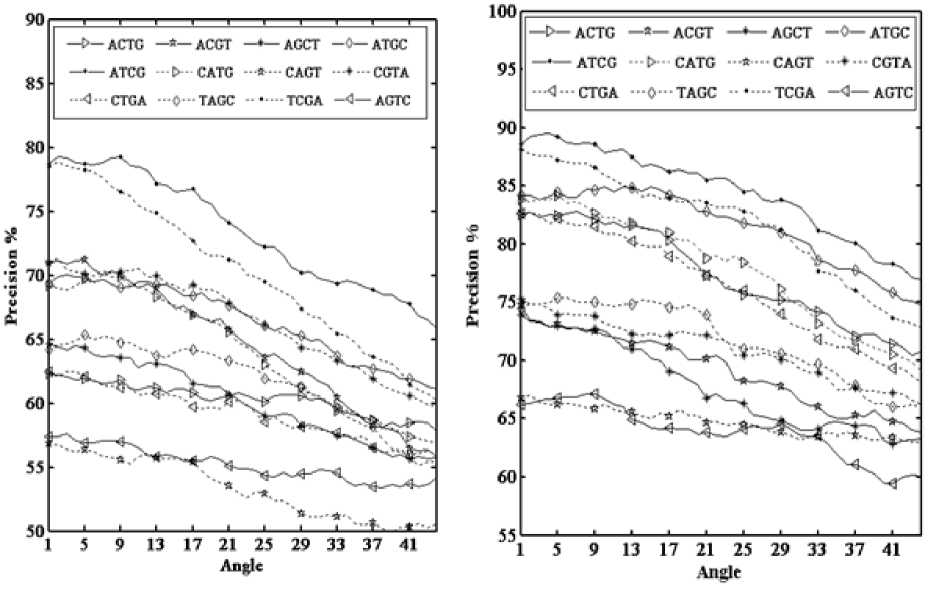
(a)
(b)
Fig. 6: The precision of a DNA sequence with different sequence lengths. (a) 100 base pairs sequence length and (b) 500 base pairs sequence length
-
VI. Comparison between the Proposed CM Technique and the Existing Techniques
In this section seven existing DNA numerical representation techniques are compared with the proposed CM method [1], [6] - [8], [11] - [13]. The comparison is based on the period-3 property for the purpose of exons and introns classification. This has been carried out by applying (18) - (19) on training and testing sequences with different intron and exon lengths range from minimum length 50bp to maximum length 500bp. The base sequences are downloaded from USCS Assembly [23] - [26]. The sequences that are used for training and testing consist of 4000 sequence for each exon and inron sequences. By using 10-fold crossvalidation the data is first partitioned into 10 equally sized segments or folds (each group consist of 400 sequences). Subsequently 10 iterations of training and validation are performed such that within each iteration a different fold of the data is held-out for validation, while the remaining “9” folds are used for training. . The precision defined by (19) has been used as a performance measure. The final results of measuring classification performances of all the seven existing numerical representation and the proposed method are summarized in Table 5. Window length of 15 bases and an overlap window length of 12 bases are used to obtain these results.
Table 5: Exons and introns classification performance by different methods
|
Method |
Representation |
Precision (%) when using 10-fold cross validation |
Average |
|||||||||
|
F1 |
F2 |
F3 |
F4 |
F5 |
F6 |
F7 |
F8 |
F9 |
F10 |
|||
|
Intege r [7] |
A=2, C=1, G=3, T=0 |
66.1 |
86.5 |
74.1 |
82.5 |
80.9 |
90.3 |
75.8 |
76.6 |
75.9 |
92.6 |
80.1 |
|
A=0, C=1, G=3, T=2 |
72.9 |
84.4 |
71 |
74.1 |
79.5 |
91.9 |
76.6 |
79.9 |
77.4 |
91.1 |
79.9 |
|
|
Real [8] |
A = -1.5, C = 0.5, G = -0.5, T = 1.5 |
62.1 |
75.6 |
58.8 |
70.6 |
78.9 |
83.5 |
79.8 |
75.3 |
65.1 |
97.8 |
74.7 |
|
Complex [6] |
A =1+ j, C = -1+ j, G = -1- j, T = 1 - j |
74.6 |
85.4 |
82 |
82.1 |
89.5 |
91.1 |
78 |
81.3 |
84.8 |
98 |
84.7 |
|
EII P [11] |
A=0.1260, C=0.1340, G=0.0806, T=0.1335 |
72.3 |
81.9 |
75.4 |
72.8 |
84 |
93.5 |
81.9 |
85.9 |
80.3 |
96.1 |
82.4 |
|
Atomic numbe r [12] |
A=70, C=58, G=78, T=66 |
67.5 |
73.4 |
69 |
70.5 |
75.5 |
79.6 |
73.4 |
73.4 |
59.5 |
93.4 |
73.5 |
|
Paired Numeric [1] |
A or T = 1, C or G = -1 |
77.5 |
88.4 |
80.6 |
84.4 |
92.1 |
95.3 |
84.3 |
82 |
91.5 |
97.6 |
87.4 |
|
DNA wal k [13] |
C or T = 1, Aor G = -1 |
62.5 |
76 |
63.9 |
75 |
79.1 |
82.8 |
79.3 |
73.5 |
62.9 |
97.8 |
75.3 |
|
Proposed CM |
A, C, T and G are evaluated using (8) – (11). |
80.6 |
90.4 |
81.4 |
85.3 |
93.8 |
91.9 |
89.5 |
81.8 |
87 |
98.4 |
88 |
-
VII. Conclusion
A novel CM method for exons and introns classification is introduced in this paper. It is a graphical representation for DNA sequence that maps each nucleotide by a complex numerical value depending not only on type but also on its position in codons. Therefore, it overcomes the drawbacks of the existing mapping methods. The proposed approach showed significant improvement in exons and introns classification as compared with the existing techniques.
The efficiency of this method in exons and introns classification depends on the right choice of angle (θ) between the vector directed from the circle origin to the second position and the two other vectors directed from the origin to the first and third positions of nucleotides in codon and also depends on the chosen arrangement of the four nucleotides around space as indicated by results from the power spectral analysis over human genome download from USCS Assembly: Feb. 2009 (GRCh37/hg19). The analysis revealed that ATCG arrangement gives the highest precision compared with other methods.
References A Novel Circular Mapping Technique for Spectral Classification of Exons and Introns in Human DNA Sequences
- D. Anastassiou. Genomic signal processing [M]. IEEE Signal Processing Magazine, 2001, 18: 8–20.
- M. Akhtar, Julien Epps, and E. Ambikairajah. Signal Processing in Sequence Analysis: Advances in Eukaryotic Gene Prediction [J].IEEE Journal of selected topics in signal processing, June 2008, 2: 310 – 321.
- M. Abo-Zahhad, S. M. Ahmed and Sh. A. Abd-Elrahman. Genomic Analysis and Classification of Exon and Intron Sequences Using DNA Numerical Mapping Techniques [J]. I.J. Information Technology and Computer Science (IJITCS), July 2012, 4: 22-36.
- H. K. Kwan and S. B. Arniker. numerical representation of DNA sequences, Electro/Information Technology [C]. 2009. eit '09. IEEE International Conference , Windsor, 2009 307-310.
- R. F. Voss. Evolution of long-range fractal correlations and 1/f noise in DNA base sequences. Phys. Rev. Lett., 1992, 68: 3805–3808.
- P. D. Cristea. Conversion of nucleotides sequences into genomic signals [J]. J. Cell. Mol. Med., April-June 2002, 6:279-303.
- P. D. Cristea. Genetic signal representation and analysis [C]. in Proc. SPIE Inf. Conf. Biomedical Optics, 2002, 77–84.
- N. Chakravarthy, A. Spanias, L. D. Lasemidis, and K. Tsakalis. Autoregressive modeling and feature analysis of DNA sequences [J]. EURASIP Journal of Genomic Signal Processing, January 2004, 1: 13-28.
- M. Akhtar, J. Epps, and E. Ambikairajah. On DNA numerical representations for period-3 based exon prediction [A]. in Proc. of IEEE Workshop on Genomic Signal Processing and Statistics (GENSIPS), June 2007, 1-4.
- A. S. S. Nair and T. Mahalakshmi. Visualization of genomic data using internucleotide distance signals [C]. in Proc. IEEE Inter. Conf. on Genomic Signal Processing, 2005.
- Achuthsankar S. Nair and Sreenadhan S. Pillai. A coding measure scheme employing electron-ion interaction pseudo potential (EIIP) [J]. Bioinformation, October 2006, 1:197-202.
- Todd Holden, R. Subramaniam, R. Sullivan, E. Cheng, C. Sneider, G.Tremberger, Jr. A. Flamholz, D. H. Leiberman, and T. D. Cheung. ATCG nucleotide fluctuation of Deinococcus radiodurans radiation genes. in Proc. of Society of Photo-Optical Nature , San Diego, CA, USA, 356 (1992) 168.
- C.-K. Peng, S.V. Buldyrev, A.L. Goldberger, S. Havlin, F. Sciortino, M. Simons, H.E. Stanley, A.L. Goldberger, S. Havlin, C.-K. Peng, H.E. Stanley, G.M. Viswanathan, Analysis of DNA sequences using methods of statistical physics. Physica A, Elsevier Science B.V, 1998, 249: 430-438.
- R. Zhang and C. T. Zhang, Z curves. An Intuitive Tool, for Visualizing and Analyzing the DNA sequences [J]. J. BioMol. Struct. Dyn, 1994, 11: 767-782.
- M. Yan, Z. S. Lin, and C. T. Zhang. A new Fourier transform approach for protein coding measure based on the format of Z curve [J]. Bioinformatics, 1998, 14: 685–690.
- R. Kakumani, V. Devabhaktuni, and M.O. Ahmad. Prediction of protein-coding regions in DNA sequences using a model-based approach. IEEE International Symposium on Circuits and Systems, Seattle, WA, 2008, 1918-1921.
- M. Akhtar, E. Ambikairajah, and J. Epps. Optimizing period-3 methods for eukaryotic gene prediction [C]. IEEE International Conference on Acoustics, Speech and Signal Processing, Digital Object Identifier: 10.1109/ICASSP.2008.4517686, Las Vegas, NV, 2008, 621 - 624.
- M.K. Hota, and V.K. Srivastava. DSP technique for gene and exon prediction taking complex indicator sequence [C]. IEEE Region 10 Conference, 2008, 1 - 6.
- D.G. Grandhi, and C. V. Kumar. 2-Simplex mapping for identifying the protein coding regions in DNA [C]. IEEE region conference (TENCON), Jan 2008, 1-3.
- R. Gupta, A. Mittal, K. Singh, P. Bajpai, and S. Prakash. A Time Series Approach for Identification of Exons and Introns [C]. 10th International Conference on Information Technology, Digital Object Identifier: 10.1109/ICIT.2007.54, 2007, 91 - 93.
- J. Y. Y. Kwan, B. Y. M. Kwan and H. K. Kwan. Spectral analysis of numerical exon and intron sequences [C]. Proceedings of IEEE International Conference on Bioinformatics and Biomedicine Workshops (BIBMW) Hong Kong, 2010, 876-877.
- J. Y. Y. Kwan, B. Y. M. Kwan and H. K. Kwan. Novel methodologies for spectral classification of exon and intron sequences [J]. EURASIP Journal on Advances in Signal Processing, 2012.
- D Karolchik, AS Hinrichs, TS Furey, KM Roskin, CW Sugnet, D Haussler, WJ Kent. The UCSC Table Browser data retrieval tool. Nucleic Acids Res. 32(Database issue), 2004, D493-496.
- J Goecks, A Nekrutenko, J Taylor, The Galaxy Team, Galaxy: a comprehensive approach for supporting accessible, reproducible, and transparent computational research in the life sciences. Genome Biology, Article R86, 2010 11(8).
- D Blankenberg, G Von Kuster, N Coraor, G Ananda, R Lazarus, M Mangan, A Nekrutenko, J Taylor, Galaxy: a web-based genome analysis tool for experimentalists. Curr. Protoc. Mol. Biol. Chapter 19, Unit 19.10.1-21, 2010.
- B. Giardine et al. “Galaxy: a platform for interactive large-scale genome analysis. Genome Res. 200515(10): 1451–1455.
