A Novel Method to Improve the Visual Quality of X-ray CR Images

Author: Huiqin Jiang, Zhongyong Wang, Ling Ma, Yumin Liu, Ping Li
Journal: International Journal of Image, Graphics and Signal Processing(IJIGSP) @ijigsp
Article in issue: 4 vol.3, 2011.
Free access
The aim of this study is to improve the visual quality of x-ray CR images displayed at general displays. Firstly, we investigate a series of wavelet-based denoising methods for removing quantum noise remains in the original images. The denoised image is obtained by using the scheme of wavelet thresholding, where the best suitable wavelet and level are chosen based on theory analysis. Secondly, the image contrast is enhanced using Gamma correction. Thirdly, we improve unsharp masking method for enhancing some useful information and restraining other information selectively. Fourthly, we fuse the denoised image with the enhanced image. Fively, the used display is calibrated, so that it could offer full compliance with the Grayscale Standard Display Function (GSDF) defined in Digital Imaging and Communications in Medicine (DICOM) Part 14. Finally, we decide parameters of the image fusion, resulting in the diagnosis image. A number of experiments are performed over some x-ray CR images by using the proposed method. Experimental results show that this method can effectively reduce the quantum noise while enhancing the subtle details; the visual quality of X-ray CR images is highly improved.
Wavelet denoising, image enhancement, unsharp masking
Short address: https://sciup.org/15012154
IDR: 15012154
Text of the scientific article A Novel Method to Improve the Visual Quality of X-ray CR Images
Published Online June 2011 in MECS
As computer technologies advanced and imaging modalities allowed acquisition of digital images, Picture Archiving and Communications Systems (PACS) began to rapidly develop. Nowadays, many hospitals are undering the clinical operation using filmless full PACS and many diagnoses are being made based on medical softcopy image display system rather than conventional film-on-light box display. However, in comparison with the latter, medical softcopy image display may compromise image quality [1], and some unexpected effects on the accuracy of diagnosis may be introduced. Also, there are many other issues like the viewer soft related to display quality unsettled in medical softcopy display system. Using high-end monitors may decrease those drawbacks. However, for those developing countries such as China, the cost savings is needed in displaying medical image. To this end, many hospitals are using the commercial displays for replacing medical grade displays. These result in baddish quality in softcopy display. The visual quality of medical images is the key factor affecting diagnosis accuracy in PACS. Moreover, X-ray CR images are used widely in the clinical diagnosis.
This study is supported by the Project for Science and Technology Development of Zhengzhou (No.10PTGG399-2)
Therefore, it is necessary to improve the visual quality of X-ray CR images.
Image enhancement is a very powerful tool to improve the visual quality of images. Numerous enhancement methods have been proposed in the literature. Mainly on grayscale transform and frequency domain transform. Windowing/ leveling and the histogram equalization approach are two of the most widely used spatial uniform contrast-based enhancement technique, which are simple global enhancement approach and observers can interactively change the image contrast in any grey level range [2]. Studies of frequency domain transform mainly concentrate on the wavelet transform [3]-[4]. However, artifacts are inherent in these enhancement processes, such as, at bone-soft tissue boundaries. These artifacts have a detrimental effect on diagnoses. In some cases they can be pathological evidence in a normal radiograph, or they can hide subtle lesions. Especially, an important issue in X-ray CR images is to acquire high quality images with the lower clinical dosages to eliminate the potential danger of radiation. However, simply downscaling the radiation intensities over the entire scan results in increased quantum noise. With the detection of the statistical nature of photon, it is found that Poisson noise is one of the important factors degrading X-ray CR images at low count level.
Several methods with a discrete wavelet transform have been proposed to remove the noise [5]-[6]. Such as Donoho’s soft thresholding algorithm [5], Zhang’s algorithm [6], etc. most of the previously developed wavelet-based denoising algorithms are to remove additive Gaussian noise. However, for removing Poisson noise, these de-noising techniques needs further to be researched.
In this paper, a wavelet-based medical image denoising and enhancement algorithm was presented. We first investigated a wavelet-based de-noising algorithm. Then we modify the image enhancement technique in [7] and propose a new scheme for medical image de-noising and enhancement. By using the proposed method, the quantum noise on x-ray CR images can be reduced and the images can be enhanced effectively. Consequently, the visual quality of X-ray CR images is highly improved.
-
II. factors for affecting the visual quality
Typically there are two factors affecting the visual quality of x-ray CR images displayed in PACS. They are the used display and the original image quality.
Compared to medical grade displays, the commercial displays have some disadvantages for showing medical imaging.
First, the commercial displays have a smaller luminance range, which enables them to offer the smaller luminance difference versus between Just-Noticeable Difference (JND) indexes. Such smaller luminance difference is hard to be discerned by human eye.
Second, medical image is 10 bit or 12 bit. The number of available shades of gray on most commercial displays is limited to 256 (8 bit) only, enabling them hard to render every grayscale as defined by medical image.
Third, contrast is another important factor for diagnostic reading, medical grade display offer a better contrast ratio than the commercial display, which enables them to be capable of rendering more DICOM JNDs.
Fourth, DICOM3.14 standard proposes a Grayscale Standard Display Function (GSDF), which is much better for viewing medical images. However, most commercial displays have their own luminance response functions, which do not follow DICOM standards.
Moreover, the consistency of display images over time and temperature is very significant in medical imaging; medical displays can continuously measure the brightness of the display and even correct it if necessary. However, the commercial displays, its brightness is variable as the change of time and temperature.
On the other hand, noise remains in the original images also affect diagnosis accuracy for softcopy display.
Our research purpose is to improve the diagnostic value of the images by image processing; enabling commercial displays can provide long-term image viewing of the highest quality for efficient diagnosis and referral.
-
III. PROPOSED ALGORITHM
Our proposed method consists of the following steps.
Fig. 1 shows the flow chart of the image processing.
Input original пи age
Wavelet de-noising
Contrast enhancement
Extract high frequency information
, u
Classify’ liigli frequency information linage fusion
—л--
Make GSDF calibration
Decide fusion parameter
Output processed image
Figure 1. Flow chart of the proposed method Step1: Design a wavelet-based filter for removing quantum noise remains in the original images. Step2: Enhance the image contrast using Gamma Correction.
Step3: Extract the high frequency information of the original image.
Step4: Classify the high frequency information.
Step5: Use image fusion to obtain a processed image.
Step6: Calibrate the used display on the basis of DICOM GSDF.
Step7: Decide parameters of the image fusion.
A. A wavelet-based filter
Noise remains can mask and blur important features in the real medical images. Fig.2 is an example of shown images
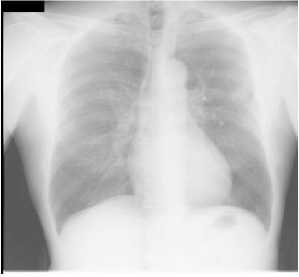
Figure 2. A display image with big nodule
using the commercial display. This image is degraded by noises as shown in Fig.2, enabling the detail of the texture hard to be found. Thus, we first consider the method of de-noising enhancement.
In the reduction of noise, we have to remove the noise component appropriately while retaining the edge components; especially, the ribs and the blood vessels can be viewed as potential edges, which are important features in medical images. Because the spectrum of their features is very similar to that of the noise, this is the difficulty of image processing.
Because wavelet transform are capable of trading one type of resolution for the other, which makes them especially suitable for the analysis of nonstationary signals. One privileged area of applications where these properties have been found to be noise reduction. Our previous research has proved that the wavelet-based denoising techniques perform better than the optimal spaceinvariant solution (Wiener filter) [8]- [9]. Therefore, we choose the wavelet-based de-noising method in this paper.
One of the widely discussed techniques is the wavelet thresholding scheme, which recognizes that by performing a wavelet transform of a noisy image, noise will be represented principally as small coefficients in the high frequencies. Thus in theory a thresholding, by setting these small coefficients to zero, will eliminate much of the noise in the image [10].
Using Discrete Wavelet Transform (DWT), many methods for remove additive Gaussian noise have been proposed [11]-[14]. However, based on the classical DWT de-noising provides multi-scale treatment of noise, downsampling of sub-band images during decomposition and the thresholding process of wavelet coefficients may cause edge distortion and Gibbs ring artifacts in the reconstructed images [13]-[14]. In order to overcome this drawback, we choose Stationary Wavelet Transform (SWT).
SWT is proposed on the basis of orthogonal wavelet transform, and it remove the down-sampling in the decomposition as illustrated in Fig.3. In Fig.3, cA 0 represents a two-dimensional original image.
Fj andGj represent high-pass and low-pass filter at scale j, resulting from interleaved zero padding of filters Fj 1 and g 1 (j>1). cA0 denotes the original image and the output of scale j, cAj would be the input of scale j+1. cAj+1 denotes the low-frequency (LF) estimation after the

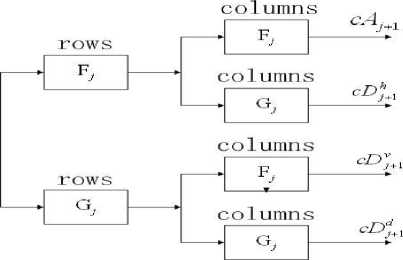
Figure 3. Stationary wavelet decomposition of a two-dimensional image
stationary wavelet decomposition, while cDh t , d t and cD ] denote the high frequency (HF) detailed information along the horizontal, vertical and diagonal directions, respectively. These sub-band images would have the same size as that of the original image because no downsampling is performed during the wavelet transform [15].
This kind of two-dimensional SWT leads to a decomposition of approximation coefficients at level j in four components: the approximation at level j+1, and the details in three orientations (horizontal, vertical, and diagonal). Conversely, through the inverse wavelet transform, the reconstructed image was obtained.
Based on the wavelet thresholding scheme and SWT, an improved wavelet filter is proposed. The proposed method consists of the following steps:
Step1: Choose the best suitable wavelet and level based on theory analysis.
Since Haar wavelet is self-reproducing across scales, it is an appropriate transform to the case of the Poisson distribution. Moreover, in order to satisfy real-time application, the lower level is chosen to decompose an image. Here, two levels are chosen.
Step2: Decompose the noisy image to some subband images using SWT.
SWT overcomes the drawback of the classical DWT, which is a time-invariant transform. Therefore, we select SWT in this study.
Step3: The universal threshold is calculated by the following Donoho’s method for denoising automatically. It can be exp-ressed as:
T = C 2ln( N) , wherec = Median(abs(wi))/0.6745 is the estimated noise variance, wi is the detail coefficients of SWT, and N is the sampling length of noisy image.
Step4: The Donoho’s soft thresholding method is applied to the details to modify SWT coefficients.
Step5: The denoised image is reconstructed by the inverse SWT.
In order to evaluate the de-noising method, we perform a series of de-noising experiments using images with controlled noise amounts. Results of quantitative evaluations are presented.
Images with Poisson noise are created using the following method.
The noisy image g( x , y ) is generated by multiplying the original pixel values by X and using the obtained results as input to a random number generator which returns truncated to the 12-bit gray-scale digitization range.
g ( x , y ) = -1 Poission ( X f ( x , y )) (1)
X
f( x , y ) and g ( x , y ) are the gray-scale values in the original and noisy images, respectively. Fig.4 shows the simulation of this process.
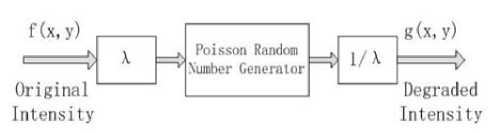
Figure4. Poisson noise simulator
With this approach, we maintain a constant mean grayscale value at different noise levels. The amount of noise depends upon X .
We use Peak Signal-to-noise (PSNR) as the evaluation criterion of denoised images. The PSNR is calculated using Equation (2)
S 2 psnr=10 log
10 MSE
1 NM
Where, MSE= £ Д g ( n , m ) — f ( n , m )] 2 (3)
MN n = 1 m = 1
S is the maximum pixel value, and PSNR is measured in decibel (dB).
We execute the algorithm to the obtained noisy images. For these noisy images, the PSNR was estimated before and after application of the proposed algorithm. Experiment results are shown in Fig.5. Fig.5 (a) shows a noisy version (PSNR =24.37), Fig.5 (b) shows the image (PSNR ==38.35) denoised by our technique, and Fig.5(c) shows the image (PSNR =26.19) denoised by the DWT method.
TABLE 1. PSNR MEASUREMENTS OF IMAGES
|
Image No. |
Amount of noise |
Noise Image |
DWT method |
The proposed method |
|
1 |
X = 0.02 |
15.54 |
25.14 |
29.95 |
|
X = 0.07 |
21.05 |
33.81 |
36.55 |
|
|
X = 0.2 |
23.41 |
36.75 |
38.47 |
|
|
2 |
X = 0.02 |
15.02 |
27.56 |
28.74 |
|
X = 0.07 |
19.24 |
34.03 |
35.82 |
|
|
X = 0.2 |
23.97 |
36.46 |
37.07 |
|
|
3 |
X = 0.02 |
14.33 |
28.60 |
30.05 |
|
X = 0.07 |
20.82 |
33.74 |
35.85 |
|
|
X = 0.2 |
25.70 |
35.95 |
37.67 |
|
|
4 |
X = 0.02 |
16.25 |
29.49 |
31.75 |
|
X = 0.07 |
21.13 |
33.95 |
36.83 |
|
|
X = 0.2 |
24.81 |
37.28 |
39.29 |
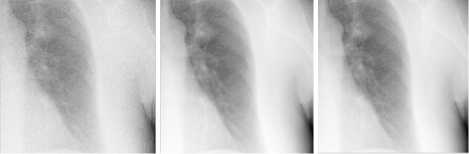
(a) (b) (c)
Figure 5. (a) Noisy image (PSNR =24.37), (b) The proposed method (PSNR =38.35), (c) DWT method (PSNR = 26.19).
Table 1 and Fig.6 show PSNR comparisons of the proposed method with the DWT method. The yellow line shows the PSNR of the denoised images by the proposed method. It can be noticed that the images that were applied the proposed method showed the best results.
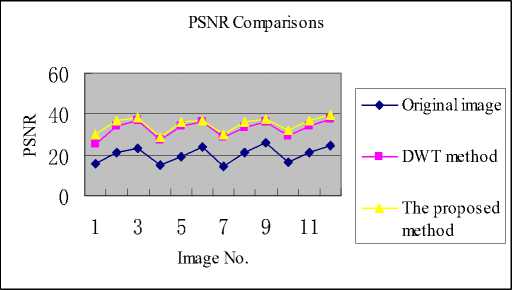
Figure 6. PSNR Comparisons
Also, we evaluate the performance of the proposed algorithm on real CR images with inherent noise.
The original and denoised images are shown in Fig.7 (a), (b), respectively. Let us look round Fig.7 (a) and Fig.7 (b). As one can see, the denoised image maintained sharpness and many fine details, while the noise was removed. It is visually better than the original image.
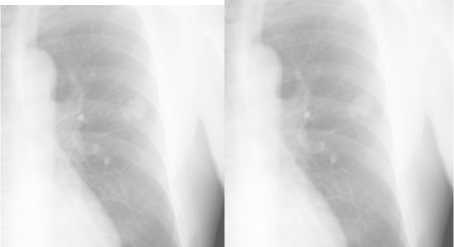
(a) The original image (b) The denoised image
Figure 7. Comparison of the original and denoised image
B. Contrast enhancement
Since x-ray CR images inherently have a wide dynamic range up to 10 bits or 12 bits and low detail contrast. Moreover, diagnosis feature such as nodules and edges are often showing up as relatively low-contrast white circular objects. In order to enhance low contrast white circular objects, we first compress low signal components in the denoised image fd ( x , y ) using Gamma correction, so that diagnosis feature can be enhanced naturally.
f ( x , y ) = f ( x , y ) Y (4)
Where, f 1 ( x , y ) is the first temporary image. It is obtained using Equation (4). The / value can be adjusted by user.
C. Extracting
The High Frequency Component can be extracted according to the following steps.
step1: Design a lowpass filter using Gaussion function, where the designed lowpass filter is an integer vector with size 33.
step2: The designed lowpass filter is used as convolution kernel to compute a very blurred version of the original image fo ( x , y ).
The obtained blurred image is defined as fb ( x , y ).
Step3: The high frequency component is computed using
Equation (5).
f h ( x , y ) = f ( x , y ) - fb ( x , y ) (5)
Where, fh ( x , y ) is the extracted high frequency component.
D. Classification
We can implement the enhancement of high-frequency details of medical images in either spatial domain or frequency domain. Because both diagnosis feature and noise are high frequency components, the drawbacks of existing methods are enhancement of noise present in images. In order to solve this problem, we analyze and classify the extracted high frequency components into three feature images. Firstly, if the absolute value extracted high frequency components or the size of graininess is smaller, it is considered as noise. Secondly, we set a threshold T by analyzing this absolute value. Thirdly, we construct three temporary images according to the following rule. If fh (x, y) > T , fh (x, y) is classified as the second temporary image f2 (x, y), this is the diagnosis feature component in the high signal range. Else if fh (x, y) < -T , fh (x, y) is classified as the third temporary image f3 (x, y), this is the diagnosis feature component in the low signal range, else fh (x, y) is classified as the fourth temporary image f4 (x, y), this is the noise component.
E. Image Fusion
On the basis of above four obtained temporary images, the enhanced image is reconstructed using image fusion as shown in Equation (6).
fe ( x , y ) = f 1 ( x , y ) + a * f 2 ( x , y ) + b * f з ( x , y ) + c * f з ( x , y )(6) Where, f 1 ( x , y ) is obtained using (2), у is the gain factor for adjusting the compression ratio of nondiagnosis feature component. a is the gain factor for adjusting the enhanced diagnosis feature component in the high signal range. b is the gain factor for adjusting the enhanced diagnosis feature component in the low signal range. c is the gain factor for adjusting the removed noise component.
F. Calibration
In displaying a medical image, image data will be transformed according to the corresponding Lookup Table (LUT) on monitor, which is the final link between the image data and the eye brain system of human observer [16]-[19]. DICOM 3.14 standard proposes a Grayscale Standard Display Function (GSDF), which is much better for viewing medical images. However, the LUT in the general display is preset for normal text and picture display but not for medical softcopy image display, the general display’s luminance response curve does not follow GSDF defined as DICOM3.14. Thus, to make the medical softcopy image display system offering full compliance with DICOM GSDF [18]-[19], we need to calibrate LUT in the general display. Moreover, the monitor’s luminance response curve will appear degradation after a period of time; therefore, the calibration process need be performed routinely.
G. Deciding Parameter
In this study, the luminance response function used commercial display is calibrated firstly according to the GSDF defined in DICOM3.14 standard. Then parameters у , a, b, and c are decided by user while viewing the image quality. Also, we will make DICOM 3.14 calibration and update parameters to keep the image consistent over time.
-
IV. EXPERIMENT AND EVALUATION
We first perform a series of experiments using images in the Standard Digital Image Database, Japan: nodule 154, and non-nodule 93 on chest radiogram, to verify this technique.
Fig.8 (a), (b), (c), and (d) show the original images with big, middle, small nodules, and non-nodule using the commercial display respectively. The enhanced results of these images are shown in Fig.9 (a), (b), (c), and (d) respectively. The images displayed in Fig.8 present undesired properties like low signal-to-noise (SNR) and low contrast ratios. The displayed images have so poor image quality that nodules can not be seen in these images.
The enhanced results of these images are shown in Fig.9. Big nodule and middle nodule not only can be seen clearly in Fig.9 (a) and (b); but also, little nodule in Fig.9 (c) and the detail feature in Fig.9 (d) can be observed. The results show
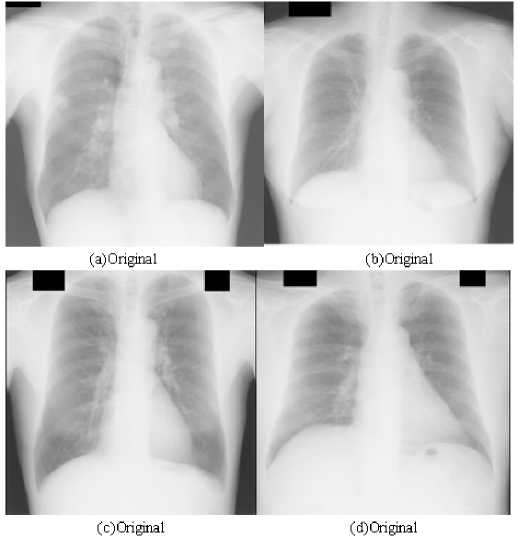
Figure 8. Show the original images using the commercial display that the diagnosis feature has been enhanced effectively in the processed images.
Further more, we have evaluated this technique based on minimum standards to meet the American Association of Physicists in Medicine (AAPM) and Japan Industries Association of Radiological Systems Standards (JESRA).
In visual check, acceptance test result report has indicated that the patches’ luminance differences among 16 steps can be clearly recognized, 5% and 95% patches can be visible, the judgment-use positions on the reference clinical image can be visible without any problem, smooth, stable and continuous display can be presented, and artifacts do not be present.
The measured values, such as contrast response, luminance deviation, luminance ratio, etc, are the range of acceptance in AAPM and JESRA Standards.
Therefore, although the commercial display is used, the enhanced image can provide long-term image viewing of the highest quality for efficient diagnosis and referral.
-
V. CONCLUSION
A novel method to improve the visual quality of x-ray CR images has been presented. We have demonstrated that the proposed technique not only can offer effective noise removal in noisy medical images and enhancing sharpness, but also can improve the diagnostic value of the shown image on the commercial display successfully.
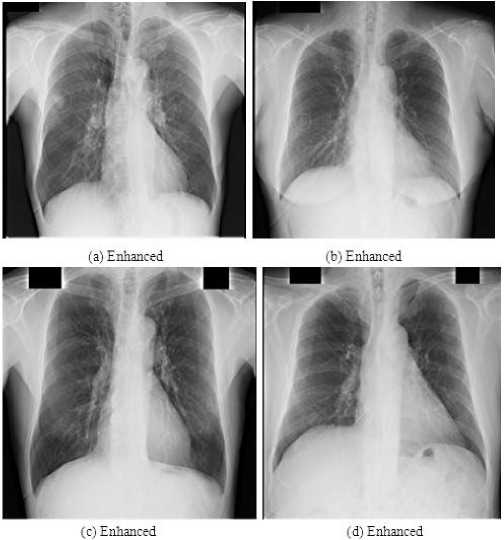
Figure 9. Show the enhanced images using the commercial display
References A Novel Method to Improve the Visual Quality of X-ray CR Images
- Liu Jiquan; Feng Jingyi; Lao Duchun; “DICOM GSDF Based Cal- ibration Method of General LCD Monitor for Medical Softcopy Ima- ge Display”,Bioinformatics and Biomedical Engineering, 2007, ICB- BE 2007, The 1st International conference on Digital object identifier: 10.1109/ICBBE.2007.298, Publication Year:2007, pp.1153-1156.
- Iyad Jafar, Hao Ying, “A New Algorithm for Adaptive Contrast Enhancement Based on Human Visual Properties for Medical Imag- ing Applications,” IJCSNS International Journal of Computer Scie- nce and Network Security, VOL.7 No.7, July 2007.
- Jiao Feng, Naixue Xiong and Bi Shuoben. “X-ray Image Enha-ncement Based on Wavelet Transform”, Proceedings of IEEE Inte-rnational Conference on Asia-pacific service computing, pp. 1568-1573, 2008.
- Miller, M.; Kingsbury, N. “Image denoising using derotated co-mplex wavelet coefficients”, IEEE Transactions on Image Processing, Vol. 17, pp. 1500-1511, 2008.
- D.L. Donoho, “De-noising by soft-thresholding,” IEEE Trans. Inform. Theory, vol. 41, No.3,pp.613-627, 1995.
- Zhong J, Ning R, and Conover D. Image denoising based on mul- tiscale singularity detection for cone beam CT breast imaging. IEEE Trans MedImaging, 23: 696-703, 2004.
- H.Jiang, Y. Lu and L. Ma. “A Novel Image Enhancement Tech-nique for CR Chest Images,”2010 RISP International Workshop on Nonlinear Circuits and Signal Processing, Hawaii, USA, March 3-5, 2010, pp..239-242.
- H. Jiang, T. Yahagi, T. Okamoto, and J. Lu,“An Adaptive Deno- ising Method for Medical CR Images Using Wavelet Packet”, Journal of Signal Processing, vol.7, November 2003,no.6, pp. 443-452.
- J. Lu, H. Jiang, H. Jiang, and T.Yahagi ,``Restoration of Images with Poisson Noise Based on Wavelet Shrinkage Technique'', 2004 RISP International Workshop on Nonlinear Circuits and Signal Proc- essing(NCSP'04), Hawaii, USA, March 5-7, 2004,pp.391-394.
- S. Mallat, A Wavelet Tour of Signal Processing. Academic Press, London, 1998.
- G. Chang, B. Yu, M. Vetterli, “Adapting to unknown smooth- ness via wavelet shrinkage,” IEEE Trans. Image. Proc., vol. 9, pp. 1532 -1546, 2000.
- Zhong J, Ning R, and Conover D. “Image denoising based on multiscale singularity detection for cone beam CT breast imaging,” IEEE Trans. Med. Imaging, 23: pp.696-703, 2004.
- Chun Jiao, Dongming Wang, Hongbing Lu, Zhu Zhang, Jerome Z. Liang,“Multiscale Noise Reduction on Low-Dose CT Sinogram by Stationary Wavelet Transform”, 2008 , IEEE Nuclear Science Symposium Conference Record, pp.5341-5344.
- Zachary S. Kelm, Daniel Blezek Ph.D, Brian Bartholmai M.D. “Optimizing Non-local Means for Denoising Low Dose CT”, July 1 2009, pp.662-665.
- Nason GP, Silverman BW. The stationary wavelet transform and some statistical applications in wavelet and statistics. In:Antoniadis A ed.Lecture Notes in Statistics. Berlin: Spinger Verlag, 281-299, 1995.
- Carrino J., “Image Quality: a clinical perspective”, In: Siegel E, Reiner B. and Carrino J., SCAR University Primer 3: Quality Ass- urance in the Digital Medical Enterprise, Society for Computer A- pplications in Radiology, 2002.
- J.Wang and Q.Peng, “An Interactice Method of Assessing the Characteristics of Softcopy Display Using Observer Performance Tests”, J. of Digital Imaging, Vol. 15, Suppl. 1, pp. 216-218, 2002.
- E. Samei, A. Badano, D. Chakraborty, et al, AAPM Online Report No.03, “Assessment of Display Performance for Medical Imaging Systems”, 2005.
- David M. Jones, “Utilization of DICOM GSDF to Modify Lookup Tables for Images Acquired on Film Digitizers”, J. of Di-gital Imaging, Vol. 19, No. 2, pp. 167-171, 2006.
