A Novel Software Tool to Generate Customer Needs for Effective Design of Online Shopping Websites

Author: Ashish K. Sharma, Sunanda Khandait
Journal: International Journal of Information Technology and Computer Science(IJITCS) @ijitcs
Article in issue: 3 Vol. 8, 2016.
Free access
Effective design of online shopping websites is the need of the hour as design plays a crucial role in the success of online shopping businesses. Recently, the use of Quality Function Deployment (QFD) has been reported for the design of online shopping websites. QFD is a customer driven process that encompasses voluminous data gathered from customers through several techniques like personal interview, focus groups, surveys etc. This massive, unsorted and unstructured data is required to be transformed into a limited number of structured information to represent the actual Customer Needs (CNs) which are then utilized in subsequent stages of QFD process. This can be achieved through brainstorming using techniques like Affinity Process. However, integrating the Affinity Process within QFD is tedious and time consuming and cannot be dealt with manually. This generates a pressing need for a software tool to serve the purpose. Moreover, the researches carried out so far have focused on QFD application, post the generation of CNs. Also, the available QFD softwares lack the option to generate CNs from collected data. Thus, the paper aims to develop a novel software tool that integrates Affinity Process with QFD to generate customers' needs for effective design of online shopping websites. The software system is developed using Visual Basic Dot Net (VB.Net) that integrates a MS-Access database.
Online shopping, website design, vb.net, ms-access, affinity process, customer needs, qfd, software
Short address: https://sciup.org/15012468
IDR: 15012468
Text of the scientific article A Novel Software Tool to Generate Customer Needs for Effective Design of Online Shopping Websites
Published Online March 2016 in MECS
In the recent past, due to technological advancements there has been a tremendous rise in the use of online shopping. Although online shopping has become a growing new trend, consumers are still not very satisfied with the present design and operation of shopping websites [1]. As a result, there has been a decline in the Internet users' rate of satisfaction [2]. Thus, businesses involved in online shopping are striving hard for well- designed websites as they symbolize customer satisfaction. The well-designed websites is the need of hour as design plays a crucial role in the success of online shopping businesses. Ref. [3] mentions that a well-designed website helps reinforce the firm’s brand equity, while a poorly designed website can devalue the established brand equity. A pool of methods has been utilized in the past for website designing but none of them proved much effective. Recently, the use of Quality Function Deployment (QFD) has been reported and the results were quite encouraging. In QFD, the quality is measured by its potential to satisfy customer needs. In addition, since QFD is customer driven process, Customer Needs (CNs) are of paramount importance and thus efficient generation of CNs is highly asked for in QFD. QFD comprises of sets of matrices, and is rather a lengthy and complex process, which involves voluminous data and complex calculations. As a result, dealing with the data manually is quite cumbersome and time consuming [4]. In QFD the data is collected from the customers through surveys, clinics, focus groups, individual interviews, listening (eavesdropping) at dealerships and trade shows, consumer complaints, etc. As a result, a high volume of unsorted, repetitive and unstructured data is generated, which represent the customer voices. These voices are the customers statements expressed in their own words. This data happens to be massive and not in usable form and thus it has to be transformed through brainstorming into a form to be utilized. For this, the data has to be distilled and suitably converted to a handful of information to represent the actual CNs. These calls for a suitable technique that can better address this issue. Affinity Process is a widely used and powerful method used to organize and gain insight into a set of qualitative information, such as voiced customer needs. The Affinity Diagram is one of the Seven New Quality Control (QC) Tools being proposed by Mizuno Shigero [5]. Also called the KJ method, after its developer Kawakita Jiro, the process of the KJ-method is, when compared to other management tools, creative other than intellectual. Usually, an initial list of customer attributes is developed internally through the brainstorming in most of the QFD projects. Affinity Diagrams are then used to consolidate and organize the individual attributes. Application of Affinity Process on collected customer data in QFD yields a tree structure of customer needs on a primary, secondary and tertiary level. When the tree is completed, the voices on the third level i.e. tertiary level or any other level with a limited number of requirements are extracted. These requirements are the final CNs that will be used in the House of Quality (HOQ) of QFD. This transformation of CVs into CNs is done through brainstorming using affinity process. These generated CNs are then utilized in subsequent stages of QFD process. However, due to the complexity and timeconsuming nature of the method, need of suitable software is highly recognized. Moreover, the researches carried out so far have focused on QFD application, post the generation of customer needs. Also, the available QFD software’s lack the option to generate CNs from collected data.
The paper thus attempts to develop a software tool, which can synthesize and organize the massive data generated in QFD to produce meaningful information. The software tool is developed using Visual Basic Dot Net (VB.Net) and MS-Access. The database contains the data that represents collected CNs. The database also allows for storing the generated results, which can be duly utilized in the later stages of the QFD process. An example is presented to demonstrate the application of the software tool. The outcome of the work is an efficient and viable software tool that integrates Affinity Process to produce a clear segmentation of customer needs. In the light of above, the paper is organized as follows. The paper begins with the topic introduction. Section 2 presents a literature review on application of an Affinity Process in QFD. Section 3 briefly outlines the QFD process. Section 4 describes the Affinity Process. Section 5 presents the research methodology to be used. Section 6 describes the proposed software tool. Finally the last section presents the conclusions of the developed software tool.
-
II. QFD and Affinity Process: A Literature Review
In QFD, Affinity Process has been utilized for better and productive results. Affinity Diagrams are applied to structure the lifestyle words in QFD [6]. A method used for transforming the customer requirements, sometimes called the Voice Of Customer (VOC), to product specifications was developed by [7], in which semantics methods, such as the Affinity Diagram and MPM (multi pickup method), are applied as the basis for discovering underlying facts from affective language. QFD is applied for tackling internal customers’ needs as a base for building a lean manufacturing system [8]. Affinity Diagrams are employed for grouping customer needs into different categories in building a lean manufacturing system. Ref. [9] carried out a pilot survey in the UK service organizations to understand the status of Six Sigma and 40 variables i.e. statements were grouped under 13 critical success factors (CSFs) using the Affinity Diagram tool. Ref. [10] employed the Affinity Diagrams in QFD to design customer needs for product development at Nokia Mobile Phones (NMP). Ref. [11] proposed preprocessing the VOC prior to its being entered as customer attributes into the house of quality. In preprocessing, they adopted an Affinity Diagram (KJ method) to categorize the customer requirements.
-
III. Quality Function Deployment (QFD)
QFD is a customer-oriented approach, supporting design teams in developing new products based on an assessment of customer needs. Basically, in the QFD, customer needs are translated into design attributes. To begin the design process in the QFD, the design team needs to listen to the voice of the customer. QFD is based on the widely used Four Phase Model, which focuses on the quality deployment part of Akao’s comprehensive QFD framework. The four phases represent product planning, component planning, process planning and production planning [12]. QFD is an innovative approach bringing quality as demanded by the customers – upstream into the product development process. QFD is a systematic process for helping a business to focus on its priorities, investments and customers. It uses crossfunctional teams to identify and resolve issues involved in providing products, processes, services and strategies to meet or exceed customer expectations [13].QFD methodology provides a way to translate conceptual requirements into items that are workable, measurable, and capable of design enhancement. The result is a better design, shorter product development cycles, better product quality, and lower costs [14]. The central tool of the QFD is the matrix chart called House of Quality (HOQ). This tool is a powerful way of generating specific, prioritized, and measurable technical requirements from often-ambiguous customer needs. The HOQ matrix is the most recognized form of QFD. It is utilized by a multidisciplinary team to translate a set of customer requirements into an appropriate number of prioritized engineering targets to be met by a new product design. HOQ is the matrix, which analyses customer requirements in detail and translates them into the developer’s language [15]. The QFD comprises several different parts or rooms, which are sequentially filled in order to achieve an actionable translation from requirements into characteristics [16].The first room of the HOQ concerns the Voice of the Customer - a structured list of requirements concerning the product and its attributes as the customer describes them also known as needs, or wants together with a measure of the importance customers attach to each requirement [17]. There are several possible sources of information about customer requirements: market research data, sales data, customer complaints, retailers, focus groups, opinion surveys, in-depth interviews, etc. The customers’ requirements are compiled and organized by the QFD team in a hierarchical structure of primary, secondary and tertiary requirements using quality tools like Affinity
Diagram. The establishment of the voice of the customer is the most critical step in a QFD project.
-
IV. Affinity Process
Affinity Process is a vital tool that deals with massive data to produce limited number of organized and meaningful information. The Affinity Process is often used to group ideas generated by brainstorming. Affinity Process employs Affinity Diagrams, which is an analysis tool that allows a team to systematically generate a large volume of ideas or inputs about a problem or issue and organize these into logical groupings. An Affinity Diagram is a tool that gathers large amounts of language data ideas, opinions and issues and organizes them into groupings based on their natural relationships. Affinity Diagrams are the tools used to consolidate and organize the individual attributes.
-
A. Restricting Number of Needs
On account of the massive data generated, the complexity of dealing and managing the data poses a great challenge. Moreover, as the number of input grows, the task becomes more and more onerous. Although the number of requirements varies for each project, still 2030 items can be considered a good compromise between grade of detail and complexity [18]. The fewer the voices, the easier it will be to work. However, as the matrix grows, the consensus decision process will suffer and the overall value of the QFD process and its output will be diminished. For that reason it is obviously important to limit the number of CNs. The Affinity Diagram Process is used to further decreasing the number without diminishing the impact of the customers’ voice. The best approach to the issue of limiting the matrix size is to use the Affinity Diagram concept [19].
-
B. Affinity Diagram Process
The Affinity Process is formalized in an Affinity Diagram and is useful when sifting through large volumes of data and encouraging new patterns of thinking. An Affinity Diagram is a tool that gathers large amounts of language data ideas, opinions and issues and organizes them into groupings based on their natural relationships. The Affinity Process is often used to group ideas generated by brainstorming. Affinity Diagrams are the tools used to consolidate and organize the individual attributes. Customer attributes must be analyzed carefully before making design decisions. The voice of the customer should be organized into a hierarchy. The Affinity Diagram is an analysis tool that allows a team to systematically generate a large volume of ideas or inputs about a problem or issue and organize these into logical groupings. Also called the KJ method, after its developer Kawakita Jiro, an Affinity Diagram helps to synthesize large amounts of data by finding relationships between ideas. The information is then gradually structured from the bottom up into meaningful groups [20]. Affinity Diagrams are an efficient method of organizing large amounts of unstructured verbal data. They enforce a high degree of organization and screen-hidden relationships between the items and item groups. The Affinity Diagram is one of the Seven New Quality Control (QC) Tools being proposed by Mizuno Shigero [5]. The process of the KJ-method is, when compared to other management tools, creative other than intellectual. Usually, an Affinity Diagram is used to refine a brainstorm into something that makes sense and can be dealt with more easily. In Seven New QC Tools, Ishikawa recommends using the Affinity Diagram when facts or thoughts are uncertain and need to be organized, when preexisting ideas or paradigms need to be overcome, when ideas need to be clarified, and when unity within a team needs to be created [21]. The main objective of the application of the Affinity Process in QFD is to group the customer requirements into a structure of primary, secondary, and tertiary requirements. Affinity Diagram Process is applied for the organization of customer needs. In conventional Affinity Process, as a first step all the customer voices or statements are written on the cards. Cards containing similar items are grouped together on the basis of their affinity. After a few cards are in a group, the group can be labeled. Inappropriately assigned cards are re-assigned or taken out of the group and returned to the presorting pile. The cards that appear to be properly grouped are given a label that represents the characteristic of the group. The label should convey the meaning of the cards completely. Finally the Affinity Diagram is drawn when all groups are checked and labeled. This generated Affinity Diagram is then converted into a tree structure of customer needs on a primary, secondary and tertiary level. A Tree Diagram can be applied for the purpose.
The Affinity Process includes several steps and the flowchart for the same is given below in Fig. 1.
-
C. Flowchart of Affinity Process
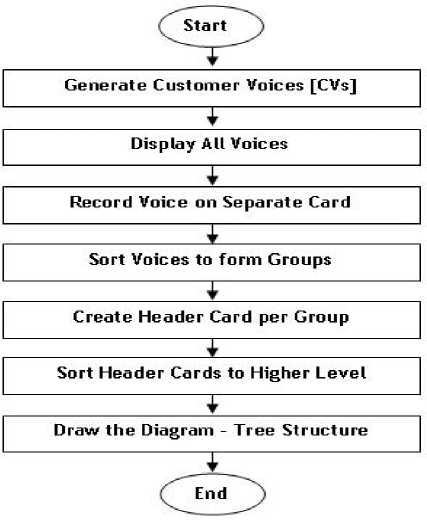
Fig.1. Process Flow of Affinity
-
V. Methodology
The goal is to develop a customized Affinity Process based software tool to efficiently generate customer needs that could drive the effective web development of online shopping websites. Development of software enforces meticulous examination of the processes involved, gathering of data and then using transcription of this data into the technical slabs for effective utilization [22]. Besides the software realization of the process, it also accounts for accommodating and screening all data when grouped on larger tables. Thus, an appropriate interface is to be designed and developed. Further, since the results or data generated shall be duly utilized for future use and in the later stages of the QFD process, a suitable database system is to be employed.
VB.Net is a simple, modern, object-oriented computer programming language developed by Microsoft to combine the power of .NET Framework and common language runtime with productivity benefits. VB.Net has numerous strong programming features that make it endearing to multitude of programmers worldwide. VB.NET is implemented by .NET framework. Therefore, it has full access to all the libraries in the .Net Framework. The .Net framework is a revolutionary platform that helps you to write the following types of applications:
-
• Windows applications
-
• Web applications
-
• Web services
The .Net framework applications are multi-platform applications. The framework has been designed in such a way that it can be used from any of the following languages: Visual Basic, C#, C++, Jscript, and COBOL etc. All these languages can access the framework as well as communicate with each other. The .Net framework consists of an enormous library of codes used by the client languages like VB.Net. These languages use object-oriented methodology.
Applications communicate with a database, firstly, to retrieve the data stored there and present it in a userfriendly way, and secondly, to update the database by inserting, modifying and deleting data. Microsoft ActiveX Data Objects.Net (ADO.Net) is a model, a part of the .Net framework that is used by the .Net applications for retrieving, accessing and updating data. Microsoft ActiveX Data Objects.Net (ADO.Net) is a model, a part of the .Net framework that is used by the .Net applications for retrieving, accessing and updating data. ADO.Net object model is nothing but the structured process flow through various components [23].
MS-Access is powerful database system that offer several functionalities related to database tasks and has been widely used as backend tool for developing several applications. In this regard, VB.Net and MS-Access are considered as a front-end and back end tool for the development of the proposed model. The user interface and the coding part are achieved through the VB.Net while MS-Access is utilized for the back end purpose.
-
VI. Software Tool Description
Creating a software system using a software engineering process contains three main tasks or phases: the functions and features of the expected software have to be defined, the software has to be implemented and it has to be deployed in an operating environment. The functions and features of the expected software are called requirements [24].This study is designed to see how the proposed software might increase accuracy and reliability. The parameters for software construction should primarily aim at the following primary characteristics:
-
• Functionality, reliability, usability, efficiency and maintainability
-
• Provide strong interaction with the database –
most importantly for fetching and storing data
-
• Establish strategies for construction (coding
standards and naming conventions).
-
• Offer great ease of operability
-
• Customized user interface to meet the requirements
-
• Provide support for needed update and delete operations
-
• Minimize error handling.
The proposed software is designed and built using VB.Net and the software interface is shown below in Fig. 2. The interface comprises of a main menu that has five buttons – ‘Create’, ‘C-Table’, ‘T-Table’, ‘Reports’ and ‘Exit’. The ‘Create’ button facilitates the creation and management of product, customers and firms. The ‘C-Table’ and ‘T-Table’ buttons facilitates the building of the Customer Table and Technical Table respectively. The ‘Reports’ button facilitates the generation of various reports which can then be printed. Lastly an ‘Exit’ button can be used to end or exit the application.
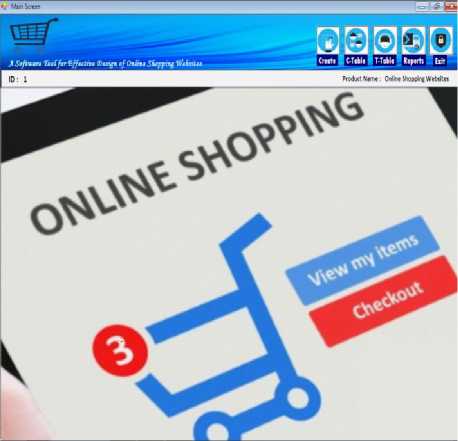
Fig.2. Software Interface
The interface shown is for a complete QFD application. As this paper only considers the generation of CNs, only the related menus are discussed. The ‘Create’ menu allows user to create Customers, Competitors or Firms and Technician and then it facilitates for creating or entering collected customer data i.e. Customer Voices followed by generation of CNs through affinity process. When the application is run, the user views the screen as shown in Fig. 2. As a first step the Customers are created by clicking ‘Create’ button. This pops up the form as shown in Fig. 3. This form allows user to create Customers, Competitors or Firms and Technician. This can be done by specifying what the user wants to create in ‘Create New’ option on form. In order to create new Customer, the user needs to enter ‘Customer’ in ‘Create New’ option. The information is entered and then saved to database by clicking the ‘Save’ button. Created Customers can be modified and deleted using ‘Edit’ and
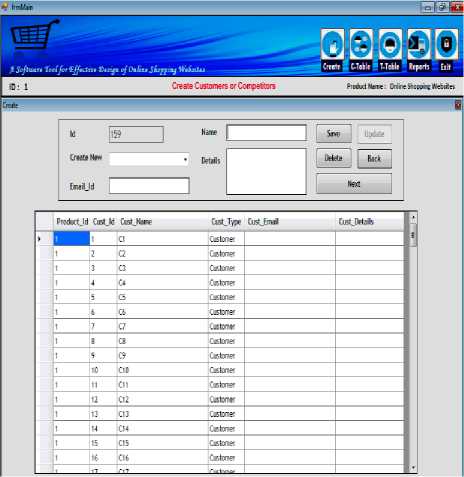
Fig.3. Create Customers
‘Delete’ button. The next step is to input Customer Voices (CVs) and then save them to the database. This is done by activating the ‘Next’ button of the form shown in Fig. 3 which pops up the form as shown in Fig. 4. When done the ‘Next’ button is invoked to jump to next window in order to filter the CVs. Filtering CVs involves removing repetitive data, identifying similar set of elements, negative statements and then replacing them by some meaningful information. This is done using Fig. 5. As seen the form presents the CVs each preceded by checkbox to allow for multiple selections of CVs and then replacing them by entering ‘Replacement Value’. The data can be modified, deleted or saved to the database. Once the CVs are filtered, the last step is to arrange the data in organized form in tree structure through brainstorming by generating the tree structure and generating CNs. This can be done by clicking ‘Next’ button which brings the form to generate CNs as shown in Fig. 6. The interface comprises of two sections left and right section that houses the ActiveX controls – ‘Listview’ and ‘Treeview’ respectively. The product for which the
CNs is to be generated is listed as root element in Treeview by default. The interface employs a set of buttons to facilitate the organization of elements. The buttons carry out the following functions - Create, Delete and Rename groups.
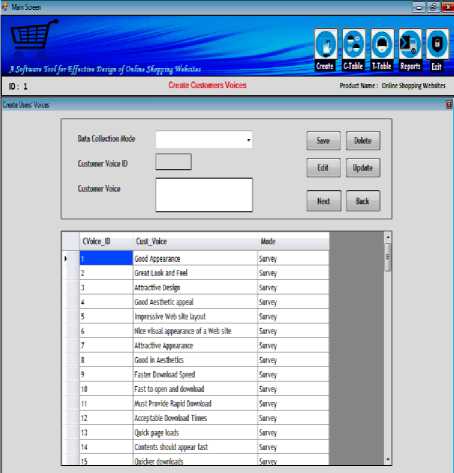
Fig.4. Input Customer Voices
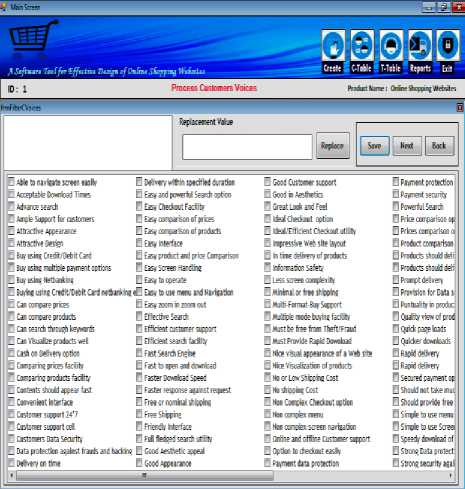
Fig.5. Filter Customer Voices
The last two buttons on the toolbar provides customized viewing as ‘Normal View’ and ‘Full Screen View’. In ‘Normal View’ both the windows are visible while in
‘Full Screen View’ only ‘Treeview’ in maximized state is shown to have a better view of structured data. Further a ‘Save’ button is provided to save the generated structure to the database. Finally, ‘Exit’ button is provided to close the application. The Affinity software system is not only designed to structure needs, it is a rather universal and flexible module that can handle any kind of data, e.g. Design Characteristics, Functions, or Concepts. The Affinity Process comprises of several steps and is usually conducted from start to the end.
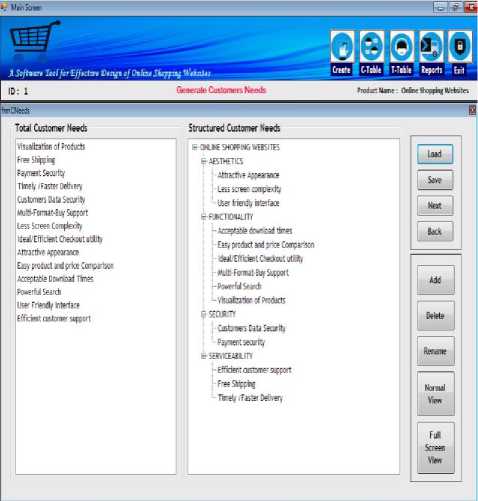
Fig.6. Generate Customer Needs (CNs)
However, there are situations where the process needs to be completed in sections and thus it is necessary to resume the previous work rather than starting it all over again. For this, the data can be saved to the database and then recalled when needed. Thus, the developed system allows for working in both ‘Start-to-End’ and ‘Resume’ modes. The ‘Load’ button can be used to avail this functionality. When ‘Load’ button is activated, it brings the saved tree structure from the database and loads it in ‘Treeview’. The ‘Add’ and ‘Delete’ buttons can be used to create and delete groups. The elements from the ‘Listview’ can be drag and drop onto any group. To move an item from ‘Listview’ to ‘Treeview’, select an item, drag this item and drop it on the group in ‘Treeview’. This places a “+” sign in front of the group to which the item is added to serve as an indication of existence of child elements for that group.
The process continues until all items are moved from the left section to the right section. The text of items and headings can be changed; deleted or new ones can be created. Further, items can be moved from one group to another or arranged within their group in the tree. The group can be expanded or collapsed by clicking on the sign in front. The “+” sign in front of the group depicts the collapsed mode of the group and thus items under the group cannot be visible. In order to browse these items, the “+” sign is clicked which switches it to expanded mode. This mode is represented by “-” sign. Thus a large number of items can be accommodated in the tree and the items are expanded when required.
Additionally, it is possible to move entire groups to another position within the tree structure. The system even allows moving elements to another position within the tree structure. This is especially useful when dealing with large amounts of data on trees with a deep level structure. This is done by ‘Drag and ‘Drop’ function but with the right mouse button. The added items can be deleted and renamed at any point of time. This is done by selecting the item and clicking the graphical buttons ‘Delete’ and ‘Rename’ respectively.
-
VII. Database for the Proposed System
The back end functionalities are achieved through the MS-Access database tool. The MS-Access database was used to store and interpret the data. MS-Access database is simple to use and contains all the essential features. MS-Access is powerful database tool that offer several functionalities related to database tasks and has been widely used as backend tool for developing several applications. Thus, to accomplish the software realization of the Affinity Process, an enlargement of the data structure for the tables to be used is required. The required schemas, definitions and their descriptions are listed below.
-
A. Tables Definitions and Purpose
tblProduct: Product_Id, Product_Name, Product_Details This table is used to store the ‘Element’ on which QFD is to be applied. It could be a product or process. Here, it refers to ‘Online Shopping Websites’. The Product_Id attribute is primary key and is unique for each product.
tblCustomers: Product_Id,Customer_Id, Customer_Name, Customer_Type, Customer_Details
This table is used to store the ‘Customers’ and ‘Competitors’. The Competitors represent the other parties involved in online shopping businesses. The Customer_Type attribute stores the type of entry as Customers or Competitors.
tblCustomer_Voices: Product_Id, Customer_Voice_Id, Customer_Voice, Mode
This table is used to store the ‘Customers Voices’ gathered or collected through market research techniques.
tblCustomer_Needs: Product_Id, Customer_Need_Id, Customer_Need
This table stores the finalized ‘Customers Needs’ generated by processing the filtered collected ‘Customers Voices’.
tblCustomer_Needs_TreeMode: Product_Id, nRelation, nkey, ntext
This table stores the finalized tree structure of ‘Customers Needs’ along with data at primary, secondary and tertiary level.
-
VIII. Conclusions
This research work considers QFD approach for effective design of online shopping websites and in this context attempts to develop a software tool to generate customer needs for effective design of online shopping websites. The tool integrates Affinity process to transform the collected Customers Voices into Customer Needs which forms an important basis in QFD. An Affinity Process integrated software tool will not only reduce the unnecessary onus but also assists in producing results in more effective and accurate manner. The system is developed using VB.Net that integrates an MS-Access database. The use of VB.Net with MS-Access database is found to be very effective in producing the system under windows environment. Besides the software realization of Affinity Process, the system incorporates certain features like ‘Full Screen View’, ‘Save Tree’, ‘Load Tree’ etc., which add new dimension to the tool. The system also facilitates all the needed operations for creating and organizing items like add, rename, move and delete.
Moreover, in QFD there are situations where at times the Affinity Process cannot be completed in one go and thus it is necessary to resume the previous work rather than starting it all over again. For this, the data need to be saved to the database and then recalled when needed. The developed tool also facilitates this feature. The research carried out highlights the significance of generation of Customer Needs which is missing in available QFD softwares and attempts to fill this gap through this software tool. The research work will give exposure to developers as to how it can be suitably implemented in QFD software. The software tool is a user friendly and efficient, which would offer great ease of operability comfort and would significantly save time and effort. This software tool will greatly assists designers and engineers in dealing with the voluminous unstructured data collected from the customers to produce an organized segmentation of customer needs to be used in subsequent stage of the QFD process which in turn will result in effective web designing of online shopping websites.
References A Novel Software Tool to Generate Customer Needs for Effective Design of Online Shopping Websites
- H. M. Kuo, “Discussion of the interfering factors for internet shopping”, Conference on Theories and Practices in International Business, Chang Jung Christian University, 2006.
- H. M. Kuo, and C. Chen, “Application of Quality Function Deployment to improve the quality of internet shopping website interface design”, International Journal of Innovative Computing, Information and Control ICIC International, vol. 7, no. 1, pp.253-268, 2011.
- T. Johnson, and D. Griffith, “5 steps to online success”, Marketing Management, vol. 11, pp.34–39, 2002.
- A. K. Sharma, I. C. Mehta, and J. R. Sharma, “Development of fuzzy integrated quality function deployment software – a conceptual analysis”, I-Manager's Journal on Software Engineering, vol. 3, no. 3, pp.16–24, 2009.
- S. Mizuno, Company-Wide Total Quality Control, Asian. Productivity Press, Cambridge, 1998.
- G. H. Mazur, “Lifestyle QFD: Incorporating emotional appeal in product development”, The 17 symposium on QFD, Portland, 2005.
- S. Shoji, A. Graham and D. Walden, A New American TQM (Portland, OR, Productivity Press), 1993.
- J. S. Cruz, and F. Tamayo, “QFD application for tackling Internal Customers Needs as a base for building a Lean Manufacturing System”, Lean Manufacturing, The 9th International Symposium on QFD (ISQFD'03) and The 15th Symposium on QFD 2003.
- J. Antony, “Six Sigma in the UK service organizations: results from a pilot survey”, Managerial Auditing Journal, vol. 19, no. 8, pp. 1006-1013, 2014.
- M. Valtasaari, “Design for Customer Needs: Utilization of Quality Function Deployment in Product Development”, Masters Thesis: Lappeenranta University of Technology 2000.
- RT. K. Fung, and K. Popplewell, “The analysis of customer requirements for effective rationalization of product attributes in manufacturing”, in: Proceedings of 3rd International Conference on Manufacturing Technology, Hong Kong. 1995.
- L. Cohen, “Quality Function Deployment: How to make QFD work for you”, J W Wesner (Ed) Reading MA: Addison-Wesley Publishing Company 1995.
- B. King, “Better designs in half the time - Implementing QFD: Quality Function Deployment in America,” 3rd Ed Methuen MA: GOAL/QPC, 1989.
- M. C. Lin, C. Y. Tsai, C. C. Cheng and C. A Chang, “Using Fuzzy QFD for Design of Low-end Digital Camera,” International Journal of Applied Science and Engineering,” vol. 2, no.3, pp.222-233, 2004.
- A. Griffin, “Evaluating QFD’s use in U.S. firms as a process for developing products”, Journal of Product Innovation Management, Michigan, USA 1992.
- J. R. Hauser, and D. P. Clausing, “The House of Quality,” Harvard Business Review, vol.66, pp.5-6 63-73. 1988.
- C. P. M. Govers, “What and how about Quality Function Deployment (QFD),” International Journal of Production Economics, vol. 46-47, pp.575-585, 1996.
- J. Terninko, Step by Step: Customer Driven Product Design, Nottingham, New Hampshire, USA, 1995.
- R. G. Day, “Quality Function Deployment - Linking a Company with its Customers, Milwaukee,” Wisconsin, USA, 1993.
- Siliconfareast, 2004 http://www.siliconfareast.com/affinity.htm.
- Skymark, 2009, http://www.skymark.com/resources/tools/affinity_diagram.asp.
- A. K. Sharma, I. C. Mehta, and J. R. Sharma, “Development of fuzzy integrated quality function deployment software – a conceptual analysis,” I-Manager’s Journal on Software Engineering, vol. 3, no. 3, pp.16–24, 2009.
- Tutorialspoint.com, http://www.tutorialspoint.com/vb.net/
- T. Kivinen, “Applying QFD to improve the requirements and project management in small-scale project, “University of Tampere, Department of Computing Sciences, Computer sciences, 2006.
