A Novel Vehicle Classification Model for Urban Traffic Surveillance Using the Deep Neural Network Model

Author: Kamini Goyal, Dapinder Kaur
Journal: International Journal of Education and Management Engineering(IJEME) @ijeme
Article in issue: 1 vol.6, 2016.
Free access
The vehicle detection is the backbone of the urban surveillance systems, which is used to obtain and identify the various statistics of the urban vehicular mobility. Also the urban surveillance systems are used for the vehicle tracking or vehicular object classification. The proposed model has been designed for the purpose of the urban surveillance and vehicular modelling of the traffic. The proposed model has been designed for the vehicle position identification as well as the vehicle type classification using the deep neural network. The proposed model has been tested with a standard dataset image for the result evaluation. The experimental results has been shown the effectiveness of the proposed model, where the proposed model has been found successful in detection and classification of all of the vehicles in the given image.
Deep Learning, Deep Neural Network, Urban Surveillance, Vehicle Classification, Vehicle Detection
Short address: https://sciup.org/15013855
IDR: 15013855
Text of the scientific article A Novel Vehicle Classification Model for Urban Traffic Surveillance Using the Deep Neural Network Model
1. Introduction 1.1. Vehicle Detection
Vehicle detection is defined as detecting the vehicles on the basis of parameters such as color, shape and size. Vehicles are detected usually by extracting the vehicle queues from the satellite images. The vehicles can be detected with the help of neural network i.e. convolutional neural network. The complete system is trained in order to classify, locate and detect the objects in images. Hence this can improve the accuracy of classification, detection and localization. The network can be applied at multiple locations in the image using the sliding window technique. Then the system is trained to produce prediction of the size and location of bounding box. A technique is defined to perform object localization with convolutional network based segmentation. The central * Corresponding author. Tel.:
E-mail address:
pixel of viewing window is classified as a boundary between the regions. While categorizing the regions, semantic segmentation is performed [1]. A vehicle crash test method is defined in order to access the crashworthiness of the vehicle. Visual inspection like car acceleration is used to access the overall safety of car. But it was costly, complex and takes more time. Therefore a technique is defined to reproduce the kinematics of car during a collision by using NAR model i.e. Non linear autoregressive model to determine the estimated parameters by using a fee forward neural network. NAR model is derived from NARMA i.e. Non linear autoregressive with moving average. This model is used to predict the kinematic responses such as acceleration, velocity and displacement of car during the collision [2].
Monocular vehicle detection defines the feature extraction paradigm which is based on machine learning. This technique works when the vehicle is completely visible. The vehicle detection technique is mainly divided into two types i.e. appearance based and motion based. Appearance based approach is used to recognize the vehicles directly from images i.e. from pixels to vehicles and motion based approach requires the sequence of images so as to recognize the vehicles. To detect the object, clustering was used that was implemented by using modified version of iterative closest point that can be done by using the polar coordinates to segment objects. Vision- based vehicle detection, vehicle tracking and behaviour analysis on road is also defined in which the vision- based vehicle detection is placed in context of sensor- based on- road perception. The progress in vision- based vehicle detection is also defined for monocular and stereo- vision sensor configurations and analyzation of filtering, estimation and dynamic models is also defined. The state of art in on- road behaviour analysis is reviewed addressing the context analysis, long term motion classification and prediction. The vehicle tracking is also discussed in which vision, detailed image plane and 3D techniques for modelling, filtering vehicle dynamics on the road is used [3].
-
1.2. Image Classification
Image classification can be defined as classifying the image into pixels and the image classification systems contains two parts i.e. bag- of- features (BOF) and spatial pyramid matching (SPM). The BOF technique represents the image as a histogram of local features and it is incapable of capturing the shapes or locating an object. The various steps are used to classify the image i.e. extract and represent patches, generate the code words, encode and pool features. The SPM technique is used to divide the image into finer spatial sub- regions and then computes the histograms of local features from every sub- region [4]. Image classification is used to assign one or more category labels to the image. The image classification approach contains three computational steps i.e. descriptor coding, spatial pooling and image classification. In descriptor coding, each descriptor of an image is mapped in order to form a high- dimensional sparse vector and in image classification, image level feature vector is normalized and fed into a classifier [5].
-
1.3. HDCNN
Hybrid deep neural network can be defined as the detection of small objects like vehicles in satellite images. Deep neural network has demonstrated robustness to distortion as it is used to extract the features of same scale [6]. Convolutional neural network is a network that contains number of feature maps i.e. a convolution layer. Every neuron in convolution layer receives input from a local receptive field that represents the features of some frequency range. On the top of convolution layer, a pooling layer is added in order to compute a low resolution representation of convolution layer activations by sub- sampling. The pooling function is applied to neurons with a window of frequency bands. A max pooling function is used to compute the maximum value of the feature. The max pooling layer activations are divided into M bands where each band receives the input from r convolution layer of neighbouring bands [7]. A convolution layer consists of a set of filters that is used to process the small local parts of input where the filters are duplicated along the complete input space. Convolutional neural network describes various local filters, max pooling layers and weight sharing [8].
Convolutional neural networks are also used to reduce the spectral variations and spectral correlations that are present in the signals [9]. Deep neural network can be defined as a feed forward neural network that contains more than one hidden layer which consists of neurons. The neuron takes all the output of lower layer as input and then multiplies them by weight vector and the result is added and passed through a non- linear activation function. To recognize the pattern by using the convolutional network, the input data is organised as a number of feature maps that are fed into the convolutional layer. In order to pretrain the dynamic neural network (DNN), a restricted Boltzmann machine (RBM) is used as a basic building block that is used to model the probability distribution of data. RBM contains hidden units that are used to compute the feature representation of the input data. All the weights of RBM are used as an initialization for one layer of DNN [10].
1.4. NMF
2. Experimental Design
Nonnegative Matrix Factorization (NMF) can be defined as a dimension reduction technique for analyzing the patterns and it takes only non- negative values i.e. only positive values. Data clustering is used in this which is an unsupervised learning problem that is used to find the unknown groups of same data. K- means clustering is also used in order to minimize the sum of squared distances between each data point and also the centre of cluster. NMF finds a low rank approximation of the data matrix where the factors that give the low rank approximation are non- negative [11]. Sparseness constraints are added to NMF that defines a scheme in which only a few units are used in order to represent the vectors of data. NMF is constrained so as to find the solutions with desired degree of sparseness [12]. It can also be applied to audio spectra in which the signal consist of two band limited noise bursts with magnitude spectra constant over time. In this the probability of two or more activation patterns that are active together is low [13]. Non- negative matrix factorization can also be defined as minimization problem with bound constraints in which a block of variable is minimized under corresponding constraints and the remaining blocks are fixed. For bound constrained optimization, projected gradient methods are used and using these methods, alternating non- negative least squares are also used [14].
The proposed model has been designed for the vehicle detection in the satellite or aerial images for the purpose of active urban surveillance applications. The proposed model has been tested over the standard image set taken from the online educational resources and is a royalty free image. A high resolution image has been considered for the purpose of vehicle detection and classification system demonstration for the real time scenario based performance evaluation. The image is containing the clearly visible vehicular objects, out of which five are the buses and eight are the cars. There are total of thirteen objects in the test image. The whole project has been written around the single image only.
The above image has been taken from the dataset of Stanford University, Stanford, United States [15]. The above image has been selected out of the other high resolution urban images taken by the satellites and aerial cameras. The selected image clearly shows the vehicles in the Oxford Circus square, London.
The proposed system has been designed around the standard image given in the simulation. The vehicle detection and classification objectives have been thoroughly evaluated over the given image.
The proposed model is based upon the amalgamation of the neural network with non-negative matrix factorization along with other image processing techniques such as image de-noising and vectorization has been used for the purpose of the vehicle detection and classification. The hybrid deep neural network (HDNN) has been utilized to fulfil the purpose of vehicular classification in the proposed model. Deep learning is the sub-branch of machine learning methodology, which is entirely based upon the high-level data abstractions fundamentalized with model architecture with complex structure or other non-linear transformations in the composition of multiple objects. The deep learning model of deep neural network has been applied over the various image processing application, data mining, object recognition, NLP, ASR, etc, where this approach has been performed remarkably well, which is the inspiration behind the use of the deep neural network in our research project of vehicular detection model. The hybrid deep neural network is the structure defined on the fundamentals of artificial neural network equipped with the multiple numbers of hidden layers for the defined units between the output and input layers of the neural network results. The deep neural networks are primarily designed for the modelling of complex non-linear relationships. For the purpose of object detection, the deep neural network generates the compositional models for the expression of the layered composition of the image primitives in the given feature set or object set. The addition or utilization of extra layers adds up the advantage of enhanced feature composition, which enables the capability of modelling the complex data with fewer units than a similarly performing shallow network.
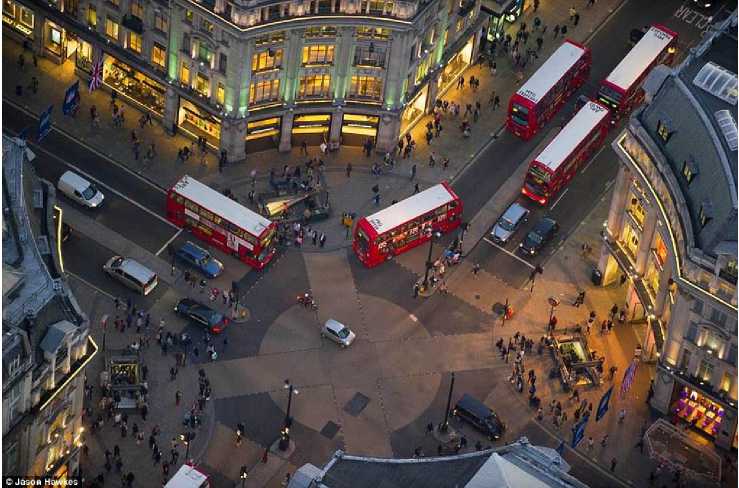
Fig.1. The Test Image for the Vehicle Classification Model
A Deep Neural Network for the standard backpropagation algorithm can be discriminatively trained under the specific model requirements. The neural network weight updates can be possibly calculated using the stochastic gradient descent using the formula defined in the following equation:
Wy (t+1) = Wy (t) + n£-
Where n is the learning rate, C is cost function. The choice of cost function is based upon various factors like learning model type of unsupervised, supervised, etc or the neural activation function. The standard cost function is used for the cost evaluation is the softmax function, which can be defined as the following:
( )
P; = ∑ к exp( ^k )
Where Pj is the class probability, Xj and ■^k are the total input to units j and k. The cross entropy is defined as the
C = - ∑ dj log ( Pi )
where ^7 represents the target probability for output unit j and Pj is the probability output for j after applying the activation function.
3. Basic Design of the Proposed System
The basic design of the proposed system defines the flow of work and also defines the algorithm level design and pseudo code. In flow of work, the image is acquired and loaded into the run time memory. Then the preprocesing technique is used by applying the median filter which is used to remove the salt and pepper noise. Non- negative matrix factorization (NMF) is applied to minimize the size of feature descriptor size and then the image vectorization is done and the target features are extracted from the image and marked as the detected objects. The features that are extracted are passed to the hybrid deep neural network (HDNN) for classification of the type of vehicle. The position of the detected vehicle is marked by differentiating the vehicles. The flow of work is shown as below:
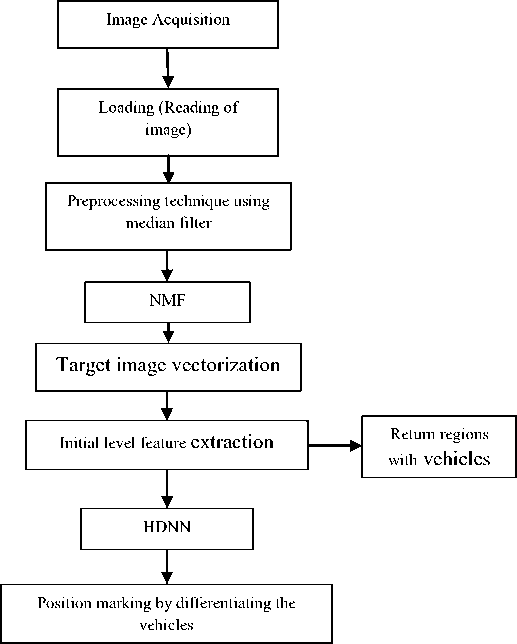
Fig.2. Basic Design of the Proposed System
Algorithm level Design
In algorithm level design, a deep neural network algorithm is defined which is based on the vehicle classification from the satellite images. Then a pseudo code of this algorithm is defined that explains the complete code step by step. The algorithm is explained as below:
Algorithm 1: Deep neural network based vehicle classification from satellite images
-
1. The image is loaded into the runtime memory by using the image acquisition model.
-
2. The median filter is applied over the image loaded in the runtime memory in order to remove the salt
-
3. Non-negative matrix factorization (NMF) is applied over the image after de-noising for the minimization of the feature descriptor size to lower the size of neuron by removing the minima order neurons from the neuron selection.
-
4. The vectorization is performed to validate the data in the vectorized form for the neural network model.
-
5. The targeted features are extracted from the image and marked as the detected objects.
-
6. The extracted features are passed over to the hybrid deep neural network (HDNN) for the vehicle type classification by using the 15 layer neural model with approximately 5000 input and output size of neurons.
-
7. Mark the position of the detected object with different colours defined for the different types of the objects.
and pepper noise from the image, which is the most common noise type available in the satellite imagery or aerial imagery.
Pseudo Code
Begin
Load the Image.
Im= selectionWindow(FolderName, FileName);
Im=readImage([FolderName FileName]);
Return Im.
Apply Median Filter on Im.
Imf = median2d(Im,windowSize, Intensity);
Return Imf.
Apply Nonnegative matrix factorization on Imf.
Nmf = nmf(Imf, [colSize rowSize]);
Return Nmf{1,2,3…..N}.
Perform Vectorization over Nmf and Imf.
Imfd1 = Imf(:,:,1);
Imfv1 = Imfd1(:);
Imfd2 = Imf(:,:,2);
Imfv2 = Imfd2(:);
Imfd3 = Imf(:,:,3);
Imfv3 = Imf3(:);
Nmf(1,2,3…. N) = Nmf(:);
VecData{1,2,3… N} = {Imfv1 Imfv2 Imfv3 Nmf(1,2,3…N)};
Return VecData{1,2,3…..N}.
Locate the feature locations in the image on VecData.
LocationVector(id, xn, yn) = getLocation(VecData, {ApperanceModel});
LocationArray{(X1, Y1), (X2, Y2)………(Xn, Yn)} = LocationVector(id, xn, yn) Return LocationArray{(X1,Y1), (X2,Y2), (X3,Y3) ……. (Xn,Yn)}.
Classification of the objection types Im and LocationArray.
ClassifiedData{ t1, t2, t3 ….. tN} = nn (TrainData, LocationArray(Xn, Yn))
Return ClassifiedData{ t1, t2, t3 ….. tN}.
Mark classification on Imf with ClassifiedData.
End
4. Result Analysis 4.1. Performance Parameters
Precision
Precision can be defined as the ratio of relevant retrieved documents and the information needed by the users. High precision defines that the algorithm returns results that are relevant as compared to irrelevant results. It also defines a predictive value that is positive and this is defined in terms of the binary classification. This classification defines the documents that are retrieved. It is defined in terms of the results that the system returns at some cut-off rank. Precision is also known as sensitivity.
Precision= TP/ (TP+FP)
Where,
A= True Positive
B= True Negative C= False Negative D= False Positive
Recall
Recall is the probability that a test will indicate ‘test’ among those with the matching sample.
Recall= A/ (A+C) * 100
Positive Predictive Value
Positive predictive values are influenced by the prevalence of correct results in the population that is being tested. If we test in a high prevalence setting, it is more likely that persons who test positive truly have matching probability than if the test is performed in a population with low prevalence.
Negative Predictive Value: A/(A+B) × 100
Accuracy
The percentage of the result success out of the whole results is called accuracy. Accuracy is also known as success rate.
Accuracy= (Correct Results/ Total Results) *100
False Acceptance Rate (FAR)
It is defined as the fraction of the system that do not matches the patterns of input correctly to the template that is non-matching. It defines the percentage of inputs that are not valid. False acceptance rate is dependent on the threshold. It is also defined as the measure that an attempt by the user that is unauthorized will be accepted by the biometric security system.
False Rejection Rate (FRR)
False rejection rate is defined as the probability of a system to detect the matching between the pattern that is given as input and the matching template. It is the fraction of number of false rejections to the number of attempts that are identified. It defines a measure that an attempt by the user that is unauthorized is rejected by the biometric security system.
Table 1. The Statistical Analysis Parameters
|
True Positive |
13 |
|
True Negative |
0 |
|
False Positive |
0 |
|
False Negative |
0 |
Table 2. The Parametric Results Obtained From the Simulation
|
PARAMETER |
VALUE |
95% CI |
|
Sensitivity or Precision |
100.00% |
75.29% to 100.00% |
|
Recall |
100.00% |
75.29% to 100.00% |
|
Accuracy |
100.00% |
75% to 100% |
|
Positive Predictive Value |
100.00% |
75.29% to 100.00% |
|
Result Prevalence |
100.00% |
75.29% to 100.00% |
|
False Acceptance Rate |
1.00 |
1.00 |
|
False Rejection Rate |
0.00 |
0.05 |
Table 3. The Table of Comparison of FAR of Different Methods on Vehicle Test Set
|
Method |
Given Recall Rate 95% CI |
|
DNN [2] |
23.5 |
|
HOG+SVM [19] |
67.5 |
|
LBP+SVM [20] |
87.6 |
|
Adaboost [21] |
91.6 |
|
Proposed |
5.0 |
The proposed model results have been obtained in the form of various performance parameters. The proposed model has been programmed to return the results in the form of elapsed time along with the image marked with the vehicular object markings. The proposed model has been designed to detect and classify the vehicular objects in the given image by using the different colours to mark the different types of objects. The proposed model has been tested with the standard image for the vehicle detection for the urban surveillance in the high resolution satellite images. The experimental results have been obtained from the simulation model.
The proposed model output has been designed in the way to perform all of the operations in the sequential order as per the system design. The simulation model detects the buses in the gray colour whereas the cars in the brown colour. The proposed model has been designed to detect and track the vehicular objects only and not the pedestrians or any other objects in the given test image. All the vehicles that are contained in the image are required to be shown as detected i.e. all the vehicles should be considered as detected. The result snapshots have been given as following:
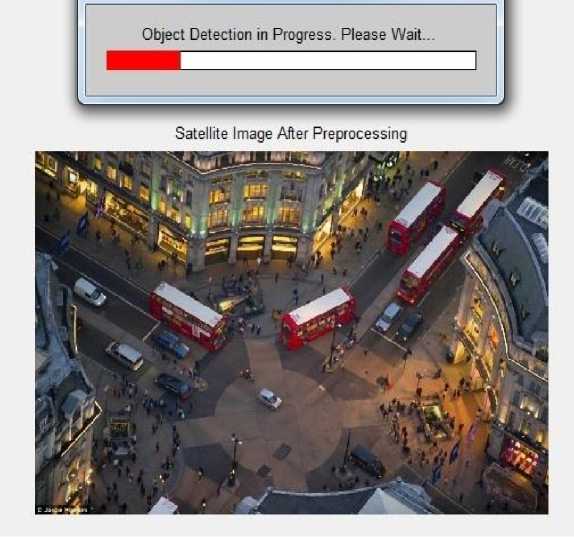
Fig.3. The Vehicle Position Detection In Progress
The image is loaded into the runtime memory by using the image acquisition module. The image is loaded into the runtime memory and converted to the 3-D image matrix, which is further converted into the vectorized formation.
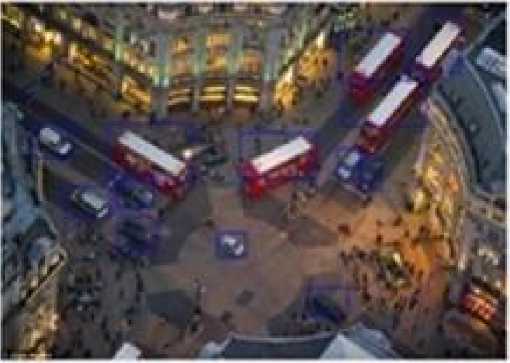
Fig.4. The Feature Extraction and Vehicle Detection
The features of the vehicles are extracted and the vehicles are detected and represented by box.
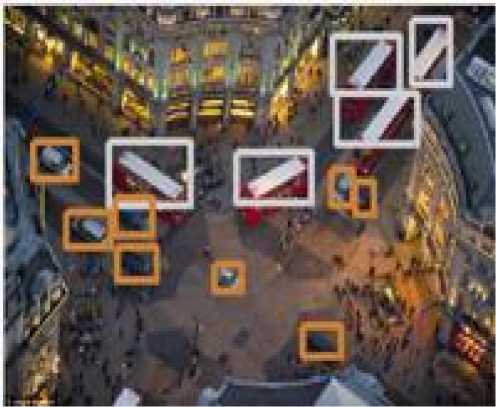
Fig.5. The Vehicle Classification And Type Recognition Model
The above image is showing the detected vehicle types after applying the neural classification over the object extraction process. The above is showing 13 vehicles and has been taken from the Oxford Circus Square, London. The object extraction is based upon the supervised appearance model, which detect the visible objects looking like vehicles. The vehicles are then classified using the neural network classifier and has been defined using the different colours, The heavy vehicles (Buses) has been shown in the white colour and the cars and other car-like vehicles has been shown in the orange color.
Table 4. The Time Based Analysis of the Various Objects in the Given Image
|
Index |
Detection Time in seconds |
|
1 |
22.73 |
|
2 |
24.23 |
|
3 |
40.72 |
|
4 |
31.00 |
|
5 |
11.18 |
|
6 |
6.73 |
|
7 |
6.23 |
|
8 |
8.59 |
|
9 |
6.57 |
|
10 |
2.26 |
|
11 |
4.78 |
|
12 |
2.43 |
|
13 |
4.79 |
The detection time has been recorded in the measure of seconds. The proposed model has been evaluated for the elapsed time of object detection for all 13 objects.
Table 5. The Time Based Analysis for the Classification of Vehicular Various Objects in the Given Image
|
Index |
Classification Time in seconds |
Detection Vehicle Type |
|
1 |
235.494521 |
Bus |
|
2 |
233.451852 |
Bus |
|
3 |
233.986641 |
Bus |
|
4 |
233.513091 |
Bus |
|
5 |
231.959688 |
Bus |
|
6 |
230.941445 |
Car |
|
7 |
230.195462 |
Car |
|
8 |
235.350409 |
Car |
|
9 |
234.204847 |
Car |
|
10 |
234.863487 |
Car |
|
11 |
242.419633 |
Car |
|
12 |
233.599520 |
Car |
|
13 |
234.427686 |
Car |
The classification time has been also recorded in the time length units of seconds. The proposed model has been evaluated for the elapsed time of object classification using the neural network on all of the 13 vehicular objects.
Classification Time in seconds
^^^^^™ Classificatio n Time in seconds
Vehicle Objects
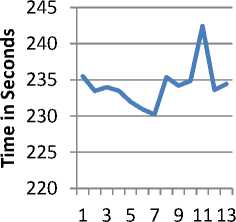
Graph 1. The Classification Time Graph
The classification time has been plotted in the form of the graph to visualize the variation in the different object classification to know the performance lags and to estimate the visual averaging factor.
Detection Time inseconds
Vehicle Objects
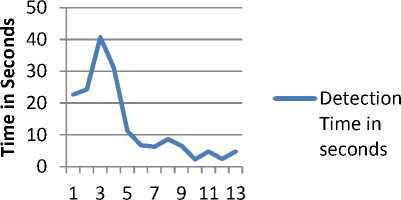
Graph 2. The Detection Time Graph
The object detection time has been also evaluated for the detection time graph. The detection time is time taken for the supervised appearance based feature detection and extraction model.
5. Conclusions
The above table has been recorded with the elapsed time for the vehicle recognition and vehicle detection transactions performed in the proposed model. The average classification time has been found around 234 seconds in the all 13 transactions to recognize the 13 vehicular objects in the simulation. Also the detection time has been recorded from the simulation, which has been recorded around 6 seconds on an average for the all 13 transactions. The proposed model have correctly identified the all of the vehicular objects in the given test image for the experiments. The experimental results have shown the effectiveness of the proposed model in the case of vehicle detection and classification. The proposed model has been proved to be efficient and robust object classification system. In the future, the proposed model can be applied on some of the standard vehicular dataset. The proposed model can be also tested with the video data for the vehicular detection and classification purposes.
References A Novel Vehicle Classification Model for Urban Traffic Surveillance Using the Deep Neural Network Model
- Sermanet, Pierre, David Eigen, Xiang Zhang, Michaël Mathieu, Rob Fergus, and Yann LeCun. "Overfeat: Integrated recognition, localization and detection using convolutional networks." arXiv preprint arXiv: 1312.6229 (2013).
- Pawlus, Witold, Hamid Reza Karimi, and Kjell G. Robbersmyr. "Data-based modeling of vehicle collisions by nonlinear autoregressive model and feed forward neural network." Information Sciences 235 (2013): 65-79.
- Sivaraman, Sayanan, and Mohan Manubhai Trivedi. "Looking at vehicles on the road: A survey of vision-based vehicle detection, tracking, and behavior analysis." Intelligent Transportation Systems, IEEE Transactions on 14, no. 4 (2013): 1773-1795.
- Wang, Jinjun, Jianchao Yang, Kai Yu, Fengjun Lv, Thomas Huang, and Yihong Gong. "Locality-constrained linear coding for image classification." In Computer Vision and Pattern Recognition (CVPR), 2010 IEEE Conference on, pp. 3360-3367. IEEE, 2010.
- Zhou, Xi, Kai Yu, Tong Zhang, and Thomas S. Huang. "Image classification using super-vector coding of local image descriptors." In Computer Vision–ECCV 2010, pp. 141-154. Springer Berlin Heidelberg, 2010.
- Chen, Xueyun, Shiming Xiang, Cheng-Lin Liu, and Chun-Hong Pan. "Vehicle detection in satellite images by hybrid deep convolutional neural networks." Geoscience and Remote Sensing Letters, IEEE 11, no. 10 (2014): 1797-1801.
- Abdel-Hamid, Ossama, Li Deng, and Dong Yu. "Exploring convolutional neural network structures and optimization techniques for speech recognition." In INTERSPEECH, pp. 3366-3370. 2013.
- Abdel-Hamid, Ossama, Abdel-rahman Mohamed, Hui Jiang, and Gerald Penn. "Applying convolutional neural networks concepts to hybrid NN-HMM model for speech recognition." In Acoustics, Speech and Signal Processing (ICASSP), 2012 IEEE International Conference on, pp. 4277-4280. IEEE, 2012.
- Sainath, Tara N., Abdel-rahman Mohamed, Brian Kingsbury, and Bhuvana Ramabhadran. "Deep convolutional neural networks for LVCSR." In Acoustics, Speech and Signal Processing (ICASSP), 2013 IEEE International Conference on, pp. 8614-8618. IEEE, 2013.
- Abdel-Hamid, Ossama, Abdel-rahman Mohamed, Hui Jiang, Li Deng, Gerald Penn, and Dong Yu. "Convolutional neural networks for speech recognition." Audio, Speech, and Language Processing, IEEE/ACM Transactions on 22, no. 10 (2014): 1533-1545.
- Kim, Jingu, and Haesun Park. "Sparse nonnegative matrix factorization for clustering." (2008).
- Hoyer, Patrik O. "Non-negative matrix factorization with sparseness constraints." The Journal of Machine Learning Research 5 (2004): 1457-1469.
- O'grady, Paul D., and Barak A. Pearlmutter. "Convolutive non-negative matrix factorisation with a sparseness constraint." In Machine Learning for Signal Processing, 2006. Proceedings of the 2006 16th IEEE Signal Processing Society Workshop on, pp. 427-432. IEEE, 2006.
- Lin, Chuan-bi. "Projected gradient methods for nonnegative matrix factorization." Neural computation 19, no. 10 (2007): 2756-2779.
- http://www.standard.co.uk/news/london/sky-at-night-amazing-photographs-from-londons-aerial-photographer-9017596.html?action=gallery&ino=6.
- O. Masato, S. Nishina, M. Kawato, "The neural computation of the aperture problem: an iterative process", Lippincott Williams and Wilkins, Vol. 14, pp. 1767-1771, 2003. B. Zhang, "Reliable classification of vehicle types based on cascade classifier ensembles", IEEE Transactions on Intelligent Transportation Systems, Vol. 14, pp. 322-332, 2013.
- N.C. Mithun, N.U. Rashid, S.M.M. Rahman, "Detection and classification of vehicles from video using multiple time-spatial images", IEEE Transactions on Intelligent Transportation Systems, Vol. 13, pp. 1215-1225, 2012.
- L. Unzueta, M. Nieto, A. Cortes, J. Barandiaran, O. Otaegui, P. Sanchez, "Adaptive multicue background subtraction for robust vehicle counting and classification", IEEE Transactions on Intelligent Transportation Systems, Vol. 13, pp. 527-540, 2012.
- Xue Mei, Haibin Ling, "Robust visual tracking and vehicle classification via sparse representation", IEEE Transactions on Pattern Analysis and Machine Intelligence, Vol. 33, pp. 2259-2272, 2011.
- C.T. Liu, H. Huo, T. Fang, D.R. Li, "Fault tolerant spatio-temporal fusion for moving vehicle classification in wireless sensor networks", IET Communications, Vol. 5, pp. 434-442, 2011.
- M. Shaoqing, L. Zhengguang, J. Zhang, "Real-time vehicle classification method for multi lanes roads", ICIEA 2009, pp. 960-964, 2009.
- M.A. Hannan, A. Hussain, A. Mohamed, S.A. Samad, "Development of an embedded vehicle safety system for frontal crash detection", International Journal of Crashworthiness, Vol. 13, pp. 579-587, 2008.
- A. Hussain, M.A. Hannan, A. Mohamed, H. Sanusi, A.K. Ariffin, "Vehicle crash analysis for airbag deployment decision", International Journal of Automotive Technology, Vol. 7, pp. 179-185, 2006.
- M.A. Hannan, A. Hussain, S.A. Samad, A. Mohamed, D.A. Wahab, A.K. Ariffin, "Development of occupant classification and position detection for intelligent safety system", International Journal of Automotive Technology", Vol. 7, pp. 827-832, 2006.
- M.A. Hannan, A. Hussain, S.A. Samad, K.A. Ishak, A. Mohamed, "A unified robust algorithm for detection of human and non-human object in intelligent safety application", International Journal of Signal Processing, Vol. 4, pp. 1304-4478, 2004.
- D.S. Timothy, M.M. Trivedi, "Real-time stereo-based vehicle occupant posture determination for intelligent airbag deployment", Proceedings of the IEEE International Conference on Intelligent Vehicles, pp. 570-574, 2003.
- L.W. Lan, A.Y. Kuo, "Development of a fuzzy neural network colour image vehicular detection (FNNCIVD) system", The IEEE 5th International Conference on Intelligent Transportation System, pp. 88-93, 2002.
- A. Mohan, C. Papageorgiou, T. Poggio, "Example-based object detection in images by components", IEEE Transaction on Pattern Analysis and machine Intelligence, Vol. 23, pp. 349-361, 2001.
- M. Klomark, Occupant Detection Using Computer Vision, Master's Thesis in Computer Vision, Linköping University, 2000.
- S. Peng, C.A. Harlow, "A system for vehicle classification from range imagery", Proceedings of the IEEE 28th Southeastern Symposium on System Theory, pp. 327-331, 1996.
- Chen, Yan, Jiemi Zhang, Deng Cai, Wei Liu, and Xiaofei He. "Nonnegative local coordinate factorization for image representation." Image Processing, IEEE Transactions on 22, no. 3 (2013): 969-979.
- Cireşan, Dan, Ueli Meier, Jonathan Masci, and Jürgen Schmidhuber. "Multi-column deep neural network for traffic sign classification." Neural Networks 32 (2012): 333-338.
- Huang, Jui-Ting, Jinyu Li, Dong Yu, Li Deng, and Yifan Gong. "Cross-language knowledge transfer using multilingual deep neural network with shared hidden layers." In Acoustics, Speech and Signal Processing (ICASSP), 2013 IEEE International Conference on, pp. 7304-7308. IEEE, 2013.
- Dahl, George E., Dong Yu, Li Deng, and Alex Acero. "Context-dependent pre-trained deep neural networks for large-vocabulary speech recognition." Audio, Speech, and Language Processing, IEEE Transactions on 20, no. 1 (2012): 30-42.
