A perspective model of innovative integrated structure comprising university, research facility and enterprise

Author: Kharin Alexander A., Kharina Olga S., Rodyukov Alexander V., Petrova Elena S.
Journal: Инженерные технологии и системы @vestnik-mrsu
Section: Информатика, вычислительная техника и управление
Article in issue: 3, 2018.
Free access
Introduction. The problem of mathematical modeling in innovative technologies is the lack of a developed general model of innovation processes. The existing approaches allow simulating innovations from any one part: political, economic (in various aspects) or describe the general structure of innovative activity. For example, innovations can be estimated such indicator as sales volume of an innovative product. However, it does not mean that there are no other indicators or they are not important. Materials and Methods. The models by L. Leydesdorf and S. Kauffman, including NK model originally used for the analysis of development of biological populations, were chosen for research of the model choice problems of the innovative integrated structure between university, the enterprise and research laboratory. Results. Modeling the innovative integrated structure between participants of process is carried out based on expert assessment of the innovative landscape for a case of the maximum interdependence. Conclusions. A brief description of modeling methods in innovative technologies is presented in this article. The general description of the problem sphere is given. The current state of researches of this problem is specified. The imitation of innovative networks development options based on the NK model at the independent strategy of participants is constructed. The case of the maximum complexity of network when all participants of an innovation are interconnected and also local and global optimum in a landscape of projects payback is considered.
Imitation model, network structure, innovative landscape, nk, innovative integrated structure
Short address: https://sciup.org/147220583
IDR: 147220583 | UDC: 378.1 | DOI: 10.15507/0236-2910.028.201803.333-343
Перспективная модель инновационной структуры, охватывающей университет, исследовательский центр и предприятие
Введение. Проблема математического моделирования в инноватике состоит в том, что общей модели инновационных процессов до настоящего времени не разработано, а существующие подходы позволяют смоделировать инновации с какой-либо одной стороны: политической, экономической (в различных аспектах) или описывают общую структуру инновационной деятельности. Например, инновации можно оценивать с помощью такого показателя, как объем продаж инновационного продукта, однако это не означает, что других индикаторов не существует или они менее значимы. Материалы и методы. Для исследования проблем выбора модели инновационной интегрированной структуры между университетом, предприятием и научной лабораторией были выбраны модели Л. Лейдесдорфа и С. Кауфмана, а также модель NK, первоначально использованная для анализа развития биологических популяций. Результаты исследования. В статье приведены результаты моделирования инновационной интегрированной структуры между участниками процесса. На основании экспертной оценки составлен инновационный ландшафт для случая их максимальной взаимозависимости. Обсуждение и заключения. В статье представлено краткое описание методов моделирования в инноватике; дано общее описание проблемной сферы; изложено современное состояние исследований данной проблемы. Построена имитация вариантов развития инновационных сетей на основе модели NK при независимых стратегиях участников. Рассмотрен случай максимальной сложности сети, когда все участники инновации взаимосвязаны, а также локальные и глобальные оптимумы в ландшафте окупаемости проектов.
Text of the scientific article A perspective model of innovative integrated structure comprising university, research facility and enterprise
Objectively tendencies of economic development in many countries cause development of integration between education, science and industry, including use of work management organization methods in the scientific organizations specific to corporate sector of economy. In many countries universities started radical transformations, seeking to adapt to the new calls arising in the conditions of the worldwide competition.
Developed countries move in the direction of the innovative integrated structures creation, often with active participation of the state. For effective man- agement any control system has to possess object management model. The modeling purpose of this work consists in the availability to build forecasts using available data of subjects of the innovative system (universities, research facilities and the enterprises) activity to understand possible consequences of innovative system internal dynamics. The current article differs in principle from the other articles of the same topic by applying L. Leides-dorff’s and S. Kauffman’s models, including NK model which is originally used for the analysis of development of biological populations, to the research of the innovative integrated structure choice problems model between university, enterprise and research facility.
It is possible to use L. Leidesdorff and S. Kauffman’s models which reproduce behavior of the network introducing new technologies and gaining additional income both from production and from expansion of a network as an example. Such models are called imitating as they allow to reproduce possible behavior of system under certain conditions. They are created on the basis of the assumption and subsequently generated data which can be analyzed on purpose as “indirect” proof of the put-forward prerequisites.
In L. Leidesdorff’s model the market of two competing technologies (innovations) is imitated, and there’re three sources of variations: innovation, market, state. The network structure gives the chance of the company to get advantage of a complementarity. It is expressed that system effectiveness rises with growth of consumers number.
The model includes two technologies and two subjects using these technologies. The choice of technology by subjects is defined by their compliance to the purposes of subjects, and also network effect which depends on number of the subjects who chose a certain technology. Thus, at a network expansion, some technologies are forced out, thereby reducing a variety of future development. Return to balanced position is possible only if technology market is big enough. Continuous formation of exclusive technologies for each market slows down development of innovative system in general because prevalence in the market of one technology: first, inefficiently; secondly, corresponds to a local optimum; thirdly, reduces probability of a radical innovation that slows down rates of technological development; and, fourthly, demands active state intervention.
Other model applicable for object research, were created in 1993 for biological processes studying and received the name “NK model”. The NK model – the mathematical model described by its main inventor Stewart Kauffman as “reliably adjusted” adapted landscape. The adjusted durability allows change in the full size of a landscape and the number of its local “hills and valleys” through modifications of his two N and K parameters. The NK model has found application in a big variety of areas, including a theoretical research of evolutionary biology, immunology, optimization, technological evolution and complex systems. The model has been also accepted in the organizational theory where it is used to describe a way which the organization can look for a suitable landscape, operating the various features. For example, hills and valleys of the organization represent profit (or its changes), and the movement on a landscape requires organizational solutions (such as addition of production lines or change of organizational structure) which tend to interact with each other and the profit of influence in the difficult way.
It considers uncertainty of system subjects actions along with distinction of regularities of their development and the purposes and represents a heuristic method of interrelations studying in innovative systems. The model received the most obvious application for search of economic network optimum structure consisting of three independent participants: producer, consumer and state.
^.
Literature Review
Scientific and educational-methodical literature, articles in the Russian and foreign periodicals concerning a problem of mathematical modeling in innovatics have been used in this article.
The works by H. Etzkowitz1, E. Weinberger [1], L. Leydesdorf [2, 3, 4], S. Kauffman2–3 [1] became the main sources opening theoretical bases of innovative processes mathematical modeling. In these articles the methodology, the principles and approaches to imitating model creation which reproduces behavior of network after introduction of new technologies are considered in the detail; the heuristic method of interrelations studying in innovative systems which has found the application in search of economic network optimum structure is presented.
In works of K. Frenken [5], I. K. Mu-sayelyan [6–7], G. V. Serebryakova [6], A. A. Kharin4 [8], S. N. Grigorev [9], Yu. Ya. Eleneva [9,10,11], V. N. An-dreyev5 [11] the basic concepts, the principles, approaches to innovatics, subjects of innovative system, the prospect of development and integration of innovative mechanisms in various fields of activity are considered. Besides, in works by A. A. Kharin and O. S. Kharina6 [8] domestic experience of mathematical model development in imitating modeling of innovative processes between institutions of education and representatives of a business environment is presented. In the considered works it is proved that despite existence of innovations imitating modeling techniques in a narrow segment of
Том 28, № 3. 2018 activity, there is now no general approach to creation of innovative processes model which would allow to predict scenarios of the innovative integrated structure of education, science and business development.
Materials and Methods
Let’s construct a threefold spiral of communications. Let the innovative network consist of a combination of binary variables:
– producers (enterprises) X = (0, 1): differ through designated technology which is by 0 and 1: for example, traditional and innovative;
– universities Y = (0, 1): for example, technical and classical;
– research laboratories ( RL ) Z = (0, 1): for example, defensive or civil.
As a result possible combinations of three variables make 8 = 23 combinations which in this system of designations form space of variables: 000, 001, 010, 011, 100, 101, 110, 111.
Let’s consider development option when each subject acts irrespective of the others, and the number of communications is equal to 0. In fig. 1 and in table 1 “landscape” for all options – combinations of the producer, university and research laboratory – is illustrated.
According to table 1 it is visible that communications between participants of process are weak. When communications between participants do not exist, the optimal variant of communications corresponds to that option in which the maximum values of innovations emergence frequencies for all participants are combined.
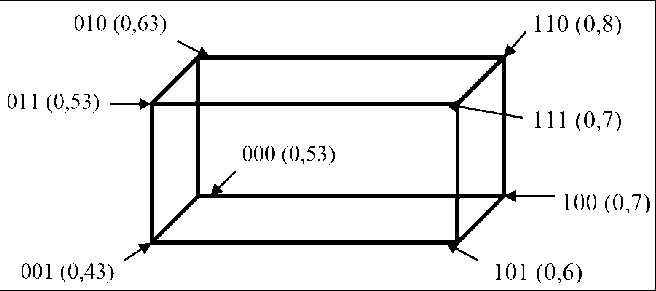
F i g. 1. Innovative “landscape” for independent strategies of network participants
Р и с. 1. Инновационный «ландшафт» для независимых стратегий участников сети
T a b l e 1
Т а б л и ц а 1
Imitation of innovative networks options development on the basis of the NK model at independent strategies of participants
Имитация развития вариантов инновационных сетей на основе модели NK при независимых стратегиях участников
|
Network symbol / Сетевой символ |
Frequency of innovations at enterprise x – fx / Частота инноваций на предприятии x – fx |
Frequency of innovations at university y – fy / Частота инноваций в университете y – fy |
Frequency of innovations at research laboratory z – f / Частота z инноваций в исследовательской лаборатории z – fz |
Frequency of innovations, average on line (the characteristic of “compliance” of a network) – fxyz / Частота инноваций, средняя по строке (характеристика «соответствия» сети) – fxy z |
|
000 |
0,2 |
0,6 |
0,8 |
0,53 |
|
001 |
0,2 |
0,6 |
0,5 |
0,43 |
|
010 |
0,2 |
0,9 |
0,8 |
0,63 |
|
011 |
0,2 |
0,9 |
0,5 |
0,53 |
|
100 |
0,7 |
0,6 |
0,8 |
0,70 |
|
101 |
0,7 |
0,6 |
0,5 |
0,60 |
|
110 |
0,7 |
0,9 |
0,8 |
0,80 |
|
111 |
0,7 |
0,9 |
0,5 |
0,70 |
According to table 1 it is obvious that the maximum value of compliance is the only one and it is provided with a combination 110 with value equal 0,8. It allows to assume that any other option can be improved by replacement of one participant because two of three participants of a network can agree and replace technology, a market segment or the country of residence. This property of a network can be considered due to the need of continuous search of the best options of the organization of innovative process. It is visible from graphic display of an innovative landscape in fig. 2.
The maximum complexity of a network arises when all participants of an innovation are interconnected. In this
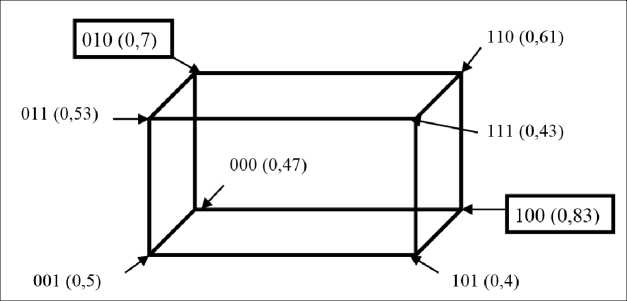
F i g. 2. Local and global optimum in an innovative landscape
Р и с. 2.Локальный и глобальный оптимум в инновационном ландшафте case compliance between participants is defined for each combination separately because efficiency of actions of one participant depends on what partners he will choose. The conditional example of such network is given in table 2.
Change of complexity of a network led to efficiency change. It is expressed that quality of work of any participant of an innovation becomes dependent on with what partners this work is performed. It should be noted that such representation, certainly, more corresponds to modern realities. In this case “partial discrepancy” of one transaction participant can be compensated with interest of high compliance level of two others. Therefore in innovative activity representation there is a possibility of several optimum as it is shown in fig. 2.
T a b l e 2
Т а б л и ц а 2
Landscape at the maximum dependence of strategy of participants Ландшафт при максимальной зависимости стратегии участников
|
Network symbol / Сетевой символ |
Frequency of innovations at enterprise x– fx / Частота инноваций на предприятии x – f x |
Frequency of innovations at university y – fy / Частота инноваций в университете y – fy |
Frequency of innovations at research laboratory z – f / Частота z инноваций в исследовательской лаборатории z – fz |
Frequency of innovations, average on line (the characteristic of “compliance” of a network) – fxyz / Частота инноваций, средняя по строке (характеристика «соответствия» сети) – fxyz |
|
000 |
0,6 |
0,3 |
0,5 |
0,47 |
|
001 |
0,1 |
0,5 |
0,9 |
0,50 |
|
010 |
0,7 |
0,9 |
0,5 |
0,70 |
|
011 |
0,3 |
0,5 |
0,8 |
0,53 |
|
100 |
0,9 |
0,9 |
0,7 |
0,83 |
|
101 |
0,7 |
0,2 |
0,3 |
0,40 |
|
110 |
0,6 |
0,7 |
0,6 |
0,63 |
|
111 |
0,4 |
0,8 |
0,1 |
0,43 |
Results
According to the above-mentioned theoretical approaches confirmed with the corresponding imitating models, the main factors are ensuring the maximum variety and effective selection. We will review an example: two enterprises ( X 0 , X 1 ) at the moment have a production base for commercialization of two similar technologies which are developed at two universities ( Y 0 , Y 1 ) and researched at two scientific laboratories ( Z 0 , Z 1 ). At the same time it is necessary to consider the following facts.
-
1. The X 0 enterprise has higher level of production capacities, than the X 1 enterprise.
-
2. The X 1 enterprise has proved in the market and has more extensive client base, than the X 0 enterprise.
-
3. The Y 0 university has a large number of highly qualified specialists, for involvement in the project, at the same size of financing of the project, as higher education institution of Y 1 .
-
4. The Y 1 university has more success in R&D, than Y 0 university, and possesses a quantity of own production equipment.
-
5. By results of research the product of scientific laboratory Z 0 has potential to borrow narrower segment of the market, than technology of scientific laboratory Z 1 , however at the predicted price of a product Z 1 exceeds planned by 10 %.
-
6. Research and development shows the technology of scientific laboratory Z 1 costs cheaper, but according to forecasts will occupy more market share (for 0,08 %) then product of scientific laboratory Z 0 .
We will consider as evaluation criteria an indicator of payback of the project in N years. In the view of above-mentioned conditions by an expert assessment we will make an innovative landscape at the maximum dependence of participants (table 3 and fig. 3).
Analyzing all options of participants interaction we come to a conclusion that the projects realized in combinations of X 0 Y 0 Z 1 and X 1 Y 1 Z 1 however for each subject the best scenario may be defined separately from interests of other parties. If we take into account additional criteria of subjects activity during cooperation the picture may significantly change.
T a b l e 3
Т а б л и ц а 3
Landscape of projects paybacks at the maximum dependence of participants strategy Ландшафт окупаемости проектов при максимальной зависимости стратегии участников
|
Network symbol / Сетевой символ |
Payback of the project in N years for enterprise x – fx / Окупаемость проекта за N лет для предприятия x – fx |
Payback of the project in N years for university y – fy / Окупае-мость y проекта за N лет для университета y – fy |
Payback of the project in N years for research laboratory z – fz / Окупаемость проекта за N лет для исследовательской лаборатории z – fz |
Payback of the project, average on line, in N years – fxyz / Средняя окупа-е y мость проекта за N лет – f xyz |
|
000 |
0,70 |
0,60 |
0,71 |
0,67 |
|
001 |
0,80 |
0,74 |
0,80 |
0,78 |
|
010 |
0,65 |
0,72 |
0,70 |
0,69 |
|
011 |
0,70 |
0,70 |
0,73 |
0,71 |
|
100 |
0,55 |
0,60 |
0,65 |
0,60 |
|
101 |
0,67 |
0,70 |
0,73 |
0,70 |
|
110 |
0,75 |
0,77 |
0,70 |
0,74 |
|
111 |
0,78 |
0,72 |
0,81 |
0,77 |
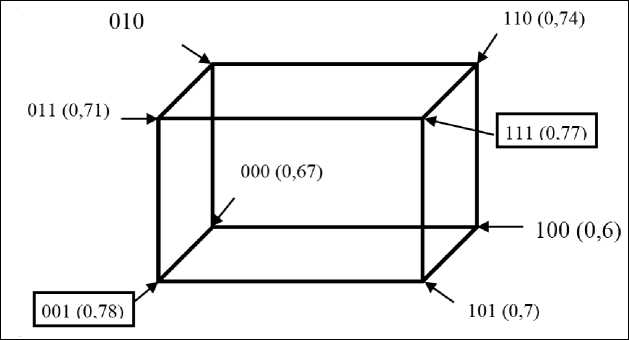
F i g. 3. Local and global optimum in a landscape of projects payback
Р и с. 3. Локальный и глобальный оптимум в ландшафте окупаемости проектов
Conclusions
The NK model which is originally used for the analysis of biological populations development is called so on number of the interacting elements (N) and complexity (K) which is understood as number of the elements in a network influencing each participant, i.e. coherence of elements of a spiral. Number of agents in model of a threefold spiral, by definition, in system from three subjects equally we rub. Producers are classified by the used technol- ogy, universities – in the main directions of educational activity, research laboratories – in the main directions of conducting scientific researches. Each combination of the producer (i. e. technologies, the corresponding innovation), university and research laboratory forms a network or a spiral. The market (consumer) provides the choice of the most successful combinations, and success of an innovative network is defined by the frequency of creation of product innovations.
References A perspective model of innovative integrated structure comprising university, research facility and enterprise
- Kauffman S., Weinberger E. The NK Model of rugged fitness landscapes and its application to the maturation of the immune response. Journal of Theoretical Biology. 1989; 141(2):211-245. (89)80019-0 DOI: 10.1016/S0022-5193
- Leydesdorff L. The triple helix: an evolutionary model of innovations. Research Policy. 2000; 29(2): 243-255. Available at: http://pdfs.semanticscholar.org/35a0/046a6c2823098c75615d734f88675dbcb3ac.pdf
- Leydesdorff L., Meyer M. The Scientometrics of a triple helix of university-industry-government relations (Introduction to the topical issue). Scientometrics. 2007; 70(2):207-222. -y DOI: 10.1007/s11192-007-0200
- Leydesdorff L. The triple helix, quadruple helix, and an N-tuple of helices: Explanatory models for analyzing the knowledge-based economy? Journal of Knowledge Economy. 2012; 3(1):25-35. DOI: 10.1007/s13132-011-0049-4
- Frenken K. A complexity approach to innovation networks. The case of the aircraft industry (1909-1997). Research Policy. 2000; 29(2):257-272. (99)00064-5 DOI: 10.1016/S0048-7333
- Musayelyan I. K., Serebryakova G. V. Conceptual features of value management of socio-economic systems. International Journal of Environmental & Science Education. 2016; 11(11): 4133-1145.
- Musaelyan I. K. The potential of corporate culture in the system of interactions between companies. Life Science Journal. 2014; 12(12s):895-852. Available at: http://www.lifesciencesite.com/lsj/life1112s/184_26609life1112s14_850_852.pdf
- Karpov A., Kharin A., Kharina O. Educational environment forming on the basis of the human capital development//International Conference "Education Environment for the Information Age". 2016; 29, 2 p.
- DOI: 10.1051/shsconf/20162902019
- Grigorev S. N., Eleneva Yu. Ya., Andreev V. N. Technological capital: a criterion of innovative development and an object of transfer in the modern economy. Procedia CIRP. 2014; 20:56-61.
- DOI: 10.1016/j.procir.2014.06.144
- Yeleneva Yu. Ya., Prosvirina M. E., Yelenev K. S., Andreev V. N. Quality of enterprise management during Ramp-up preparation and launch: concept and evaluation method. Procedia CIRP. 2016; 51:13-18.
- DOI: 10.1016/j.procir.2016.05.015
- Yeleneva Yu., Prosvirina M., Golovenchenko A., Andreev V. Analysis and organizational model for monitoring of the training of workers and specialists with secondary vocational education for innovation-oriented enterprises of Russia. Procedia -Social and Behavioral Sciences. 2015; 214:779-787.
- DOI: 10.1016/j.sbspro.2015.11.717
- Pozdneev B., Busina F., Sutyagin M., Ovchinnikov P., Sosenushkin S., Obuhova E., Levchenko A., Sharovatov V. Knowledge management and competency development based on personal e-portfolio. ICERI2017 Proceedings. 2017; 3928-3937.
- DOI: 10.21125/iceri.2017.1050
- Pozdneev B., Sosenushkin S., Busina F., Ivannikov A., Sutyagin M., Ovchinnikov P., Popov D., Levchenko A. Combining hands-on and virtual experiments in computer networking courses. ICERI2017 Proceedings. 2017; 3956-3961.
- DOI: 10.21125/iceri.2017.1054
- Levinthal D. A. Adaptation on rugged landscapes. Management Science. 1997. 43(7):934-950.
- DOI: 10.1287/mnsc.43.7.934
