A Prediction Method of Forecasting University Student Achievements Using an Iterative Neural Network Shrinking Algorithm

Author: Amir Abdul Majid
Journal: International Journal of Modern Education and Computer Science @ijmecs
Article in issue: 6 vol.16, 2024.
Free access
The aim of this work is to predict high education students’ progress and achievement by forecasting their final grades in any taught courses as early as possible during a study semester or term, using an innovative neural network shrinking technique. The trained neural network NN is divided into a head and several tails in a cascaded sequential manner. Course data from previous offerings are used in a network which is trained using a feedforward BP scheme to extract input and output weight coefficients and biases. One of the input features is reduced by a fraction of its original value and used with the same input data in a tailed NN, which is initiated with the extracted coefficients and biases from the previous run. The training is continued in a cascaded manner until eliminating one input assignment. The whole process is continued for other assignments to be eliminated. This algorithm can be constituted as a dynamic process workbench for an alternative method of forecasting the achieved grades of high educational students in an easy and cost-free manner. The earlier it is to forecast final grade the easier it is to alleviate outcomes of course grading. The procedure is applied on two different courses offered by the same teacher. The input data of different batches of students attending a particular course are used. It is found that a tentative accuracy of predicting final grades from the start is possible.
Achievement Forecasting, Machine Learning, Neural Network, Grading Prediction, Shrinking Algorithm
Short address: https://sciup.org/15019609
IDR: 15019609 | DOI: 10.5815/ijmecs.2024.06.04
Text of the scientific article A Prediction Method of Forecasting University Student Achievements Using an Iterative Neural Network Shrinking Algorithm
1. Introduction 1.1 Background
In recent years, the integration of Neural Networks (NN) and Artificial Intelligence (AI) has brought transformative changes to various domains, and education is no exception. One compelling application of these technologies is in predicting and forecasting students' final marks in a course based on their performance in semester assignments. Traditional grading systems often struggle to capture the dynamic and intricate relationships between individual assignment scores and overall academic outcomes. In response, researchers and educators have turned to advanced AI-driven approaches, particularly leveraging the capabilities of NN, to enhance the accuracy and personalization of student performance predictions.
This research explores the application of Neural Networks (NN) and Artificial Intelligence (AI) techniques to forecast students' final marks in a course based on their performance in individual assignments. Traditional grading methods often rely on cumulative scores, which may not capture nuanced patterns in students' learning and understanding. In this study, we leverage the power of NN to analyze the intricate relationships between various assignment components and the final course outcome. The research methodology involves collecting a dataset comprising students' historical performance in assignments, along with their corresponding final marks. The neural network model is designed to learn and adapt to the complex patterns within this dataset, enabling it to make accurate predictions of final marks based on assignment outcomes. The integration of AI allows the system to continuously refine its predictions, considering factors such as individual learning styles, assignment weights, and potential outliers. Results from the experimentation demonstrate the effectiveness of the proposed approach in forecasting final course marks. The NN model not only captures the non-linear dependencies between assignment scores and final outcomes but also exhibits the ability to adapt to variations in student learning trajectories. The study highlights the potential of leveraging AI and NN in education to provide personalized and precise predictions, contributing to a more comprehensive understanding of student performance and facilitating targeted interventions for improvement. This research contributes to the ongoing discourse on enhancing educational assessment methodologies through the integration of advanced technologies.
-
1.2 Motivation
To predict student performance from as early as possible to eradicate any future misconduct and to augment in achieving performance. This study focuses on harnessing the potential of NN and AI to create a robust model for forecasting student final marks. By delving into the complex patterns embedded within semester assignment data, we aim to develop a predictive system that not only considers the cumulative scores but also discerns the subtle interactions and dependencies between different assignment components.
-
1.3 Contribution
1.4 Literature Survey
2. NN Shrinking Algorithm
Neural networks have been spread out into almost every sector of life with numerous uses of configurations [1]. A qualitative research approach, leveraging the use of literature review as a research design and approach was used and effectively facilitated the realization of the study purpose [2]. The paper [3] is based on a feature similarity metric on learners, which first cluster a collection of learners and train a long short-term memory (LSTM) model to predict their learning paths and performance. In the work of [4], two datasets have been considered for the prediction and classification of student performance respectively using five machine learning algorithms, whereas [5] proposed a systematic and comprehensive machine learning-based modeling methodology to develop high-performance predictive student models from the historical educational data to address this issue. The study of [6] aims to map the current utilization of AI/ML in e-learning for adaptive learning, elucidating the benefits and challenges of such integration and assessing its impact on student engagement, retention, and performance. The paper, through intensive literature review attempts to identify the best machine learning model in predicting student performance and appropriate machine learning model in improving learning. The empirical review indicated contentious results on machine learning model that best predicts students’ performance. Moreover, it is not clear among the various machine learning algorithms which one derives the best approach in predicting students’ performance while improving learning outcome [7], and in this sense, we propose a new PFA approach based on different models (Random Forest, AdaBoost, and XGBoost) in order to increase the predictive accuracy of student performance [8]. The authors of [9] compared the performances of several supervised machine learning algorithms, such as Decision Tree, Naïve Bayes, Logistic Regression, Support Vector Machine, K-Nearest Neig. Similarly, the researched work of [10] focuses on student's performance is measured based on various parameters using Random Forest, Naive Bayes and K* method. Experimental analysis shows the strengthening of the random forest method over K* and Naive Bayes method. Several forecasting algorithms have been initiated and implemented such as [11] which estimates trends of parameters using moving averages and Markov series methods. In [12] a novel method is proposed to predict Volterra kernels up to the third order, using a feedforward back propagation (BP) neural network, a technique useful for low probabilities cases. An ML procedural algorithm was proposed using a periodic forecast-error extraction method, in which the annual model is tested for each month, with the temporal errors between target and measured values being extracted [13], and in [14] a detailed adaptive probabilistic analysis is conducted to predict thresholds in variations of the forecast analysis.
Error estimation tools are performed for adopting this method. A procedural algorithm is proposed for wind speed forecasting with best selected fitting distribution function, using a procedural forecast-check method, in which forecasting is performed with time on the most suitable distribution function that fits the foregoing data, depending on minimum errors accumulated from preceded measurements [15]. To the best of the author’s knowledge, this is one of the most unique methods employed to predict the final achieved grades of high education students, based on neural networks. More work is needed to investigate the range and coherence of the datasets. This is of a quite importance when dealing with updates of fast changing material of a course.
A novel model for training a neural network when eliminating some of its input features has been proposed for predicting students’ progress achievements in their study plans. It is important to note that an early prediction of the final earned grade is vital to eradicate student failure consequences, hence this algorithm has been applied on some courses which are offered in the university, namely Control Systems and Electronic Devices and Circuits. These courses have been taught by the same lecturer for different batches of students taking the same material and course learning objectives, as depicted in Figs. 1 and 2, showing input features for each course, such as test 1, test 2, mid-term exam, lab work, semester work, final mark, whereas total mark or grade is main the network output.
|
2143520 |
11 |
MID Fnl |
12 |
lab |
Sems |
Fnl |
Tot |
|
15.0 |
20.0 |
15.0 |
20.0 |
70.0 |
30.0 |
100.0 |
|
|
201614137.0 |
э.о |
10.0 |
11.4 |
18.0 |
49.0 |
18.8 |
67.0 |
|
201624031.0 |
6.0 |
15.0 |
12.0 |
17.0 |
56.0 |
25.5 |
82.0 |
|
2C1624C65.C |
7.5 |
8.7 |
7.5 |
19.0 |
45.5 |
19.5 |
65.0 |
|
201714182.0 |
7.5 |
10.5 |
19.0 |
51.3 |
12.0 |
60.0 |
|
|
201814004.0 |
7.5 |
11.7 |
17.0 _ |
_.-49.0---21.0 |
70.0 |
||
|
201814056.0 |
15.0 |
19.0 |
9.0 |
16.0 |
65.3 |
24.0 |
88.C |
|
201814064.0 |
7.5 |
17.7 |
12.9 |
20.0 |
65.3 |
27.0 |
91'.0 |
Fig. 1. Control Systems course dataset.
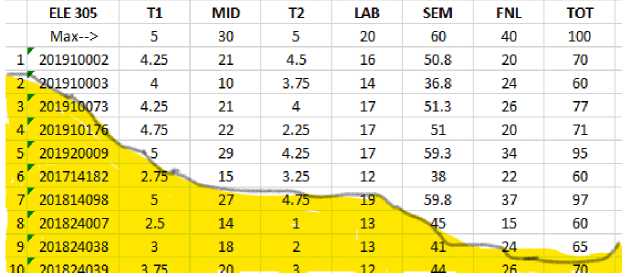
Fig. 2. Electronic Device and Circuits II course dataset.
|
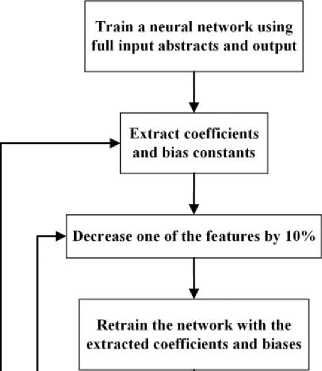
F F Fig. 3. Procedures of the neural network shrinking algorithm |
^^/^Input features to be\ eliminated? ГY ^__/^fore features to be\ eliminated? 1 Y f STOP ; |
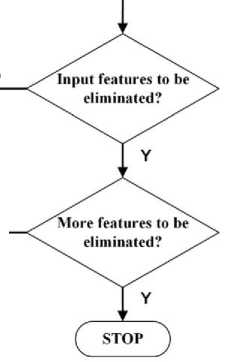
Figure 3 depicts the steps used in the adopted algorithm. Initially a feedforward BP neural network is trained with all input features ranging from test 1 till final exam and in which all coefficients and biases are extracted to be used as initial values for the next tail network with one of the features reduced by 10%. The process repeats until that feature is eliminated and disappeared; hence it is now possible to predict final grade without one of the features being eliminated. In this context, this loop is repeated only 10 times, but the cycle can be repeated more when the reduction of the feature is less than 10% say 1%. Of course, the less the more accurate. Once one feature is eliminated, the whole cycle repeats to eliminate more features. Hence it is possible to predict a student’s final grade right from the first test or assignment.
3. Results
Table 1 depicts a listing of the predicted output used by this study algorithm, compared with the actual output of the Control System course. In the table below, this result is compared with the normal feedforward BP NN training with the same reduced features. The table lists this procedure by eliminating one feature at a time in an ascending order from test1 till final exam. Errors of the two methods are listed compared with the actual outputs. It can be seen that a maximum error of 3.7 % is achieved using the algorithm compared with a maximum error of 18.3% when using a normal training method.
Table 1. A Comparison between NN shrinking algorithm and the normal feedforward BP network training, when eliminating input features in an ascending order for the Control Systems course
|
Eliminating {1} |
Testing |
Actual |
method |
error |
Algorithm |
error |
|
1 |
100 |
100 |
0 |
98.7303 |
1.27 |
|
|
10 |
76 |
77.2333 |
-1.62276 |
77.99 |
-2.62 |
|
|
20 |
92 |
92 |
0 |
92.32 |
-0.35 |
|
|
30 |
65 |
65 |
0 |
65.0123 |
-0.02 |
|
|
40 |
80 |
80 |
0 |
79.7959 |
0.255 |
|
|
Eliminating {1,2} |
Testing |
Actual |
method |
error |
Algorithm |
error |
|
1 |
100 |
97.2704 |
2.7296 |
96.2385 |
3.762 |
|
|
10 |
76 |
75.6473 |
0.464079 |
74.4433 |
2.048 |
|
|
20 |
92 |
91.9339 |
0.071848 |
90.4537 |
1.681 |
|
|
30 |
65 |
65.1058 |
-0.16277 |
64.4898 |
0.785 |
|
|
40 |
80 |
80.7734 |
-0.96675 |
79.4116 |
0.735 |
|
|
Eliminating {1,2,3} |
Testing |
Actual |
method |
error |
Algorithm |
error |
|
1 |
100 |
98.1792 |
1.8208 |
99.825 |
0.175 |
|
|
10 |
76 |
82.2507 |
-8.22461 |
77.4571 |
-1.92 |
|
|
20 |
92 |
91.9547 |
0.049239 |
91.7958 |
0.222 |
|
|
30 |
65 |
53.2257 |
18.11431 |
64.4844 |
0.793 |
|
|
40 |
80 |
79.8799 |
0.150125 |
80.9318 |
-1.16 |
|
|
Eliminating {1,2,3,4} |
Testing |
Actual |
method |
error |
Algorithm |
error |
|
1 |
100 |
98.2313 |
1.7687 |
100.29 |
-0.29 |
|
|
10 |
76 |
76.3291 |
-0.43303 |
76.0379 |
-0.05 |
|
|
20 |
92 |
84.3852 |
8.276957 |
91.6977 |
0.329 |
|
|
30 |
65 |
67.8322 |
-4.35723 |
64.8871 |
0.174 |
|
|
40 |
80 |
79.1281 |
1.089875 |
80.1576 |
-0.2 |
|
|
Eliminating {1,2,3,4,5} |
Testing |
Actual |
method |
error |
Algorithm |
error |
|
1 |
100 |
95.259 |
4.741 |
100.0703 |
-0.07 |
|
|
10 |
76 |
78.1771 |
-2.86461 |
75.7664 |
0.307 |
|
|
20 |
92 |
75.663 |
17.75761 |
90.5711 |
1.553 |
|
|
30 |
65 |
69.6416 |
-7.14092 |
65.1264 |
-0.19 |
|
|
40 |
80 |
78.6214 |
1.72325 |
79.4038 |
0.745 |
In Table 2, the analysis is similar to Table 1, but with the features eliminated in a descending order. Here, the maximum error using the shrinking algorithm is 4.5% compared with 27.2% when using the normal feedforward BP network training method.
Table 2. A Comparison between NN shrinking algorithm and the normal feedforward BP network training, when eliminating input features in a descending order for the Control Systems course
|
Eliminating {6} |
Testing |
Actual |
method |
error |
Algorithm |
error |
|
1 |
100 |
101.8551 |
-1.8551 |
97.383 |
2.617 |
|
|
10 |
76 |
73.8715 |
2.800658 |
82.6902 |
-8.80289 |
|
|
20 |
92 |
104.0555 |
-13.1038 |
90.417 |
1.720652 |
|
|
30 |
65 |
70.8758 |
-9.03969 |
67.2668 |
-3.48738 |
|
|
40 |
80 |
82.1093 |
-2.63663 |
78.5508 |
1.8115 |
|
Eliminating {6,5} |
Testing |
Actual |
method |
error |
Algorithm |
error |
|
1 |
100 |
99.6569 |
0.3431 |
97.9023 |
2.0977 |
|
|
10 |
76 |
68.95 |
9.276316 |
75.5129 |
0.640921 |
|
|
20 |
92 |
93.6369 |
-1.77924 |
92 |
0 |
|
|
30 |
65 |
68.1966 |
-4.91785 |
65 |
0 |
|
|
40 |
80 |
80.4892 |
-0.6115 |
80 |
0 |
|
|
Eliminating {6,5,4} |
Testing |
Actual |
method |
error |
Algorithm |
error |
|
1 |
100 |
91.8691 |
8.1309 |
99.9346 |
0.0654 |
|
|
10 |
76 |
73.2171 |
3.661711 |
76.5883 |
-0.77408 |
|
|
20 |
92 |
90.0215 |
2.150543 |
92.0717 |
-0.07793 |
|
|
30 |
65 |
74.8345 |
-15.13 |
63.9771 |
1.573692 |
|
|
40 |
80 |
76.4738 |
4.40775 |
80.1518 |
-0.18975 |
|
|
Eliminating {6,5,4,3} |
Testing |
Actual |
method |
error |
Algorithm |
error |
|
1 |
100 |
96.085 |
3.915 |
99.948 |
0.052 |
|
|
10 |
76 |
63.1943 |
16.84961 |
76.0061 |
-0.00803 |
|
|
20 |
92 |
89.9226 |
2.258043 |
91.955 |
0.048913 |
|
|
30 |
65 |
71.7724 |
-10.4191 |
67.931 |
-4.50923 |
|
|
40 |
80 |
76.7739 |
4.032625 |
79.9914 |
0.01075 |
|
|
Eliminating {6,5,4,3,2} |
Testing |
Actual |
method |
error |
Algorithm |
error |
|
1 |
100 |
89.6928 |
10.3072 |
99.6564 |
0.3436 |
|
|
10 |
76 |
71.7765 |
5.557237 |
76.6242 |
-0.82132 |
|
|
20 |
92 |
83.2287 |
9.534022 |
95.8852 |
-4.22304 |
|
|
30 |
65 |
82.9373 |
-27.5958 |
65.0032 |
-0.00492 |
|
|
40 |
80 |
81.6131 |
-2.01638 |
79.9729 |
0.033875 |
Similarly, tables 3 and 4 are used for the Electronic Device and Circuits course, in which the same number of examples, input features, outputs, and neutrons, are used. The same course material of same course learning outcomes has been taught to student batches by the same instructor. Here, the maximum error using the shrinking algorithm is 6.43% compared with -36.2264% when using the normal feedforward BP network training method.
Table 3. A Comparison between NN shrinking algorithm and the normal feedforward BP network training, when eliminating input features in an ascending order for the Electronic Device and Circuits course.
|
Eliminating {1} |
Testing |
Actual |
method |
error |
Algorithm |
error |
|
1 |
100 |
98.6561 |
1.3439 |
99.9853 |
0.015 |
|
|
10 |
65 |
61.5959 |
5.237077 |
64.6281 |
0.572 |
|
|
20 |
67 |
64.0562 |
4.393731 |
66.4264 |
0.856 |
|
|
30 |
80 |
78.5981 |
1.752375 |
79.9949 |
0.006 |
|
|
40 |
83 |
82.1186 |
1.061928 |
82.9946 |
0.007 |
|
|
Eliminating {1,2} |
Testing |
Actual |
method |
error |
Algorithm |
error |
|
1 |
100 |
90.9237 |
9.0763 |
100.0016 |
-0 |
|
|
10 |
65 |
47.5152 |
26.89969 |
65.0494 |
-0.08 |
|
|
20 |
67 |
86.6716 |
-29.3606 |
68.0963 |
-1.64 |
|
|
30 |
80 |
108.9811 |
-36.2264 |
80.0012 |
-0 |
|
|
40 |
83 |
96.1353 |
-15.8257 |
83.0004 |
-0 |
|
|
Eliminating {1,2,3} |
Testing |
Actual |
method |
error |
Algorithm |
error |
|
1 |
100 |
92.6674 |
7.3326 |
93.5705 |
6.43 |
|
|
10 |
65 |
73.7336 |
-13.4363 |
64.5501 |
0.692 |
|
|
20 |
67 |
80.2076 |
-19.7128 |
68.4976 |
-2.24 |
|
|
30 |
80 |
70.2265 |
12.21688 |
81.3711 |
-1.71 |
|
|
40 |
83 |
81.8118 |
1.431566 |
83.5608 |
-0.68 |
|
|
Eliminating {1,2,3,4} |
Testing |
Actual |
method |
error |
Algorithm |
error |
|
1 |
100 |
99.6051 |
0.3949 |
100.0005 |
-0 |
|
|
10 |
65 |
65.6648 |
-1.02277 |
64.8317 |
0.259 |
|
|
20 |
67 |
77.6131 |
-15.8404 |
68.3923 |
-2.08 |
|
|
30 |
80 |
77.0301 |
3.712375 |
80.7969 |
-1 |
|
|
40 |
83 |
81.6015 |
1.68494 |
83.2025 |
-0.24 |
|
|
Eliminating {1,2,3,4,5} |
Testing |
Actual |
method |
error |
Algorithm |
error |
|
1 |
100 |
97.6066 |
2.3934 |
95.5775 |
4.423 |
|
|
10 |
65 |
65.2488 |
-0.38277 |
66.123 |
-1.73 |
|
|
20 |
67 |
73.0073 |
-8.96612 |
68.6791 |
-2.51 |
|
|
30 |
80 |
74.612 |
6.735 |
80.1145 |
-0.14 |
|
|
40 |
83 |
79.4895 |
4.229518 |
81.687 |
1.582 |
Table 4. A Comparison between NN shrinking algorithm and the normal feedforward BP network training, when eliminating input features in a descending order for the Electronic Device and Circuits course.
|
Eliminating {6} |
Testing |
Actual |
method |
error |
Algorithm |
error |
|
1 |
100 |
95.1561 |
4.8439 |
98.8843 |
1.1157 |
|
|
10 |
65 |
64.8701 |
0.199846 |
64.517 |
0.743077 |
|
|
20 |
67 |
66.0975 |
1.347015 |
66.4 |
0.895522 |
|
|
30 |
80 |
81.1802 |
-1.47525 |
78.8304 |
1.462 |
|
|
40 |
83 |
78.1579 |
5.833855 |
80.8004 |
2.65012 |
|
|
Eliminating {6,5} |
Testing |
Actual |
method |
error |
Algorithm |
error |
|
1 |
100 |
98.6922 |
1.3078 |
99.8368 |
0.1632 |
|
|
10 |
65 |
69.6387 |
-7.13646 |
65.0019 |
-0.00292 |
|
|
20 |
67 |
62.8663 |
6.169701 |
67.0637 |
-0.09507 |
|
|
30 |
80 |
73.5307 |
8.086625 |
79.9457 |
0.067875 |
|
|
40 |
83 |
78.8466 |
5.004096 |
82.9012 |
0.119036 |
|
|
Eliminating {6,5,4} |
Testing |
Actual |
method |
error |
Algorithm |
error |
|
1 |
100 |
83.9585 |
16.0415 |
97.8452 |
2.1548 |
|
|
10 |
65 |
67.4583 |
-3.782 |
64.0875 |
1.403846 |
|
|
20 |
67 |
71.1642 |
-6.21522 |
67.0142 |
-0.02119 |
|
|
30 |
80 |
72.6913 |
9.135875 |
79.2649 |
0.918875 |
|
|
40 |
83 |
80.5913 |
2.902048 |
82.3278 |
0.80988 |
|
|
Eliminating {6,5,4,3,} |
Testing |
Actual |
method |
error |
Algorithm |
error |
|
1 |
100 |
92.6512 |
7.3488 |
100.3608 |
-0.3608 |
|
|
10 |
65 |
69.7368 |
-7.28738 |
64.8126 |
0.288308 |
|
|
20 |
67 |
70.6993 |
-5.52134 |
67.252 |
-0.37612 |
|
|
30 |
80 |
72.8174 |
8.97825 |
79.4293 |
0.713375 |
|
|
40 |
83 |
80.1613 |
3.42012 |
83.4893 |
-0.58952 |
|
|
Eliminating {6,5,4,3,2} |
Testing |
Actual |
method |
error |
Algorithm |
error |
|
1 |
100 |
91.9998 |
8.0002 |
99.964 |
0.036 |
|
|
10 |
65 |
64.9983 |
0.002615 |
64.6135 |
0.594615 |
|
|
20 |
67 |
78.774 |
-17.5731 |
68.2893 |
-1.92433 |
|
|
30 |
80 |
78.774 |
1.5325 |
80.1165 |
-0.14563 |
|
|
40 |
83 |
76.7124 |
7.575422 |
83.0607 |
-0.07313 |
4. Analysis
Table 5 depicts maximum errors of implementing the proposed algorithm as compared with a normal feedforward BP network training method when each input feature is eliminated in both ascending and descending orders by 10 steps of 10% each. The table lists a comparison of the maximum error as percentages, at the five random input examples which were considered {1,10,20,30,40}. In the ascending order involving only the last assignment, the algorithm was more accurate than a usual feedforward BP training with an error of 3.762% and 6.430% for courses Control Systems and Electronic Device and Circuits, compared to 18.114% and 36.226% as compared with the actual output grades. For the descending order, the algorithm scored compared with 8.802% and 2.1548% for the same two alternative courses compared with 16.849% and 17.573%.
Table 5. A c omparison of the maximum errors encountered between the shrinking algorithm and feedforward BP neural network training for the two considered courses.
|
Courses |
Ascending elimination |
Descending elimination |
||
|
Algorithm |
BP method |
Algorithm |
BP method |
|
|
Control Systems |
3.762 |
18.114 |
8.802 |
16.849 |
|
Electronic Devices and Circuits |
6.430 |
36.226 |
2.1548 |
17.573 |
Table 6 depicts the forecasted outputs after shrinking 10 values of each input feature to be eliminated from the input features list, individually in both ascending and descending orders.
Table 6. A comparison of the outputs attained using the NN shrinking algorithm and feedforward BP network training method when the worse cases with highest error are adopted.
|
Course |
Actual output |
BP method |
Algorithm |
|
Control Systems |
100 |
89.6928 |
96.2385 |
|
76 |
63.1943 |
82.6902 |
|
|
92 |
75.663 |
95.8852 |
|
|
65 |
82.9373 |
64.4844 |
|
|
80 |
76.4738 |
78.5508 |
|
|
Electronic Device and Circuits II |
100 |
83.9585 |
93.5705 |
|
65 |
47.5152 |
64.0875 |
|
|
67 |
86.6716 |
68.6791 |
|
|
80 |
108.9811 |
81.3711 |
|
|
83 |
96.1353 |
80.8004 |
Although the foregoing results demonstrate the application of the proposed algorithm on high educational courses, the implication of the extend of this application is limited in this study due to the following assumptions:
• Versatility of other courses of higher educational fields other than electrical engineering courses.
• Whether courses have been addressed by one or multiple instructors for the same Course Learning Outcomes (CLO).
• The implication of major updates conducted on courses’ contents during NN analysis.
• The size of classes and number of their occurrences.
5. Conclusion
Nevertheless, this study constitutes a major workbench for forecasting student’s achievement in a useful and with limited resources manner.
A neural network shrinking algorithm has been proposed and adopted for forecasting student final grade from earlier test assignments. The methodology has been applied on two taught courses of the same contents to different batches of students instructed by the same teacher with same course learning outcomes. Input neural network features constituting earlier course assessments are eliminated in both ascending and descending orders. The accuracy can further be improved with more future courses’ offerings, a larger number of student examples, more input test and assignment features, as well as with less gradual shrinking values. The algorithm is more accurate than the usual BP training with a maximum error of 8.8% compared with a staggering 36.2% for predicting final using only the first test or assignment. It is a challenge to investigate cases when different multiple courses are concatenated as one batch, or when the courses materials are taught by different instructors, in which further work has to be conducted in the future. Although this algorithm can be incorporated with electronic learning tools such as Moodle, more work is needed to investigate the size and coherence of the datasets when dealing with updates of fast changing material of a course.
References A Prediction Method of Forecasting University Student Achievements Using an Iterative Neural Network Shrinking Algorithm
- Bimal Bose, “Neural Network Principles and Applications”, Modern Power Electronics and AC Drives, published book, Prentice Hall, ISBN: 9780130167439, 2002.
- L Chen, P Chen, Z Lin, “Artificial Intelligence in Education: A Review Journals & Magazines”, IEEE Access Volume: 8, - IEEE Access, 2020. ieeexplore.ieee.org.
- Yuwen Zhou, Changqin Huang, Qintai Hu, Yong Tanb, “Personalized learning full-path recommendation model based on LSTM neural networks”, Information Sciences, Volume 444, Pages 135-152, 2018.
- Boran Sekeroglu, Kamil Dimililer, Kubra Tuncal, “Student Performance Prediction and Classification Using Machine Learning Algorithms”, ICEIT 2019: Proceedings of the 2019 8th International Conference on Educational and Information Technology, Pages 7–11, 2019. https://doi.org/10.1145/3318396.3318419.
- Chunsheng Yang, Feng-Kuang Chiang, “Machine Learning-Based Student Modeling Methodology for Intelligent Tutoring Systems”, Journal of educational computing research, Volume 59, Issue 6, First published online January 13, 2021. https://orcid.org/0000-0002-6010-6048.
- Ilie Gligorea , Marius Cioca, “Romana Oancea Adaptive Learning Using Artificial Intelligence in e-Learning: A Literature Review”, Educ. Sci. 2023, 13(12), 1216, 2023. https://doi.org/10.3390/educsci13121216.
- Francis Ofori, Dr. Elizaphan Maina and Dr. Rhoda Gitonga, “Using Machine Learning Algorithms to Predict Students’ Performance and Improve Learning Outcome: A Literature Based Review ISSN: 2617-3573, Journal of Information and Technology, Vol. 4(1), 33-55. 2020.
- Amal Asselman Icon, Mohamed Khaldi Icon & Souhaib Aammou, “Enhancing the prediction of student performance based on the machine learning XGBoost algorithm. Interactive Learning Environments”, Volume 31, 2023 - Issue 6, Pages 3360-3379 | Received 17 Mar 2021. Accepted 03 May 2021, published online: 19 May 2021. https://doi.org/10.1080/10494820.2021.1928235.
- Ali Salah Hashim, Wid Akeel Awadh and Alaa Khalaf Hamoud, “Student Performance Prediction Model based on Supervised Machine Learning Algorithms, IOP Conference Series: Materials Science and Engineering, Volume 928, 2nd International Scientific Conference of Al-Ayen University (ISCAU-2020) 15-16 July 2020. DOI 10.1088/1757-899X/928/3/032019.
- Atul Garg; Umesh Kumar Lilhore; Pinaki Ghosh, “Machine Learning-based Model for Prediction of Student’s Performance in Higher Education”, 2021 8th International Conference on Signal Processing and Integrated Networks (SPIN), Date of Conference: 26-27 August 2021, Date Added to IEEE Xplore: 19 October 2021, INSPEC Accession Number: 21388077, DOI: 10.1109/SPIN52536.2021.9565999
- A. Abdul Majid, “Accuracy of wind speed forecasting based on joint probability prediction of the parameters of the Weibull probability density function. Front. Energy Res. 11:1194010, 08 September 2023. 2296598X doi: 10.3389/fenrg.2023.1194010.
- A. Abdul Majid, “A Novel Method of Forecasting Chaotic and Random Wind Speed Regimes Based on Machine Learning with the Evolution and Prediction of Volterra Kernel. Energies 2023, 16, 4766. https://doi.org/10.3390/en16124766, 2023.
- A. Abdul Majid, “Forecasting Monthly Wind Energy Using an Alternative Machine Training Method with Curve Fitting and Temporal Error Extraction Algorithm, Energies 2022, 15, 8596, https://doi.org/10.3390/en15228596, 2022.
- A. Abdul Majid, “Accurate and efficient forecasted wind energy using selected temporal metrological variables and wind direction, Energy Conversion and Management: X 16 (2022) 100286, Volume 16, December 2022
- A. Abdul Majid, “Wind energy forecasting by fitting predicted probability density functions of wind speed measurements, International Journal of Energy and Environmental Engineering, https://doi.org/10.1007/s40095-022-00475-8.
