A Review of Various Transform Domain Digital Image Fusion for Multifocus Colored Images

Author: Arun Begill, Sankalap Arora
Journal: International Journal of Information Technology and Computer Science(IJITCS) @ijitcs
Article in issue: 12 Vol. 7, 2015.
Free access
Image fusion is the idea to enhance the image content by fusing two or more images obtained from visual sensor network. The main goal of image fusion is to eliminate redundant information and merging more useful information from source images. Various transform domain image fusion methods like DWT, SIDWT and DCT, ACMax DCT etc. are developed in recent years. Every method has its own advantages and disadvantages. ACMax Discrete cosine transform (DCT) is very efficient approach for image fusion because of its energy compaction property as well as improve quality of image. Furthermore, this technique has also some disadvantages like color artifacts, noise and degrade the sharpness of edges. In this paper ACMax DCT method is integrated with saturation weighting and Joint Trilateral filter to get the high quality image and compare with traditional methods. The results have shown that ACMax DCT with Saturation weighting and Joint Trilateral filter method has outperformed the state of art techniques.
Discrete cosine transform (DCT), Discrete wavelet transform (DWT), Image fusion, Saturation weighting, Joint trilateral filter
Short address: https://sciup.org/15012414
IDR: 15012414
Text of the scientific article A Review of Various Transform Domain Digital Image Fusion for Multifocus Colored Images
Published Online November 2015 in MECS DOI: 10.5815/ijitcs.2015.12.09
Image fusion is a technique used for collaborating source images to acquire an all parts in focused image [1]. Image fusion is of three levels: Pixel level, Feature level, Decision level image fusion. Most of the methods mainly focus on pixel level image fusion because it is easy to implement, less complex and the pixel level is the establishment of feature level and decision level image fusion [2]. There are numerous applications of image fusion such as digital camera, forensic science, security surveillance, remote sensing, robotics and object recognition etc. [3]. In real time applications, due to restricted depth of lens, the lens focuses on one object of a given scene that part of the scene will be sharply focused and the other part of scene will be out of focus or blurred. In multifocus image fusion method, captured multiple images of same scene with focus on different objects and then fused by extracting focused area in the resulting image [4]. The image fusion method is categorized into two domain- Spatial domain and Transform domain.
In recent years, a lot of research has been developed on image fusion methods performed in the transform domain techniques. Discrete wavelet transform is any wavelet transform for which the wavelets are discretely sampled. This wavelet transform divide the image into Low-Low (LL), Low-High (LH), High-Low (HL) and High-High (HH) frequency bands which contain wavelet coefficients but it undergoes from the problem of translation invariance [5]. Stationary wavelet transform (SWT) is a wavelet transform algorithm designed to overcome the lack of translation invariance of the DWT [6]. Translation invariance means it does not depend on location of any object in an input image. However, these two methods are very complex and consume more energy. Discrete cosine transform (DCT) method is easy to implement, less complex, high speed and has energy compaction property when it is saved and transmitted in JPEG format [7]. Furthermore, DCT method based on max alternating current produce better results because it takes up the blocks which have higher value [8]. Thus, it improves quality of image as well as energy savings. But this method produces some color artifacts and degrades the sharpness of edges. In this paper, ACMax DCT method is integrated with saturation weighting and joint trilateral filter to reduce the color artifacts and improve the sharpness of edges. Moreover, when two or more images are fused it produces some random noise. So, this paper is also reduces the noise by using joint trilateral filter.
This paper is organized as section II describes related work. In section III deals with theoretical analysis and section IV explains evaluation metrics and section V discussed experimental analysis and results. This paper is closed with conclusion, future and references.
-
II. Related Work
Image fusion can be categorized into two domains: Spatial and Transform domain. First paragraph discuss some related work of spatial domain image fusion methods and second paragraph discuss some literature survey of transform domain methods as follows:
The author has explained a new PCA approach used for mineral mapping by merging different satellite sensors to obtain a significant feature image [9]. The author has discussed a smoothness and uniformity of image fusion in spatial domain which combine multiple images from various set of images to produce a superior quality of image [10]. In this method, the author has presented a new averaging weighted image fusion algorithm for observing a correlation based quality measures which takes lot attention in recent years [11].
In this paper author has developed a new method of laplacian pyramid specially designed for medical images. With the increase of decomposition level of pyramid, it automatically increases a quality of fused image [12]. In this paper, the author has focused on IR images which are calculated in wavelet transform method. IR images contain less noise and produce a quality fused image with some loss of information [13]. This paper presents a discrete cosine transform method based on spatial frequency to obtain a focused everywhere image [14].
-
III. Theoretical Analysis
In transform domain image fusion method, the pixels values are firstly transferred to frequency domain methods and then the pixels value is calculated. Various evaluated transform domain methods of image fusion are described below:
-
A. Discrete Cosine Transform with Variance
Discrete cosine transform is a finite sequence of data points in terms of a sum of cosine function oscillating at different frequencies. This method is based on variance computed in DCT domain [15]. Variance means how many variations occur in pixel values. The value of variance is generally based on activity level measure in applications of image processing. Moreover, in image fusion focused area gives more detailed information which corresponds to the high variance [16]. However, consistency verification is used for reduce some errors which occur due to undesirable effects or noise during the selection procedure of blocks between two images. Majority of filters are used for consistency verification. Generally 3*3 neighborhood window is used for consistency verification. If window size increases then complexity also increases. The main disadvantage of this method is that it involves some complex operations when variance is computed and also degrades the boundaries of image. In case of consistency verification it raises the complexity when window size increases. DCT and Variance can be calculated by equations (1) and (2).
N-1 N-1
F(u,v)=—c(u)(v) ^ ^f(x,y)cosl- y=0 y=0 '
(2x + 1)ыя 2N
)
(2y + 1vn) 2N
)
* cos I ■
ff2 = Щ \ : 1 F m.m
-
B. Discrete Wavelet Transform (DWT)
DWT is any wavelet transform for which the wavelets are discretely sampled. It captures both frequency and the location information [17]. It uses the high pass filter and low pass filter simultaneously. Following equation (3) defines the low pass filter and equation (4) defines the High pass filter.
y iow [F.]= ’L k=- rox[k]h[2n-k] (3)
Y iow [n] = Z k= — ., xMhRn - k] (4)
where, x is contiguous series of pixel, g is the impulse response (basically low-pass filter), h is high-pass filter. This method consumes more time and has a problem of blockness and it does not produce high quality of image because it suffers from translation invariance problem.
-
C. Shift Invariance Discrete Wavelet Transform (SIDWT)
SIDWT is a wavelet transform algorithm designed to overcome the problem of translation-invariance of the discrete wavelet transform (DWT). This fusion method is shift invariant, indicating that it should not depend on position of object in an input image to be temporal stable and consistent within input sequence [18]. This method also consumes more time and discontinuities at the block boundaries are visible. SIDWT can be calculated using equations (5) and (6).
W i (n) = Z k b^ i .k^n-k) (5)
si + 1(n) = Z k C(2 ‘ .k) S i (n-k) (6)
Elements W j are used for wavelet sequence and elements s; are used for scale sequence which is used as input for next decomposition level. b(2l.k) and c(2j.k) are used for analysis filters at level i .
-
D. ACMax DCT
This method is based on the selection procedure of alternating current (AC) coefficients which are computed in DCT domain. Higher value of AC coefficients means high quality and clarity of image [8]. AC coefficients can be calculated as equation (7).
ст2 = £ 6;1 1ЛЛ2 (7)
The overall results of this method produce higher quality of image. This method does not compute any complex floating point operation such as mean etc. But due to transform domain this method produces some color artifacts which may reduce the performance of image fusion. Also this method degrades the sharpness of edges. Due to fusion of two or more images some random noise is also produced.
-
E. ACMax DCT with Saturation Weighting (SW) and Joint Trilateral Filter (JTF)
This method is same as ACMax DCT but in post processing of this method we use integrated Saturation weighting scheme and Joint Trilateral Filter to enhance the results [19][20]. Saturation weighting scheme is used to reduce color artifacts whereas joint trilateral filter is used to improve the sharpness of edges as well reduce some noise which is introduced due to transform domain method. Furthermore, this method outperforms the previous techniques. Saturation weighting and Joint Trilateral Filter can be calculated using equations (8) and
J ws (f(x))(f i,c r (x)) P dx)1/M =ke , (8)
/TF(I)P = у---Z ewk WJTF (G) Iq (9)
p L qEwk W jTFpq (С) ч к J pq 4
s denotes saturation factor, Ip and Iq are the intensity value at pixel p and q. G denotes guided image in local window.
-
IV. Evaluation Metrics
It is very difficult to find differences in the quality of images visually by evaluated techniques. But the use of some performance metrics can describe both qualitative and quantitative measures.
-
A. Root Mean Squared Error (RMSE)
Root mean squared error is computed to analyze an image quality. If the value of root mean squared error is high it signifies that image is of poor quality. Root mean squared error between the reference image and the fused image is computed by equation (10).
RMSE =
J M N
MnZZ m=1 n=1
[P(m,n) - <2(m,n)] 2
P (m, n) is referenced image pixel value whereas Q(m, n) is the fused image pixel value. If MSE= 0 then it is perfectly fused image whereas the fused image accurately equivalent to the reference image.
-
B. Peak Signal to Noise Ratio (PSNR)
This metric is used to calculate the peak signal-to-noise ratio between two images. This section is commonly used as a quality measurement between source images and outcome or fused image. If the value of PSNR is high it means fused image is of high quality. PSNR value is evaluated by equation (11):
PSNR = 10logw(2^)
-
C. Mean Structural Similarity Index (SSIM)
In many practical applications, where reference image is not available and a no-reference or blind quality assessment approach is desirable, the structural similarity measure is a quality criterion used for objective estimation of fused image [21]. The simple form of the metric that is used to calculate the structural similarity between two signal vectors i and j is given by equation (12).
SSIM(ij) = fe^) ( 2^2 ) (12)
V ц 2 +ц 2 +сг) Vi+ 2 jCc2J v '
the vectors i and j are used as sample means for ]_q and jM y , sample variances for o’2 and d j2 , and sample crosscovariance for o ^j respectively. c 1 and c2 are used as default values such as 0.01 and 0.03. The average of the SSIM values across the image (MSSIM) gives the final quality metric.
-
D. Spatial Frequency (SF)
The row and column frequencies of the fused image F of size R*S is computed as given in equation (13) and (14).
RF = J^Zr-o1 Zs-1[^(r,s) - F(r,s- 1)]2
CF = ^1^1=1 Z£-1W,s) - F(r - 1,s)]2
The overall spatial frequency of the fused image which is based on edge information is evaluated as equation (15).
SF = ^(RF)2 + (CF)2
-
V. Experiments
For the experiments, the Matrix Laboratory (MATLAB) image processing toolbox is used for designing and implementation of all algorithms.
-
A. Experimental Setup
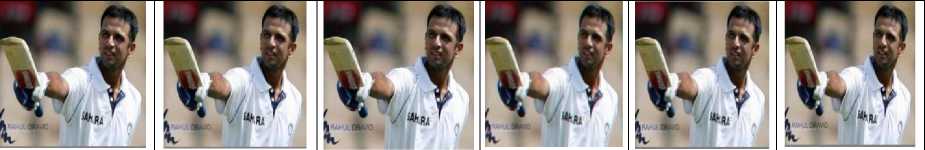
Four sets of input images such as Dravid, Lays, Eye and Page are taken. Each set consists of 2 partially blurred images. In first three sets, images are partially focused on left part and right part. In fourth set first image is focused on lower part and another image is focus on upper part as shown in Figure 1.
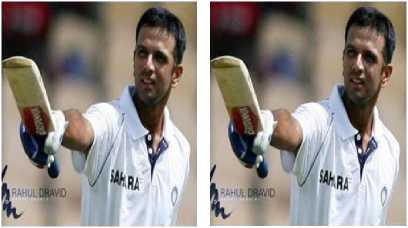
1 (a) 1 (b)
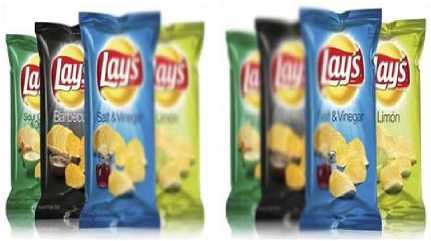
2 (a) 2 (b)
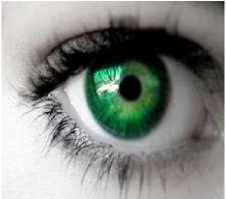
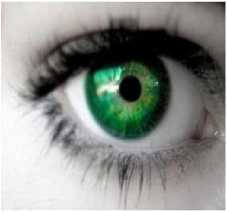
3 (b)
4 (b)
Fig. 1. Input images (a) Focused on left (b) Focused on right
Fuse these 4 sets of partially focused images by different image fusion algorithms like:
-
1) DCT with Variance
-
2) DCT with VarianceCV
-
3) DWT with DBSS
-
4) SIDWT with Haar
-
5) ACMax DCT with CV
-
6) ACMax DCT with Saturation weighting (SW) and Joint Trilateral Filter (JTF)
and compare the results on the basis of already mentioned evaluation metrics.
-
B. Results and Discussion
On applying different image fusion algorithms, the following fused images are obtained as shown in Figure 2. The quality evaluations are done in form of some evaluation metrics as:
-
1) Root mean squared error (RMSE): From Figure 3 represents a vertical bar graph of Root mean squared error, it can be clearly shown that there is decrease in RMSE value of images using ACMax DCT with SW and JTF technique as compared to other techniques. This decrease represents improvement in the objective quality of the image.
Table 1 shows the quantized analysis of the Root mean squared error. As Root mean square error needs to be reduced therefore the ACMax DCT with SW and JTF algorithm is showing better results than the available methods as Root mean square error is less in every case.
-
■ AC SW JTF ■ ACMax DCT ■ DWT
-
■ SIDWT ■ DCT VAR ■ DCT VARCV
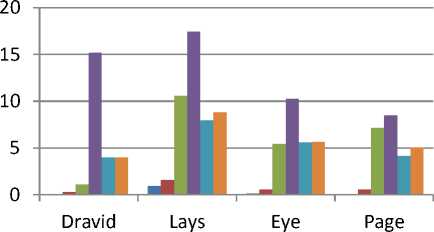
Fig. 3. Root mean squared error evaluation of ACMax DCT with SW and JTF, ACMax DCT, DWT, SIDWT, DCT+VAR and DCT+VARCV
Table 1. Root Mean Squared Evaluation
Image name
DCT V+ar
DCT Var+CV
DWT DB+SS
SIDWT +
Haar
AC Max DCT
AC
Max SW and JTF
Dravid
4.0095
4.0095
1.1100
15.1630
0.3170
0.0619
Lays
7.9304
8.7922
10.5597
17.4438
1.5755
0.9574
Eye
5.5858
5.6708
5.4333
10.2848
0.5758
0.1585
Page
4.1438
5.0375
7.1777
8.4865
0.5601
0
-
2) Peak signal to noise ratio (PSNR): Figure 4 shows the vertical bar graph of PSNR, there is increase in PSNR value of images using ACMax DCT with SW and JTF over other methods. It has clearly shown from the bar graph that the value of PSNR is high in the case of the ACMax DCT with SW and JTF algorithm therefore, algorithm provides better results than the traditional methods.
Table 2 shows the comparative analysis of the Peak Signal to Noise Ratio (PSNR). As PSNR need to be maximized, so the main goal is to increase the PSNR. Images Dravid, Eye and Page show infinite values in ACMax DCT with SW and JTF over available techniques. For ACMax DCT with SW and JTF, PSNR is maximum in every case.
Table 2. Peak Signal to Noise Ratio Evaluation
|
Image name |
DCT V+ar |
DCT Var+CV |
DWT DB+SS |
SIDWT + Haar |
AC Max DCT |
AC Max SW and JTF |
|
Dravid |
72.1379 |
72.1379 |
94.4473 |
49.0301 |
inf |
inf |
|
Lays |
60.2896 |
58.4975 |
55.3155 |
46.5959 |
88.3641 |
97.0163 |
|
Eye |
66.3779 |
66.1157 |
66.8591 |
55.7736 |
inf |
inf |
|
Page |
71.5656 |
68.1727 |
62.0222 |
59.1124 |
inf |
inf |
Image name
Dravid
DCT + Variance result DCT + Variance + CV result
DWT with DBSS result
SWT with Haar result ACMax DCT result
ACMax DCT with SW and JTF result
Lays
Eye
Page
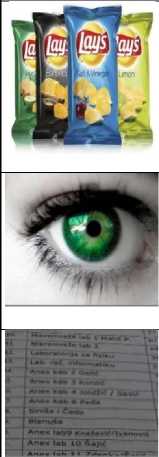
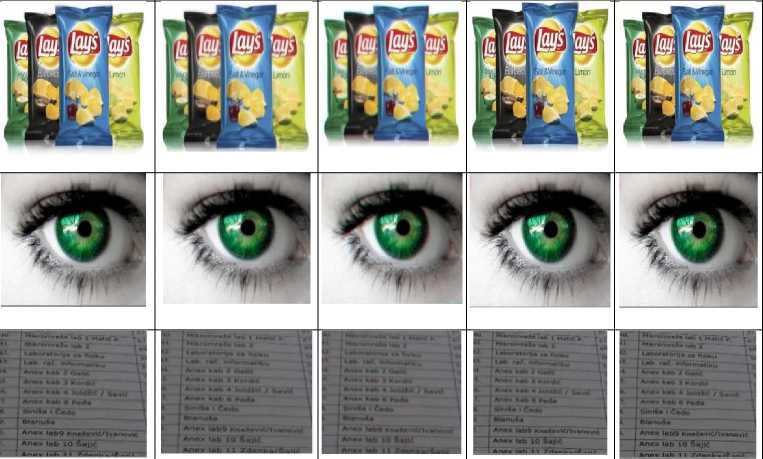
Fig. 2. Fusion results on applying different image fusion algorithms
-
■ AC SW JTF ■ ACMax DCT ■ DWT
-
■ SIDWT ■ DCT VAR ■ DCT VARCV
II I 11
Dravid Lays Eye Page
Fig. 4. Peak Signal to Noise Ratio evaluation of ACMax DCT with SW and JTF, ACMax DCT, DWT, SIDWT, DCT+Var and DCT+VarCV
-
3) Structural similarity index (SSIM): Figure 5 shows the bar graph of SSIM. The SSIM value is close to 1 in every case using ACMax DCT with SW and JTF method.This signifies enhancement in the objective quality of the image.
-
■ AC SW JTF ■ ACMax DCT ■ DWT
-
■ SIDWT ■ DCT VAR ■ DCT VARCV
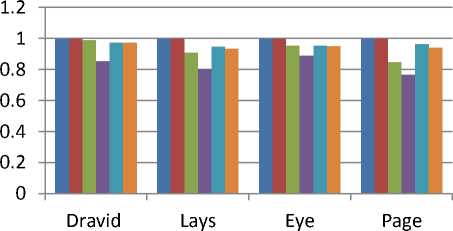
Fig. 5. Structural similarity index evaluation of ACMax DCT with SW and JTF, ACMax DCT, DWT, SIDWT, DCT+Var and DCT+VarCV
Table 3 shows the comparative analysis of the Mean Structural similarity index (SSIM). As SSIM should be equal to 1, thus ACMax DCT with SW and JTF algorithm produce good quality results than the existing techniques.
Table 3. Structural similarity index Evaluation
|
Image name |
DCT V+ar |
DCT Var+CV |
DWT DB+SS |
SIDWT + Haar |
AC Max DCT |
AC Max SW and JTF |
|
Dravid |
0.9718 |
0.9718 |
0.9994 |
0.8526 |
0.9995 |
0.9996 |
|
Lays |
0.9417 |
0.9337 |
0.9090 |
0.8019 |
0.9971 |
0.9975 |
|
Eye |
0.9546 |
0.9516 |
0.9534 |
0.8895 |
0.9983 |
0.9991 |
|
Page |
0.9645 |
0.9419 |
0.8468 |
0.7668 |
0.9984 |
1 |
-
4) Spatial frequency (SF): From 6 shows the bar graph of spatial frequency. There is increase in SF value of images using ACMax DCT method over other methods. This increase siginifies enhancement in the objective clarity of the image.
-
■ AC SW JTF ■ ACMax DCT ■ DWT
-
■ SIDWT ■ DCT VAR ■ DCT VARCV
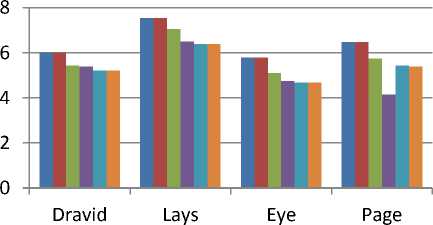
Fig. 6. Spatial frequency evaluation of ACMax DCT with SW and JTF, ACMax DCT, DWT, SIDWT, DCT+Var and DCT+VarCV
Table 4 shows the comparative analysis of the spatial frequency. Higher the value of spatial frequency, higher is the clarity of image. It has clearly shown that the value of SF is same in two methods ACMax DCT with SW and JTF and ACMax DCT techniques and increases in other existing techniques.
With respect to all the evaluations performed, the evaluated technique has performed better than traditional techniques in terms of image quality improvement under the light of all evaluation metrics.
Table 4. Spatial Frequency
|
Image name |
DCT V+ar |
DCT Var+CV |
DWT DB+SS |
SIDWT + Haar |
AC Max DCT |
AC Max SW and JTF |
|
Dravid |
5.2167 |
5.2167 |
5.4381 |
5.3832 |
6.0079 |
6.0079 |
|
Lays |
6.3752 |
6.3800 |
7.0427 |
6.4914 |
7.5475 |
7.5475 |
|
Eye |
4.6683 |
4.6714 |
5.0871 |
4.7520 |
5.7937 |
5.7937 |
|
Page |
5.4354 |
5.3928 |
5.7431 |
4.1334 |
6.4644 |
6.4644 |
-
VI. Conclusion
The experimental results have shown that the quality of the resultant image produced by ACMax DCT with saturation weighting and joint trilateral filter technique is of higher quality than the existing traditional techniques in DCT and DWT domain. Most of the existing methods have focused on gray scale images and they do not work on color images. ACMax DCT with SW and JTF method produces better results for colored images than state-of-the-art methods. Moreover, the use of saturation weighting and Joint Trilateral Filter with ACMax DCT reduces the blockiness and also improves the sharpness of edges and reduce some random noise which is produced during fusion of two or more images.
References A Review of Various Transform Domain Digital Image Fusion for Multifocus Colored Images
- Garg, Rishu, Preeti Gupta, and Harvinder Kaur. "Survey on multi-focus image fusion algorithms." Engineering and Computational Sciences (RAECS), 2014 Recent Advances in. IEEE, 2014.
- Li, Mingjing, and Yubing Dong. "Review on technology of pixel-level image fusion." Measurement, Information and Control (ICMIC), 2013 International Conference on. Vol. 1. IEEE, 2013.
- Bai, Xiangzhi, Fugen Zhou, and Bindang Xue. "Edge preserved image fusion based on multiscale toggle contrast operator." Image and Vision Computing29.12 pp. 829-839, 2011.
- Li, Qingping, et al. "Region-based multi-focus image fusion using the local spatial frequency." Control and Decision Conference (CCDC), 2013 25th Chinese. IEEE, 2013.
- Prakash, Om, Richa Srivastava, and Ashish Khare. "Biorthogonal wavelet transform based image fusion using absolute maximum fusion rule."Information & Communication Technologies (ICT), 2013 IEEE Conference on. IEEE, 2013.
- Bradley, Andrew P. "Shift-invariance in the discrete wavelet transform."Proceedings of VIIth Digital Image Computing: Techniques and Applications. Sydney (2003).
- Tang, Jinshan. "A contrast based image fusion technique in the DCT domain."Digital Signal Processing 14.3 pp. 218-226, 2004.
- Phamila, Y. Asnath Victy, and R. Amutha. "Discrete Cosine Transform based fusion of multi-focus images for visual sensor networks." Signal Processing 95 pp. 161-170, 2014.
- Rajalakshmi, S.; Chamundeeswari, V.Vijaya, "Mapping of mineral deposits using image fusion by PCA approach,"Computer Communication and Systems, 2014 International Conference on, pp.24-29, Feb. 2014.
- Radhika, V.; Swamy, V.K.; Srininvas, K.S., "Performance evaluation of statistical measures for image fusion in spatial domain,"Networks & Soft Computing (ICNSC), 2014 First International Conference on, pp.348,354, 19-20 Aug. 2014
- Chuanming Wei; Blum, R.S., "Theoretical analysis of correlation-based quality measures for weighted averaging image fusion,"Information Sciences and Systems, 2009. CISS 2009. 43rd Annual Conference on, vol., no., pp.363,368, 18-20 March 2009
- Sahu, A.; Bhateja, V.; Krishn, A.; Himanshi, "Medical image fusion with Laplacian Pyramids,"Medical Imaging, m-Health and Emerging Communication Systems (MedCom), 2014 International Conference on, vol., no., pp.448,453, 7-8 Nov. 2014.
- Fan Xu; Siuqin Su, "An Enhanced Infrared and Visible Image Fusion Method Based on Wavelet Transform,"Intelligent Human-Machine Systems and Cybernetics (IHMSC), 2013 5th International Conference on, vol.2, no., pp.453, 456, 26-27 Aug. 2013.
- Cao, Liu, et al. "Multi-focus image fusion based on spatial frequency in discrete cosine transform domain." (2015).
- Haghighat, Mohammad Bagher Akbari, Ali Aghagolzadeh, and Hadi Seyedarabi. "Multi-focus image fusion for visual sensor networks in DCT domain."Computers & Electrical Engineering 37.5, pp. 789-797, 2011.
- Haghighat, Mohammad Bagher Akbari, Ali Aghagolzadeh, and Hadi Seyedarabi. "Real-time fusion of multi-focus images for visual sensor networks." Machine Vision and Image Processing (MVIP), 2010 6th Iranian. IEEE, 2010.
- Li, Hui, B. S. Manjunath, and Sanjit K. Mitra. "Multisensor image fusion using the wavelet transform."Graphical models and image processing 57.3, pp. 235-245, 1995.
- Rockinger, Oliver. "Image sequence fusion using a shift-invariant wavelet transform." Image Processing, 1997. Proceedings., International Conference on. Vol. 3. IEEE, 1997.
- Ahn, Hyunchan, Soobin Lee, and Hwang Soo Lee. "Improving color constancy by saturation weighting."Acoustics, Speech and Signal Processing (ICASSP), IEEE International Conference on, 2013.
- Serikawa, Seichi, and Huimin Lu. “Underwater image dehazing using joint trilateral filter.” Computers & Electrical Engineering 40.1, pp. 41-50, 2014.
- Wang, Zhou, et al. "Image quality assessment: from error visibility to structural similarity." Image Processing, IEEE Transactions on 13.4 ,pp.600-612, 2004.
