A school-based survey among adolescents on dietary pattern, exercise, and knowledge of cardiovascular risk factors (ADEK) study
 study")
Author: Munusamy G., Shanmugam R.
Journal: Cardiometry @cardiometry
Section: Original research
Article in issue: 23, 2022.
Free access
Background. Cardiovascular disease is a global emerging problem and its risk starts in children and adolescents. Adolescents have modifiable cardiovascular risk factors that have been found globally, and nationally, and early intervention programs may be able to lower these risks for both individuals and populations. Accurate risk factor evaluation at the individual level is crucial in this situation for the prevention of cardiovascular disease. Objective. The study aimed to investigate cardiovascular disease knowledge and to determine physical activity, and dietary patterns among school-going adolescents in Arakkonam, Tamil Nadu, India. Methods. A school-based cross-sectional survey was conducted to assess cardiovascular disease knowledge among 500 adolescents aged 10-18 from public schools. The study period was from September 2021 to February 2022. The measurement taken on anthropometrics such as height, weight, body mass index, and bio-physiological measurement as blood pressure, structured questionnaire assessed for knowledge, dietary questionnaire assessed previous week food consumption which the investigator developed, and physical activity standard questionnaire assessed the past week’s exercise level. Data were analyzed using IBM Statistical Package for Social Sciences version 20. Results. The mean study population age was 13.7±1.7, 53% were boys, and 47% were girls. Factors like age 16-18 years (p=0.01), site of residence from urban (p=0.001), education of teenagers (p=0.01), and family history of cardiovascular disease (p=0.001) are significantly correlated with the level of knowledge score, with better-educated adolescents having fair knowledge score than others. Level of knowledge score and demographic traits are associated with physical activity, such as 16 to 18 years (p=0.03), living in an urban region (p=0.03), being in a joint household (p=0.001), adolescents who are at higher secondary (p=0.02), and having a family history contribute more to cardiovascular disease (p=0.001) than other variables. Mean days eating diets were egg (4.18±2.27), vegetables (3.92±0.93), milk products (3.85±1.87), fried foods (3.75±1.25), toffees, and chocolates (3.35±1.81) all had higher percentages of consumed foods than others. Conclusion: There is a risk of cardiovascular disease higher among adolescents. Still a need for school-based primordial preventive educational approaches needed to improve to curb this burden.
Adolescent, cardiovascular risk factors, dietary habits, physical activity, schools
Short address: https://sciup.org/148326563
IDR: 148326563 | DOI: 10.18137/cardiometry.2022.23.123132
Text of the scientific article A school-based survey among adolescents on dietary pattern, exercise, and knowledge of cardiovascular risk factors (ADEK) study
Gomathi Munusamy, Ramesh Shanmugam. A School-based survey among adolescents on Dietary pattern, Exercise, and Knowledge of Cardiovascular risk factors (ADEK) Study. Car-diometry; Issue 23; August 2022; p. 123-132; DOI: 10.18137/ cardiometry.2022.23.123132; Available from:
Cardiovascular disease (CVD) are the leading cause of non-communicable diseases (NCDs)-related fatalities world-wide [1], accounting for approximately 17.9 million deaths in 2019 [2]. Around 81 percent of deaths came from developing countries, and more than a third were due to premature mortality [2]. Several modifiable and non-modifiable lifestyle factors have been linked to CVD, both directly and indirectly. Modifiable CVD risk factors were defined as obesity (BMI ≥95th percentile for age and sex), overweight (BMI ≥85 to <95th percentile for age and sex), physical inactivity [3], and unhealthy dietary habits [4]. The non-modifiable risk factor was defined as a family history of CVD. Apart from that, industrialization, urbanization, and economic development all raise the risk of CVD in young people [5,6].The estimated death rate in India due to CVD was 28.1% in 2016 and the number one leading cause of disability-adjusted life years (DALYs) 8.7 % is due to Is chemic Heart Disease [7]. Studies revealed that poor dietary index and less physical exercise among adolescents may prone to raise the risk of CVD in future young adults [8–10].
Health literacy is an important aspect of the prevention and control of CVD. Imparting knowledge on behavioral risk factors may influence a adopting good healthy lifestyle among adolescents, preventing CVD in later life [11,12]. The existing study is aimed to identify the prevalence of CVD by anthropometric measurements, current awareness of CVD, level of physical exercise, and food frequency among adolescents between 10-18 years.
Material and methods
Study design, setting, and population
We conducted a school-based cross-sectional study from September 2021 to February 2022 in the schools at Arakonam, Ranipet district, Tamil Nadu, India. Arakko-nam town is located at latitude and longitude of13º 08’N and 79º66’E respectively, with an elevation of 89.96 meters above sea level. According to the education authority of the Arakkonam, there are 14 public higher secondary schools in the 2021 academic year. The population of interest comprised all school-age children between 10-18 years of both gender in Arakkonam town.
Sampling size
There are eight school clusters at Arakkonam. In total 6,599adolescents were registered as a student in 8 public higher secondary schools in Arakkonam town by the local government school authority bureau. So, the sample was taken from this registered population (N= 6,599). The following assumptions were used for sample size determination based on a single population proportion. Sample size determination was done by using single proportion formula and calculated by EpiInfoTM version 7.2.5.0 (Centres for Disease Control and Prevention, USA). From the formal study13 conducted among school children aged 9-18 years and 25.4% were adequate knowledge of CVD risk factors at a confidence level of 95%,and a design effect of 1.5. The sample size used in the calculation of the derived power was n = 485. Accounting for an estimated non-response or refusal or contingency of 5%, the derived sample size was n = 509.
Sampling technique
A multistage sampling procedure was applied. There were 14 government schools in Arakkonam town. In that, 8government schools were proportionately selected by lottery method. If a school did not agree to participate, the replacement was made by the same type of school like public girls higher secondary replaced by girls and boys replaced by boys. Based on the student population the participants were selected from each school proportionately, using a systematic sampling method according to their roll number from the attendance register was used. The Kth was calculated by dividing the total number of students in each section by the number of school children included in the study. The first partaker was selected randomly between and Kth, the next children were chosen with K value until the required sample saturated (Figure 1) . After the study participant identified, were explained the scope and the objectives of this current study.
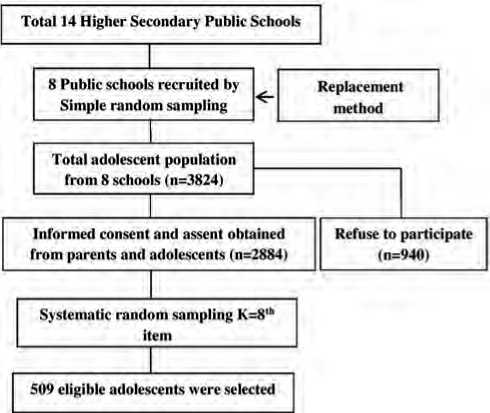
Figure 1. Schematic representation of sampling procedure for cardiovascular risk factors among adolescents
Selection Criteria
The inclusion criteria were: partakers willing to participate, speak regional (Tamil) and English language, given parents’ informed consent, and assent form. The exclusion criteria were: physical disabilities that interfered with exercise, use of continuous medications, and disabling chronic diseases.
Data collection tools and procedures
A structured questionnaire was used to collect demographic profiles and knowledge on CVD risk factors. This study used standardized physical activity (PA) questionnaire (PAQ) to assess the level of PA [14], and a diet frequency questionnaire to assess food patterns for the past 7 days. Data was collected by the trained data collector and an anthropometric measurement was taken by the school health nurse. The team consisted of two supervisors, 4 data collectors, and 2 school health nurses who were trained previously.
Knowledge
A structured questionnaire prepared by the researcher includes general information, risk factors, symptoms, diagnosis, and prevention of CVD risk factors. The score ‘1’ was given for the right answer and ‘0’ was given for the wrong answer. The total score is ‘39’. The knowledge composite score is constructed by summing the scores from each domain and rescaling them to a 100-point scale. Scores were then recoded into three categories: poor score considered ≤ 33%; fair score considered 34 - 67%; good score considered 68 - 100%.
Anthropometrics
Partakers without wearing shoes or bulky clothing, a digital weighing scale (Apollo digital weighing machine, Model No. B15, India) was used to measure the weight of teens (kg) to the nearest 0.1 kg. Height was measured by a Secastadiometer (Model No. 26SM) to the nearest 0.1cm in an upright standing position with the head straight. The nutritional status of adolescents was assessed using body mass index (BMI) which was classified according to the specific reference standard for the age and sex proposed by the World Health Organization (WHO). BMI percentile calculated by WHO classification as underweight (<5th percentile), Normal weight (5th percentile to <85th percentile), overweight (85th percentile to <95th percentile), and obese (>95th percentile) by using WHO anthroplus ap-plication15.
Blood pressure
Blood pressure (BP) was taken in a quiet room by an advance fit automatic BP apparatus (Beep Model No. JZK-877YA).The participant before the measurement asked to relax and sit for 10 minutes. After 10minutes left arm was positioned at the heart level with the appropriate cuff size, and three measurement sat the three-minute interval were performed. The second two mean values were taken for data analysis. BP was considered normal when the systolic and diastolic measures were less than the 90th percentile (<120 sys- tolic BP and <80 Diastolic BP) for the adolescent age, gender, and height. Prehypertension was diagnosed in those adolescents 90th to <95th percentile (120 - 129 systolic BP and <80 Diastolic BP), stage I hypertension was considered 95th to 99th percentile(130 - 139 systolic BP and 80 - 89 Diastolic BP), and stage II hypertension presented with >99th percentile(≥ 140 systolic BP and ≥ 90 Diastolic BP) for the corresponding age, gender, and height of the adolescents [16,17].
Physical activity
A standardized self-reported PA questionnaire was used to measure the exercises performed during the last 7 days as a reference among adolescents. It consists of 9items,a value from 1 to 5 for each item used in the PA composite score, simply took the mean of these 9 items, which results in the final PA activity summary score. A score of ‘1’ indicates low PA, whereas a score of ‘5’ indicates high PA [3].
Diet
A questionnaire designed by the researcher was used to determine how much food was consumed during the preceding seven days.
Statistical analysis
For statistical analysis, the obtained data were coded, double-checked for accuracy, and input into IBM Statistical Package for Social Sciences (SPSS) version 20 windows. All participant characteristics and related risk factors for CVD were reported as descriptive data (frequency, percentages, means, and standard devia-tions).The correlation between categorical variables was examined using the chi-squared test. A one-way ANOVA was utilized to evaluate the mean differences between three or more categorical variables. Kruskal-Wallis test and Mann-Whitney test were used to compare food consumed by the adolescents with age-gender specific. A P-value less than 0.05 were deemed significant.
Ethical clearance
This study was approved by the Institutional review board (File no 05/PhD/LUC/2019) by Narayana College of Nursing, Andhra Pradesh, India. The formal permission was obtained from the District Educational Officer, Arakonam, Tamil Nadu. . The school heads were contacted first, by telephone, and visits were scheduled. School adolescents with parental or legal guardian consent and assent were included. The partaker’s participation was completely voluntary. Confidentiality and anonymity were explained to the study subjects.
Results
A total of 500 adolescents enrolled in Government schools were evaluated. The socio-demographic characteristics were summarized in (Table 1). Our study revealed that adolescents with BMI >95th percentile were 38 (7.6%), >84.9th percentile was 113 (22.6%), and >4.9th percentile were 349 (69.8%). Overall mean systolic BP and diastolic BP were 107.2 (±5.3), and 61.8 (±3.3). Out of 500 adolescents, 492 (98.4%) were having normal systolic BP range and prehypertension was 8 (1.6%). Diastolic BP 495 (99%) was normal and stage 1 hypertension was 5 (1%).
Table 1
Socio-demographic characteristics (n = 500)
|
Variables |
Total % |
|
Age in years |
|
|
10 -12 years |
132 (26.4) |
|
13-15 years |
287 (57.4) |
|
16-18 years |
81(16.2) |
|
Gender |
|
|
Male |
265 (53) |
|
Female |
235 (47) |
|
Place of Living |
|
|
Urban |
341 (68.2) |
|
Rural |
159 (31.8) |
|
Type of Family |
|
|
Nuclear family |
335 (67) |
|
Joint family |
118 (23.6) |
|
Extended family |
47 (9.4) |
|
Education |
|
|
Primary |
133 (26.6) |
|
Middle school |
285 (57) |
|
High school |
82 (16.4) |
|
Father’s Education |
|
|
Post graduate |
86 (17.2) |
|
Graduate |
46 (9.2) |
|
Diploma |
76 (15.2) |
|
Secondary |
67 (13.4) |
|
High school |
86 (17.2) |
|
Middle school |
54 (10.8) |
|
Primary school |
48 (9.6) |
|
Illiterate |
37 (7.4) |
|
Mother’s Education |
|
|
Post graduate |
11 (2.2) |
|
Variables |
Total % |
|
Graduate |
80 (16) |
|
Diploma |
71 (14.2) |
|
Secondary |
82 (16.4) |
|
High school |
82 (16.4) |
|
Middle school |
97 (19.4) |
|
Primary school |
46 (9.2) |
|
Illiterate |
31 (6.2) |
|
Blood pressure was done at Past |
|
|
Yes |
393 (78.6) |
|
No |
107 (21.4) |
|
Family history of cardiovascular disease |
|
|
Yes |
326 (65.2) |
|
No |
174 (34.8) |
|
Information Sources |
|
|
School |
63 (12.6) |
|
Family |
79 (15.8) |
|
Friends |
63 (12.6) |
|
Internet |
216 (43.2) |
|
Radio |
4 (0.8) |
|
TV |
48 (9.6) |
|
Newspaper |
25 (5) |
|
None |
2 (0.4) |
The mean age of the part takers was 13.7±1.7 years. About 57.4% were between 13-15 years of age, 26.4% were 10-12 years, and 16.2% were between 1618 years. 53% were boys, 68.2% were living in urban, majorly belongs to nuclear family 67%, and most of the partakers family history contributes CVD 65.2%. There is a significant association between the level of knowledge score and demographic variables such as age in years, place of living (urban), more educated adolescents, and family history of CVD are having more moderate knowledge scores than others (Table 2).
Adolescent PA level showed (Figure 2) that less than 3. The mean PA summary score was 1.64±0.19. Statistical significance was calculated using one-way analysis of variance F-test and student independent t-test showed that association between level of knowledge score and demographic characteristics with PA such as 16-18 years (15.04 ±1.63), who lives in an urban area (14.64±1.81), joint family (15.28±1.40), adolescents more educated (15.06±1.62), and family history contributes CVD (15.01±1.72) than other variables (Table 3).
Mann-Whitney U-test showed a significant difference between gender-specific on goat meat, chicken, other organ meat, egg, toffees, chocolates, high salted snacks, sweets, fried foods, whole bread, nuts, and
Table 2
Association between level of knowledge and demographic variables (n=500)
|
Variables |
Level of knowledge score |
χ2 (p value) |
||
|
Poorn (%) |
Fairn (%) |
|||
|
Age in years |
10 -12 years |
38 (28.79) |
94 (71.21) |
9.01 (0.01*) |
|
13-15 years |
52 (18.12) |
235 (81.88) |
||
|
16-18 years |
11 (13.58) |
70 (86.42) |
||
|
Gender |
Male |
47 (17.74) |
218 (82.26) |
2.12 (0.15) |
|
Female |
54 (22.98) |
181 (77.02) |
||
|
Place of Living |
Urban |
49 (14.37) |
292 (85.63) |
22.61(0.001*) |
|
Rural |
52 (32.70) |
107 (67.30) |
||
|
Type of family |
Nuclear family |
65 (19.40) |
270 (80.60) |
0.41 (0.81) |
|
Joint family |
26 (22.03) |
92 (77.97) |
||
|
Extended family |
10 (21.28) |
37 (78.22) |
||
|
Education |
Primary |
38 (28.57) |
95 (71.43) |
8.80(0.01*) |
|
Middle school |
52 (18.25) |
233 (81.75) |
||
|
High school |
11(13.41) |
71 (86.59) |
||
|
Father’s Education |
Post graduate |
7 (8.14) |
79 (91.86) |
69.66 (0.001) |
|
Graduate |
2 (4.35) |
44 (95.65) |
||
|
Diploma |
3 (3.95) |
73 (96.05) |
||
|
Secondary |
25 (37.31) |
42 (62.69) |
||
|
High school |
32 (37.21) |
54 (62.79) |
||
|
Middle school |
21 (38.89) |
33 (61.11) |
||
|
Primary school |
7 (14.58) |
41 (85.42) |
||
|
Illiterate |
4 (10.81) |
33 (89.19) |
||
|
Mother’s Education |
Post graduate |
5 (45.45) |
6 (55.55) |
10.82 (0.15) |
|
Graduate |
12 (15.00) |
61 (85.00) |
||
|
Diploma |
20 (28.17) |
51 (71.83) |
||
|
Secondary |
15 (18.29) |
67 (81.71) |
||
|
High school |
24 (29.27) |
58 (70.73) |
||
|
Middle school |
30 (30.93) |
77 (69.28) |
||
|
Primary school |
13 (28.26) |
33 (71.74) |
||
|
Illiterate |
10 (32.26) |
26 (67.74) |
||
|
Blood pressure was done at past |
Yes |
79 (20.10) |
314 (79.90) |
0.11 (0.99) |
|
No |
22 (20.56) |
85 (79.44) |
||
|
Family history of CVD |
Yes |
50 (15.34) |
276 (84.66) |
13.74 (0.001*) |
|
No |
51 (29.31) |
123 (70.69) |
||
|
Information sources |
School |
8 (12.70) |
55 (87.30) |
10.32 (0.17) |
|
Family |
10 (12.66) |
69 (87.34) |
||
|
Friends |
2 (3.17) |
61 (96.83) |
||
|
Internet |
40 (18.52) |
176 (81.48) |
||
|
Radio |
4 (100.00) |
0 (0.00) |
||
|
TV |
31 (64.58) |
17 (35.42) |
||
|
Newspaper |
4 (16.00) |
21 (84.00) |
||
|
None |
2 (100.00) |
0 (0.00) |
||
*P-value < 0.05 is statistically significant
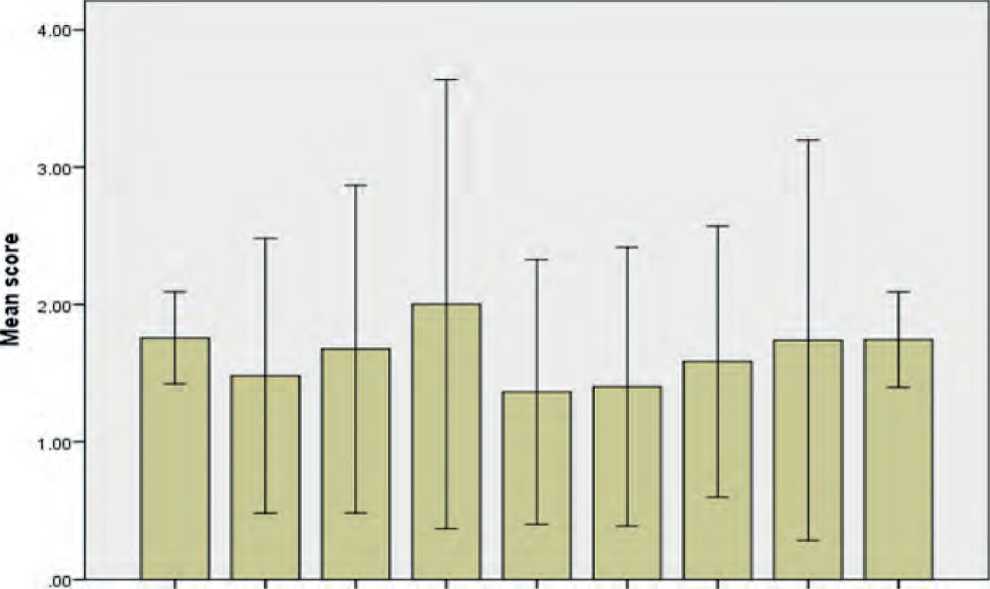
Spare time PE recess lunch right after evening weekends describes Each day activity Softool you best physical activities?
Error bars: +/- 2 SD
Figure 2. Adolescent physical activity score
Table 3
Association between demographic variables and physical activity score
|
Variables |
PA Qactivity score |
ANOVA F test/t-test |
P value |
||
|
n=500 |
Mean (SD) |
||||
|
Age in years |
10 -12 years |
132 |
14.57 (1.47) |
F=3.24 |
0.03* |
|
13-15 years |
287 |
14.96 (1.75) |
|||
|
16-18 years |
81 |
15.04 (1.63) |
|||
|
Gender |
Male |
265 |
14.78 (1.79) |
t=0.46 |
0.64 |
|
Female |
235 |
14.71 (1.53) |
|||
|
Place of Living |
Urban |
341 |
14.64 (1.81) |
t=2.18 |
0.03* |
|
Rural |
159 |
14.99 (1.29) |
|||
|
Type of family |
Nuclear family |
335 |
14.60 (1.78) |
F=8.10 |
0.001* |
|
Joint family |
118 |
15.28 (1.40) |
|||
|
Extended family |
47 |
14.52 (1.18) |
|||
|
Education |
Primary |
133 |
14.57 (1.49) |
F=3.84 |
0.02* |
|
Middle school |
285 |
14.94 (1.75) |
|||
|
High school |
82 |
15.06 (1.62) |
|||
|
Father’s Education |
Post graduate |
86 |
15.25 (2.38) |
F=1.96 |
0.24 |
|
Graduate |
46 |
14.35 (2.59) |
|||
|
Diploma |
76 |
15.31 (2.14) |
|||
|
Secondary |
67 |
15.92 (1.72) |
|||
|
High school |
86 |
14.79 (1.28) |
|||
|
Middle school |
54 |
16.07 (1.22) |
|||
|
Primary school |
48 |
14.09 (1.80) |
|||
|
Illiterate |
37 |
13.07 (2.94) |
|||
|
Variables |
PA Qactivity score |
ANOVA F test/t-test |
P value |
||
|
n=500 |
Mean (SD) |
||||
|
Mother’s Education |
Post graduate |
11 |
14.35 (1.31) |
F=1.54 |
0.27 |
|
Graduate |
80 |
14.09 (1.38) |
|||
|
Diploma |
71 |
14.17 (1.67) |
|||
|
Secondary |
82 |
15.51 (1.07) |
|||
|
High school |
82 |
14.95 (1.27) |
|||
|
Middle school |
97 |
14.70 (1.04) |
|||
|
Primary school |
46 |
14.26 (2.08) |
|||
|
Illiterate |
31 |
14.26 (2.82) |
|||
|
Blood pressure was done at past |
Yes |
393 |
14.77 (1.76) |
t=1.14 |
0.25 |
|
No |
107 |
14.96 (1.29) |
|||
|
Family history of CVD |
Yes |
326 |
15.01 (1.72) |
t=4.82 |
0.001* |
|
No |
174 |
14.27 (1.48) |
|||
|
Information sources |
School |
63 |
14.26 (1.69) |
F=1.73 |
0.10 |
|
Family |
79 |
14.47 (0.77) |
|||
|
Friends |
63 |
14.82 (1.69) |
|||
|
Internet |
216 |
14.81 (1.37) |
|||
|
Radio |
4 |
15.09 (0.02) |
|||
|
TV |
48 |
14.31 (2.57) |
|||
|
Newspaper |
25 |
14.30 (1.78) |
|||
|
None |
2 |
15.30 (1.00) |
|||
*P-value < 0.05 is statistically significant fish. Kruskal Wallis test showed a significant difference between age-wise on goat meat, chicken, beef, pork, liver, kidney, egg, ice creams, high salted snacks, sweets, fried foods, fast foods, fruits, legumes, and fish (Table 4). Percentages of more mean days eating di- ets were egg (4.18±2.27), vegetables (3.92±0.93), milk products (3.85±1.87), fried foods (3.75±1.25), toffees, and chocolates (3.35±1.81). Fewer days eating diets were pork (0.08±0.27), kidney (0.14±0.52), and other organ meat (0.25±0.43).
Table 4
Age and gender wise difference of consuming foods (number of days in a week) among adolescents (n=500)
|
Gender |
Mann Whitney U-test |
P value |
Age in years |
Kruskal- Wallis test |
P value |
||||
|
Male (n=265) |
Female (n=235) |
10 -12 years (n=132) |
13-15 years (n=287) |
16-18 years (n=81) |
|||||
|
M (SD) |
M (SD) |
M (SD) |
M (SD) |
M (SD) |
|||||
|
Goat meat |
0.94 (0.53) |
0.63 (0.59) |
0.31 |
0.001* |
0.56 (0.58) |
0.87 (0.52) |
0.90 (0.68) |
30.11 |
0.001* |
|
Chicken |
1.83 (1.06) |
1.51 (1.24) |
0.32 |
0.03* |
1.13 (1.16) |
1.84 (1.03) |
2.01 (1.30) |
43.01 |
0.001* |
|
Cow Meat |
0.68 (1.49) |
0.42 (1.11) |
0.26 |
0.11 |
0.33 (1.02) |
0.54 (1.28) |
1.00 (1.80) |
9.40 |
0.01* |
|
Pork |
0.09 (0.29) |
0.06 (0.24) |
0.03 |
0.21 |
0.04 (0.19) |
0.08 (0.27) |
0.16 (0.37) |
10.33 |
0.01* |
|
Liver |
0.28 (0.88) |
0.16 (0.64) |
0.12 |
0.17 |
0.11 (0.57) |
0.21 (0.75) |
0.44 (1.07) |
8.40 |
0.02* |
|
Kidney |
0.19 (0.59) |
0.09 (0.42) |
0.10 |
0.10 |
0.08 (0.38) |
0.13 (0.50) |
0.30 (0.71) |
9.45 |
0.01* |
|
Other organ meat |
0.31 (0.46) |
0.17 (0.38) |
0.14 |
0.001* |
0.21 (0.41) |
0.26 (0.44) |
0.25 (0.43) |
1.15 |
0.55 |
|
Egg |
4.78 (1.87) |
3.50 (2.48) |
1.28 |
0.001* |
3.02 (2.67) |
4.64 (1.90) |
4.42 (2.11) |
30.41 |
0.001* |
|
Toffees, chocolates |
3.80 (1.62) |
2.86 (1.88) |
0.94 |
0.001* |
3.27 (1.54) |
3.47 (1.75) |
3.07 (2.34) |
4.48 |
0.11 |
|
Ice cream |
0.87 (0.68) |
0.83 (0.74) |
0.04 |
0.40 |
0.95 (0.65) |
0.84 (0.73) |
0.72 (0.69) |
6.45 |
0.04* |
|
Soft drinks |
1.14 (0.78) |
1.03 (0.88) |
0.11 |
0.07 |
1.18 (0.71) |
1.02 (0.83) |
1.14 (0.98) |
3.99 |
0.13 |
|
Gender |
Mann Whitney U-test |
P value |
Age in years |
Kruskal- Wallis test |
P value |
||||
|
Male (n=265) |
Female (n=235) |
10 -12 years (n=132) |
13-15 years (n=287) |
16-18 years (n=81) |
|||||
|
M (SD) |
M (SD) |
M (SD) |
M (SD) |
M (SD) |
|||||
|
High salted snacks |
4.30 (0.90) |
3.13 (1.99) |
1.17 |
0.01* |
4.20 (1.09) |
3.72 (1.61) |
3.12 (2.09) |
9.50 |
0.01* |
|
Sweets |
3.40 (1.50) |
2.29 (1.75) |
1.11 |
0.001* |
2.52 (1.58) |
3.02 (1.61) |
2.95 (2.16) |
9.15 |
0.01* |
|
Fried foods |
4.15 (0.89) |
3.36 (1.44) |
0.79 |
0.001* |
4.04 (1.04) |
3.75 (1.24) |
3.46 (1.48) |
6.87 |
0.001* |
|
Fast foods |
1.43 (1.13) |
1.31 (0.91) |
0.12 |
0.46 |
1.21(0.83) |
1.33 (1.07) |
1.75 (1.12) |
12.55 |
0.001* |
|
Fruits |
3.07 (1.10) |
3.43 (1.14) |
-0.36 |
0.001* |
3.48 (1.10) |
3.17 (1.08) |
3.06 (1.28) |
8.94 |
0.01* |
|
Vegetables |
3.92 (0.86) |
3.91 (1.00) |
0.01 |
0.81 |
3.98 (0.85) |
3.91 (0.94) |
3.83 (1.01) |
1.18 |
0.55 |
|
Whole bread |
1.13 (0.79) |
0.94 (0.82) |
0.19 |
0.01* |
1.00 (0.71) |
1.07 (0.82) |
1.01 (0.92) |
0.85 |
0.65 |
|
Legumes |
2.89 (1.17) |
3.03 (1.31) |
-0.14 |
0.36 |
3.33 (1.44) |
2.82 (1.17) |
2.84 (0.98) |
10.24 |
0.001* |
|
Milk products |
3.71 (2.02) |
4.01 (1.68) |
-1.69 |
0.09 |
3.70(1.86) |
3.79(1.88) |
4.31(1.81) |
4.53 |
0.10 |
|
Nuts |
0.90 (0.73) |
0.72 (0.80) |
0.18 |
0.01* |
0.73 (0.74) |
0.83 (0.77) |
0.91(0.81) |
2.80 |
0.24 |
|
Fish |
0.90 (0.81) |
0.63 (0.71) |
0.27 |
0.001* |
0.51 (0.75) |
0.88 (0.78) |
0.83 (0.70) |
24.08 |
0.001* |
*P-value < 0.05 is statistically significant
Discussion
The main result of our study suggests that level of knowledge on CVD risk factors among adolescents 20.20% were poor, 79.80% of them were fair knowledge and none of them was a good score. Previous studies reported that 20.21%, 41.0% were inadequate knowledge, 54.4%, 36.5% of them were moderate knowledge, and 25.4%, 22.5% were an adequate level of knowledge among 9-18 years and 14-16 years of school children, its shows that still intervention needed to improve knowledge among adolescents9,13. Overweight and obesity were found to be prevalent in 15 percent and 9.8 percent of the participants, respectively, in the current study. Compared to the previous study13conducted in India that 9.5% were overweight and 11.5% were obese and another study18reported that 23.3% were overweight in a middle-income country, Brazil.
Overall adolescents (n=500), overweight and obese were 15% and 9.8%; 16.23% and 9.06% in boys and 15.32% and 10.64% in girls. It was consistent with previous studies done on India, Nigeria, and Brazil13,19,20. In the present study, a preponderance of systolic and diastolic prehypertension in boys was 27.92% and 130 | Cardiometry | Issue 23. August 2022
27.55%, 26.39% and 30.64% in girls, systolic and diastolic hypertension was 27.92% and 19.62% in boys, 19.15% and 17.45 in girls. In our study, there was a significant difference between gender and blood pressure. A similar result was reported in India and Nige-ria 13,20 .
Our current study revealed total PA mean and SD score was 1.64±0.19. There was a significant difference in the age-wise PA decreased between the age group of 10-15 years and 16-18years (F=3.24), urban than rural (t=2.18), nuclear than joint family (F=8.10), an adolescent who was in high school compared to other adolescents (F=3.84). This result was similar to earlier studies done on Indian school children was 43.8% and Nigerian adolescents (27.9%)13,21. We found that consumption of diet by boys and girls: fruits (3.07%, 3.43%), vegetables (3.92%, 3.91%), legumes (2.89%, 3.03%), milk products (3.71%, 4.01%), goat meat (0.94%, 0.53%), Chicken (1.83%, 1.51%), fish (0.90, 0.71), and high salted snacks (4.30%, 3.13). This result was consistent with the study conducted on Nigerian and Indian adolescents on fruits, vegetables, legumes, milk and milk products, high animal lipid diet, and high salt diet4,20.
Our findings interpreted from the standpoint of public health as a warning and a request for modifications in the way CVD risk factors are managed. Although our statistical model demonstrated that characteristics such as age, gender, living in an urban area, and family history of CVD were strongly related to the number of modifiable CVD risk factors, all adolescents should be included in programs aimed at reducing this number. If we want to actually and significantly reduce the incidence of cardiovascular illnesses worldwide, we need effective school-based interventional strategies.
Our study is limited to the schools at Arakkoam, Tamil Nadu, India. Similar studies should be conducted in different geographical areas. The study did not include other bio-physiological measurements like serum blood glucose and lipid profile. It can be considered in future research. The PA level was only measured as subjective not objective. The use of last week’s dietary recall is dependent on the memory, literacy, and numerical skills of the respondents. Our strength of the study is the high response rate, uniqueness, and administration of tools
Conclusion
Prevalence of CVD risk factors is common among adolescents and mainly kindred with modifiable by simple lifestyle. A low level of knowledge, inadequate PA, high salt diet and high consumption of animal foods, moderate eating of legumes, fruits and, vegetables might aggravate CVD risk factors in adolescents independently of the BMI. In addition, a better understanding of CVD risk factors, regular exercise, and healthy eating practices lowers the likelihood of acquiring overweight, obesity, hypertension, and cardiovascular illnesses, as well as related morbidity. Adolescents who had low levels of knowledge, little PA, and poor food habits need specific intervention measures. It is necessary to conduct school-based experimental investigations on how adolescents’ knowledge, PA, and eating habits influence known and emerging CVD risk factors. Identifying adolescents who are at high risk of CVD is made possible by reliable and meaningful clustering of various CVD risk variables. These teenagers have a higher chance of acquiring cardiovascular problems as adults if they maintain high risk profiles throughout time and migrate to higher risk clusters. The study’s findings are expected to be helpful in developing ways to lower the prevalence of cardiovascular illnesses in adults by beginning preventative interventions in infancy. It is outdated to believe that children do not require medical treatment, and this misconception has to be changed so that everyone is treated equally.
Acknowledgements
The authors express their sincere gratitude to the District Educational Officer, School Heads, and school health nurse, Arakonam taluk, Ranipet district, Tamil Nadu, India who has given support, kind co-operation, and permission for conducting this study. Our thanks and appreciation goes to supervisors, data collectors, and all the adolescents who took part in the survey.
Statement on ethical issues
Research involving people and/or animals is in full compliance with current national and international ethical standards.
Conflict of interest
None declared.
Author contributions
The authors read the ICMJE criteria for authorship and approved the final manuscript.
References A school-based survey among adolescents on dietary pattern, exercise, and knowledge of cardiovascular risk factors (ADEK) study
- World Health Organization (WHO). WHO list of priority medical devices for management of cardiovascular diseases and diabetes [Internet]. WHO medical device technical series. 2021. 1–180 p. Available from: https://apps.who.int/iris/handle/10665/341967
- World Health Organization (WHO). Cardiovascular diseases fact sheet providing key facts and information on risk factors, symptoms, rheumatic heart disease, treatment and prevention, WHO response [Internet]. [cited 2021 Dec 29]. Available from: https://www.who.int/news-room/fact-sheets/detail/cardiovascular-diseases-(cvds)
- Sigmundova D, Ansari W El, Sigmund E, Fromel K. Secular trends: a ten-year comparison of the amount and structure of physical activity and inactivity in adolescents. BMC Public Health [Internet]. 2011;731(11):1–12. Available from: http://www.biomedcentral.com/1471-2458/11/731
- Rathi N, Riddell L, Worsley A. Food consumption patterns of adolescents aged 14-16 years in Kolkata, India. Nutr J [Internet]. 2017 Aug 24;16(1):50. Available from: http://www.ncbi.nlm.nih.gov/pubmed/28836982
- Prabhakaran D, Jeemon P, Roy A. Cardiovascular Diseases in India: Current Epidemiology and Future Directions. Circulation. 2016;133(16):1605–20.DOI: 10.1161/CIRCULATIONAHA.114.008729.
- Petek D, Platinovsek R, Klemenc-Ketis Z, Kersnik J. Do family physicians advise younger people on cardiovascular disease prevention? A cross-sectional study from Slovenia. BMC Fam Pract. 2013;14(1):1. http://www.biomedcentral.com/1471-2296/14/82
- Indian Council of Medical Research India of PHFE and I for HM. India: Health of the Nation’s States The India State-Level Disease Burden Initiative Disease Burden Trends in the States of India 1990 to 2016 [Internet]. Report. 2017. Available from: https://www.healthdata.org/sites/default/files/files/policy_report/2017/India_Health_of_the_Nation%27s_States_ Report_2017.pdf
- Bachani D, Sogarwal R, Shukla SK, Shelat T, Gupta S. Dietary practices and physical activity performed by adolescent in selected districts of India. Indian J Community Heal. 2013;25(2):171–7.
- Kumar S, Ray S, Roy D, Ganguly K, Dutta S, Mahapatra T, et al. Exercise and eating habits among urban adolescents: a cross-sectional study in Kolkata, India. BMC Public Health [Internet]. 2017 Dec 18;17(1):468. Available from: http://bmcpublichealth.biomedcentral.com/articles/10.1186/s12889-017-4390-9
- O’Keefe EL, DiNicolantonio JJ, Patil H, Helzberg JH, Lavie CJ. Lifestyle Choices Fuel Epidemics of Diabetes and Cardiovascular Disease Among Asian Indians. Prog Cardiovasc Dis [Internet]. 2016;58(5):505–13. Available from: http://dx.doi.org/10.1016/j.pcad.2015.08.010
- Ray M, Guha S, Ray M, Kundu A, Ray B, Kundu K, et al. Cardiovascular health awareness and the effect of an educational intervention on school-aged children in a rural district of India. Indian Heart J [Internet]. 2016;68(1):43–7. Available from: http://dx.doi.org/10.1016/j.ihj.2015.10.302
- Samuel P, Antonisamy B, Raghupathy P, Richard J, Fall CHD. Socio-economic status and cardiovascular risk factors in rural and urban areas of Vellore, Tamilnadu, South India. Int J Epidemiol. 2012;41(5):1315–27.DOI:10.1093/ije/dys001
- George GM, Sharma KK, Ramakrishnan S, Gupta SK. A study of cardiovascular risk factors and its knowledge among school children of Delhi. Indian Heart J [Internet]. 2014;66(3):263–71. Available from: http://dx.doi.org/10.1016/j.ihj.2014.03.003
- Kowalski KC, Crocker PRE, Rachel M. Donen. The Physical Activity Questionnaire for older Children (PAQ-C) and Adolescents (PAQ-A) manual. College of Kinesiology, University of Saskatchewan. 2005. 1–38 p.
- Monika Blossner, Siyam A, Borghi E, Onyango A, Onis M de. WHO AnthroPlus for personal computers - software for assessing growth of the world’s children and adolescents [Internet]. 2009. p. 1–54. Available from: http://www.who.int/growthref/tools/en/
- Falkner B, Daniels SR. Summary of the Fourth Report on the Diagnosis, Evaluation, and Treatment of High Blood Pressure in Children and Adolescents. Hypertens (Dallas, Tex 1979) [Internet]. 2004 Oct;44(4):387–8. Available from: http://www.ncbi.nlm.nih.gov/pubmed/15353515
- Ashraf M, Irshad M, Parry NA. Pediatric hypertension: an updated review. Clin Hypertens. 2020;26(1). https://doi.org/10.1186/s40885-020-00156-w
- Jardim TV, Gaziano TA, Nascente FM, De Souza Carneiro C, Morais P, Roriz V, et al. Multiple cardiovascular risk factors in adolescents from a middle-income country: Prevalence and associated factors. PLoS One. 2018;13(7):1–11.https://doi.org/10.1371/journal.pone.0200075
- Jardim TV, Gaziano TA, Nascente FM, Carneiro C de S, Morais P, Roriz V, et al. Multiple cardiovascular risk factors in adolescents from a middle-income country: prevalence and associated factors. Kirchmair R, editor. PLoS One [Internet]. 2018 Jul 5; 13(7): e0200075. Available from: http://www.ncbi.nlm.nih.gov/pubmed/29975756
- Odunaiya NA, Louw QA, Grimmer KA. Are lifestyle cardiovascular disease risk factors associated with pre-hypertension in 15-18 years rural Nigerian youth? A cross sectional study. BMC Cardiovasc Disord [Internet]. 2015;15(1):1–10. Available from: http://dx.doi.org/10.1186/s12872-015-0134-x
- Odunaiya NA, Grimmer K, Louw QA. High prevalence and clustering of modifiable CVD risk factors among rural adolescents in southwest Nigeria: Implication for grass root prevention. BMC Public Health [Internet]. 2015;15(1):1–9. Available from: http://dx.doi.org/10.1186/s12889-015-2028-3
