A Solution for Monitoring Temperature and Humidity at 31 Explosive Materials Company

Author: Chien Thang Vu, Trung Hieu Nguyen
Journal: International Journal of Engineering and Manufacturing @ijem
Article in issue: 3 vol.14, 2024.
Free access
Assuring product safety and quality in the explosives manufacturing process is critical today to protect worker and environmental safety. Temperature and humidity in the manufacturing plant are critical factors to consider because they can impact the manufacturing process and the quality of the final product. In this work, we design a temperature and humidity monitoring system for 31 explosive materials company using ethernet communication standard. In explosives factories, this communication standard is more suitable than other commonly used wireless communication technologies. We tested the system at 31 explosive materials factory. Test results show that the system operates stably and accurately. This system assists factory operators in increasing production efficiency, reducing dangers, and ensuring the quality of explosives.
Sensor Network, Temperature and Humidity Monitoring System, Explosive Materials Company, Ethernet Communication, Hardware and Software Solutions for Monitoring System
Short address: https://sciup.org/15019335
IDR: 15019335 | DOI: 10.5815/ijem.2024.03.05
Text of the scientific article A Solution for Monitoring Temperature and Humidity at 31 Explosive Materials Company
Trinitrotoluene (TNT) is a powerful explosive that is commonly used in the defense and civil industries. It is produced by a complex chemical process in which temperature and humidity play critical roles. The trinitrotoluene production process involves a series of chemical reactions. Firstly, toluene is mixed with nitric acid and sulfuric acid in a reaction vessel at a controlled temperature. This process produces dinitrotoluene (DNT). Subsequently, DNT is mixed with a greater quantity of nitric acid and sulfuric acid to generate trinitrotoluene. In reality, to have a usable trinitrotoluene explosive end product, several technological stages must be passed, such as refining the substance, mixing additives, drying, packaging, and preserving. All these processes demand strict control over the temperature and humidity of the manufacturing environment.
Temperature is an important factor in the manufacture of trinitrotoluene. If the temperature is too low, the chemical reaction may not take place or will take place more slowly. If the temperature rises too quickly, an explosion may occur. As a result, perfect temperature control throughout the manufacturing process is critical.
Trinitrotoluene quality can also be affected by humidity. Water may penetrate the product if the humidity in the air or in the raw materials is too high, altering the properties of the trinitrotoluene and lowering its quality. Water infiltration can affect trinitrotoluene's explosive power as well as its sensitivity to temperature and pressure.
Therefore, temperature and humidity must be strictly controlled during the trinitrotoluene manufacturing process. Any sudden changes in both of these factors could have a negative impact on product quality and production efficiency. As a result, understanding this process and how temperature and humidity affect it is critical.
Currently, the methods of monitoring temperature and humidity at 31 explosive materials company lack the required accuracy and flexibility, potentially affecting the production process and final product quality. The goal of this research is to propose and implement a temperature and humidity monitoring system at 31 explosive materials company. We hope to create an accurate and dependable monitoring system that allows for real-time tracking and adjustment of temperature and humidity by utilizing modern methods and technologies. The system will help the company improve production efficiency, reduce risks, and ensure trinitrotoluene product quality.
The rest of this paper is organized as follows. First, we present related works; then, we propose solutions for monitoring temperature and humidity at 31 explosive materials company; and finally, at the end of this paper, we provide some conclusions.
2. Related Works
We surveyed a number of current methods to solve the problem of monitoring temperature and humidity at 31 explosive materials company, as follows:
Traditional manual method can use thermometers, hygrometers, and combined devices such as mercury thermometers and hair hygrometers placed in necessary positions to monitor temperature and humidity. Human resources are arranged to monitor and record measurements of these devices on a regular basis at intervals of 15 minutes, 30 minutes, 1 hour, or longer, depending on the location of the thermometer and hygrometer and the technological task at that position. The benefits of this method include its simplicity, ease of use, lack of technical requirements, and low cost. However, it requires human intervention and does not give continuous, instantaneous data, which can result in errors when reading and recording.
Another method is to use a SCADA (Supervisory Control And Data Acquisition) system [1] to collect data from auxiliary devices such as sensors, PLCs (Programmable Logic Controllers), and various monitoring stations located throughout the factory. The advantage of this method is that it allows for automation of the monitoring and control process, reducing the need for human intervention. However, this approach requires regular maintenance and updates in addition to a high initial cost. Deployment and maintenance of the system require the involvement of an exclusive provider, either indirectly or directly.
In this paper, we use sensor network technology to design an accurate and dependable temperature and humidity monitoring system. Several communication standards are currently available that could be used for sensor networks. These communication standards are divided into two categories: wireless standards such as Zigbee[2], WiFi[3], LoRa[4], GPRS/3G/4G[5], and Bluetooth[6], and wired standards such as Ethernet [7], Power Line Communication (PLC)[8]. Wireless standards have the advantage of being simple to deploy and install, but they are not appropriate for explosive materials company. Technical regulations on safety in the manufacturing, testing, acceptance, storage, transportation, use, and destruction of industrial explosives and storage of explosive precursors states that radio frequency wave emitting and receiving devices should not be used. As a result, we propose a solution in this paper that makes use of the wired ethernet communication standard. This is a widely used wired standard that enables sensor nodes to communicate with servers via the TCP/IP protocol suite [9].
3. Experimental Design and Implementation 3.1 Hardware Solution
In this paper, we present a temperature and humidity monitoring system built on an arduino uno, a DHT11 sensor, and a W5100 ethernet shield module. This solution provides an efficient, cost-effective, and easy-to-implement solution. Fig.1 illustrates the hardware block diagram.
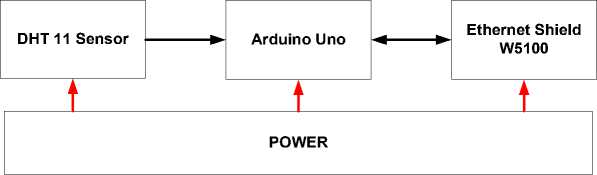
Fig. 1. Hardware block diagram
The microcontroller of the sensor node is the arduino uno, which is chosen due to its user-friendly programming interface, affordable cost, and compatibility with a wide range of sensors. The arduino uno reads data from the DHT11 sensor and transmits it through the W5100 ethernet shield module. The DHT11 sensor measures humidity and temperature in the air with high accuracy. The W5100 ethernet shield module attaches directly to the arduino uno, allowing the arduino uno to connect to the LAN and transmit data over the network.
The embedded software's algorithm flowchart for the sensor node is shown in Fig.2. The microcontroller first establishes links with peripherals. Following the setup stage, the DHT11 sensor provides temperature and humidity data to the microcontroller. The T and H variables contain the data, respectively. The temperature and humidity data will be transmitted to the server if the sensor node is connected to it and the data is valid. There's an established duration before repeating this process.
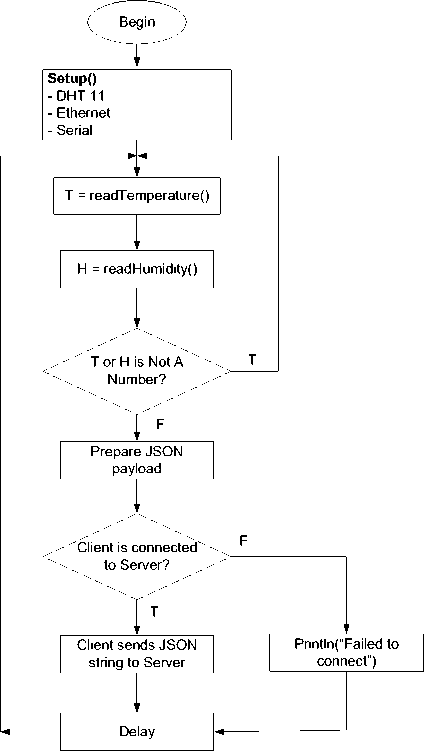
Fig. 2. Algorithmic flowchart
-
3.2 Software Solution
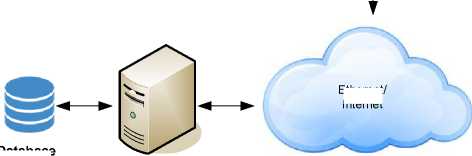
Fig.3 illustrates the system deployment model at 31 explosive materials company.

Web Client
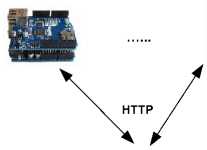
HTTP
Ethernet/ Internet
Database
Web API
Socket Server
Fig. 3. System deployment model
Sensor node

Router
Sensor node

The sensor nodes periodically read environmental temperature and humidity data from the DHT11 sensor and transmit the data via LAN to the server. The data received from sensor nodes is processed using Web API and stored in a SQL Server database. This process ensures the secure storage and future accessibility of the data collected from sensor nodes. The Socket Server retrieves the data from the SQL Server and forwards the data to the Web Client, ensuring the data is continuously and real-time updated to the end user. When the data received from the Socket Server, the Web Client will process and display that data on the web browser. The displayed data includes temperature and humidity values read from the DHT11 sensor. Users can monitor the data from any location via the web browser, helping them to immediately determine the situation and make any necessary adjustments as soon as possible.
This temperature and humidity monitoring system is not only simple to implement, but also optimizes performance and improves end-user interaction by combining hardware components such as the arduino uno, DHT11 sensor, and W5100 ethernet shield with software solutions such as web API, socket server, and web client.
4. Results and Discussion
We deployed and evaluated the system at 31 explosive materials company. The results of evaluation are as follows: The microcontroller accurately reads and sends the data from the DHT11 sensor to the web API server; the data is received, processed correctly by the web API server, and then stored in the SQL Server database; the web API server provides the expected results and can process requests from other devices via HTTP; no errors occurred during testing, and the system operated stably and reliably. Fig.4 illustrates the evaluation results for the data stored in the SQL Server database.
у****** Script for selectTopNRows command from SSMS ******/
□SELECT TOP 1 [Temperature]
.[Humidity]
,[SensorName]
дм]
,[time]
FROM [LUANVAN].[dbo].[SensorData]
order by time desc
100 % -
S Results ^ Messages

Fig. 4. Testing results of the data recorded in the SQL Server database
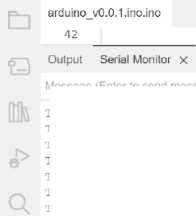
The comparison results between the measured the data from the sensor nodes and the historical data log obtained from the web API server are shown in Fig.5.
New Line
Humid!L у;
Temperature:
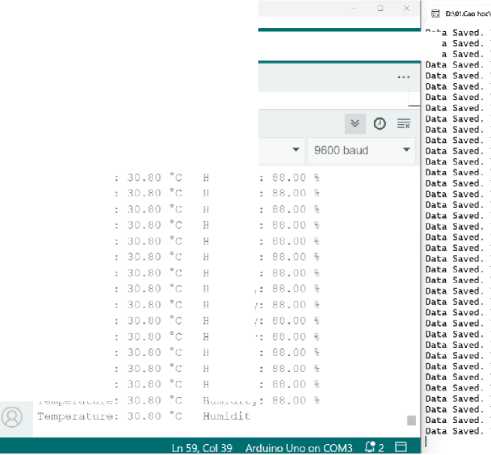
Fig. 5. Comparison between sensor node data and historical data log obtained from the web API

|
©OS |
»p Arduino Uno ▼ |
0 |
Data Data Data |
Message (Enter to send messt
Temperature; Temperature: Temperature: Temperature: Temperature: Temperature: Temperature:
Temperature; Temperature; Temperature: Temperaturc: Temperature: Temperature:

Humidity: Humidity: Humidity: Humidi t у: Humidi t у: Humidi ty:
Humidity Humidi t у: Humidity: Humidi t у: Humidity: Humidity:
i U*r\Mori
|
Temperature: 30.8, |
Humidity: 88, |
SensorName: xuongTNTOl |
|
Temperature: 30.8, |
Humidity: 88, |
SensorName: xuongTNTOl |
|
Temperature: 30.8, |
Humidity: 89, |
SensorName: xuongTNTOl |
|
Temperature: 30.8, |
Humidity: 89, |
SensorName: XuongTNTOl |
|
Temperature: 30.8, |
Humidity: 88, |
SensorName: xuongTNTOl |
|
Temperature: 30.8, |
Humidity: 88, |
SensorName: xuongTNTOl |
|
Temperature: 30.8, |
Humidity: 88, |
SensorName; xuongTNTOl |
|
Temperature: 30.8, |
Humidity: 88, |
SensorName: xuongTNTOl |
|
Temperature: 30.8, |
Humidity: 88, |
SensorName: xuongTNTOl |
|
Temperature; 30.8, |
Humidity: 88, |
SensorName: xuongTNTOl |
|
Temperature: 30.8, |
Humidity: 88, |
SensorName: xuongTNTOl |
|
Temperature: 30.8, |
Humidity: 88, |
SensorName: xuongTNTOl |
|
Temperature: 30.8, |
Humidity: 88, |
SensorName: xuongTNTOl |
|
Temperature: 30.8, |
Humidity: 88, |
SensorName: xuongTNTOl |
|
Temperature: 30.8, |
Humidity: 88, |
SensorName: xuongTNTOl |
|
Temperature: 3D.8, |
Humidity: 88, |
SensorName: xuongTNTOl |
|
Temperature: 30.8, |
Humidity: 88, |
SensorName: xuongTNTOl |
|
Temperature; 30-8, |
Humidity: 88, |
SensorName; xuongTNTOl |
|
Temperature: 30.8, |
Humidity: 88, |
SensorName: xuongTNTOl |
|
Temperature: 30.8, |
Humidity: 88, |
SensorName: xuongTNTOl |
|
Temperature: 30.8, |
Humidity: 88, |
SensorName: xuongTNTOl |
|
Temperature: 30.8, |
Humidity: 88, |
SensorName: xuongTNTOl |
|
Temperature: 30.8, |
Humidity: 88, |
SensorName: xuongTNTOl |
|
Temperature: 30.8, |
Humidity: 88, |
SensorName: xuongTNTOl |
|
Temperature: 38.8, |
Humidity: 88, |
SensorName: xuongTNTOl |
|
Temperature: 38.8, |
Humidity: 88, |
SensorName: xuongTNTOl |
|
Temperature: 30.8, |
Humidity; 88, |
SensorName: XuongTNTOl |
|
Temperature; 30-8, |
Humidity: 88, |
SensorName: xuongTNTOl |
|
Temperature: 30.8, |
Humidity: 88, |
SensorName: xuongTNTOl |
|
Temperature: 30.8, |
Humidity: 88, |
SensorName; xuongTNTOl |
|
Temperature: 30.8, |
Humidity: 88, |
SensorName: xuongTNTOl |
|
Temperature: 30.8, |
Humidity: 88, |
SensorName: xuongTNTOl |
|
Temperature: 30.8, |
Humidity: 88, |
SensorName: xuongTNTOl |
|
Temperature: 30.8, |
Humidity: 88, |
SensorName: xuongTNTOl |
|
Temperature: 38.8, |
Humidity: 88, |
SensorName: xuongTNTOl |
|
Temperature: 38.8, |
Humidity: 88, |
SensorName: xuongTNTOl |
|
Temperature: 30.8, |
Humidity: 88, |
SensorName: xuongTNTOl |
|
Temperature: 30.8, |
Humidity: 88, |
SensorName; xuongTNTOl |

Fig.6 illustrates the results of testing the accuracy and completeness of the data. The data is transmitted from the backend to the frontend via Socket.IO. We make a comparison between the data received at the backend and the data displayed on the web interface. Test results show that the data transmitted from backend to frontend is complete and accurate.
i.K £3 Elements Console » Bl® ; X
E 0 top ▼ ^> Filter ®
Default levels ▼ 1 Issue: В 1
e .• '2023-07- 27713:08:39.553Z'}
Chart,is:S3
{Temperature: 28.399999618536273, Humidity:
-
► 89, SensorName: ' xuongTNT01', Id: 27234, tim
e: '2023-87-27713:08:48. 563Z’}
{Temperature: 28.399999618538273, Humidity:
-
► 89, SensorName; 'xuong7NT91', Id; 27234, tim
e: '2823-07-27713:08:48.563Z'}
{Temperature: 28.399999618530273, Humidity:
-
► 89, SensorName: 'xuongTNT01', Id: 27234, tim
e: '2823-07-27713:08:48.563Z'}
{Temperature: 28.399999618538273, Humidity:
-
► 91, SensorName: ' xuong7NT01 ’, Id: 27235, tim
e: '2023-07-27713:08:43.673Z'}
{Temperature: 28.399999618538273, Humidity:
t 91, SensorName: ‘ xuongTNT01 ’, Id: 27236, tim
e: '2823-07-27713:08:44.683Z’}
{Temperature: 28.299999237068547, Humidity:
-
► 94, SensorName: 'xuongTNT01', Id; 27237, tim
e: '2823-07-27713:08:45.728Z'}
{Temperature: 28.299999237060547, Humidity:
► 94, SensorName; 'xuongTNTQl ’, Id; 27238, tim e: '2823-07-27713:08:46.738Z'}
 5. Conclusion
Fig. 6. Results of testing the accuracy and completeness of the data
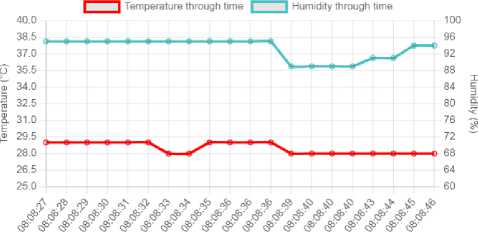
Fig.7 is the test result when we installed and deployed the system at 31 explosive materials company. The temperature and humidity of the surrounding air in the sensor node's deployment area were affected by us. Test results show that changes in environmental temperature and humidity are updated in real time on the web interface. Users can monitor and promptly adjust environmental temperature and humidity parameters when necessary.
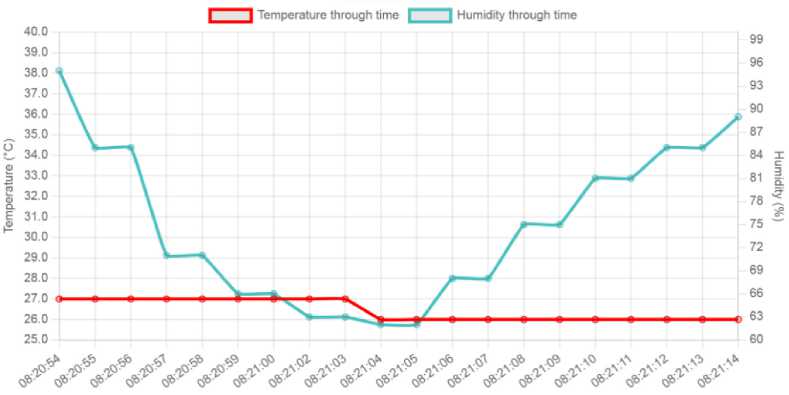
Fig. 7. The system test results for received temperature and humidity data
This work presented solutions for monitoring temperature and humidity at 31 explosive materials company using the wired sensor network based on the ethernet communication standard. Ethernet communication technology is deemed more feasible and appropriate for 31 explosive materials company than other wireless communication technologies. Our solutions have been successfully deployed and tested at 31 explosive materials company. The outcomes of the experimental evaluation demonstrate that the system functions reliably and precisely, allowing factory operators to detect and adjust temperature and humidity parameters at 31 explosive materials company in response to sudden data changes.
References A Solution for Monitoring Temperature and Humidity at 31 Explosive Materials Company
- L Manoj Kumar Yadav; K Dhineshkumar; R Mythili; B Arthi (2023). Optimization of Industrial Power Systems through Automated Humidity and Temperature Surveillance based on PLC and SCADA. 2023 4th International Conference on Electronics and Sustainable Communication Systems (ICESC).
- Alberto Coboi, Minh T.Nguyen, Kien T.La and Thang C.Vu (2023). Wireless Sensor Network Based Gas Monitoring System Utilizing ZigBeeTechnology. Journal of Electronics and Electrical Engineering. Volume 2 Issue 2.
- M. Park (2015). IEEE 802.11ah: sub-1-ghz license-exempt operation for the internet of things. IEEE Communications Magazine, vol. 53, no. 9, pp. 145-151.
- N. Sornin, M. Luis, T. Eirich, T. Kramp, and O.Hersent (2015). Lorawan specification. LoRa Alliance.
- J. Lee, Y. Kim, Y. Kwak, J. Zhang, A. Papasakellariou, T. Novlan, C. Sun and Y. Li (2016). LTE-advanced in 3GPP Rel -13/14: an evolution toward 5G. In IEEE Communications Magazine, vol. 54, no. 3, pp. 36-42.
- C. Gomez, J. Oller, and J. Paradells (2012). Overview and evaluation of Bluetooth low energy: An emerging low-power wireless technology. In Sensors, vol. 12, no. 9, pp. 11734-11753.
- Institute of Electrical and Electronics Engineers (2022). 802.3-2022 - IEEE Standard for Ethernet.
- Latha N, Usha Surendra, Malathi M (2021). Power Line Communication Parameters in Smart Grid for Different Power Transmission Lines. IEEE 8th Uttar Pradesh Section International Conference on Electrical, Electronics and Computer Engineering (UPCON).
- Emilio Mazzon (2000). Review: A Guide to the TCP/IP Protocol Suite. ITNOW, Volume: 42, Issue: 6.
