A stochastic model for simple document processing

Author: Pierre Moukeli Mbindzoukou, Arsène Roland Moukoukou, David Naccache, Nino Tskhovrebashvili
Journal: International Journal of Information Technology and Computer Science @ijitcs
Article in issue: 7 Vol. 11, 2019.
Free access
This work focuses on the stationary behavior of a simple document processing system. We mean by simple document, any document whose processing, at each stage of its progression in its graph of processing, is assured by a single person. Our simple document processing system derives from the general model described by MOUKELI and NEMBE. It is about an adaptation of the said general model to determine in terms of metrics and performance, its behavior in the particular case of simple document processing. By way of illustration, data relating to a station of a central administration of a ministry, observed over six (6) years, were presented. The need to study this specific case comes from the fact that the processing of simple documents is based on a hierarchical organization and the use of priority queues. As in the general model proposed by MOUKELI and NEMBE, our model has a static component and a dynamic component. The static component is a tree that represents the hierarchical organization of the processing stations. The dynamic component consists of a Markov process and a network of priority queues which model all waiting lines at each processing unit. Key performance indicators were defined and studied point by point and on average. As well as issues specific to the hierarchical model associated with priority queues have been analyzed and solutions proposed; it is mainly infinite loops.
Document processing, workflow, hierarchic chart, counting processes, stochastic models, waiting lines, Markov processes priority queues
Short address: https://sciup.org/15016373
IDR: 15016373 | DOI: 10.5815/ijitcs.2019.07.06
Text of the scientific article A stochastic model for simple document processing
Published Online July 2019 in MECS
With the Internet development, e-Government [1-6] is experiencing a huge expansion particularly characterized by a massive document exchange and consequently a large increase in the workload related to the processing of documents [7-8]. As MOUKELI and NEMBE raised in [9], the management of documents flow in both public and private administrations ‘‘is of both deterministic and random nature and becomes a problem of great scientific, technologic and economic interest’’. The nature and specificity of these documents being varied, in this paper we focused on simple documents that represent, according to our estimates, over 70% of the mass of documents processed.
We mean by simple document, a document whose processing is provided at all times by one person at a time. We have adapted MOUKELI and NEMBE model [9] to the simple document processing case, by proposing a mathematical formalization adapted to this problem and performance analysis based on realistic assumptions.
Our choice to study simple documents workflow, as a specific model from the general model described by MOUKELI and NEMBE [9], is motivated by the particular nature of the processing graph of simple documents and by the dynamic data structure presents at each node of the said graph. Indeed, the traffic of simple documents is organized according to a graph which is generally a tree reflecting the hierarchical organization of the administration in charge of handling such documents.
Moreover, at each workstation or node receiving simple documents to be processed, these are stored in a priority queue [11-12]. So, we found it useful to study the behavior of a simple document processing system by examining the properties of the processing graph and the behavior of a priority queue associated with each node of the tree. This system (graph of priority queues) is susceptible to saturate and loops can appear in the document processing cycle. Our model finely analyzes these situations in order to identify or predict them. One of the main objectives was stated by MOUKELI and NEMBE [9], namely "when a document is inserted into the system, the path it follows should benefit from a priori knowledge on how the system behaves for similar documents’’. Hence the need to define necessary metrics to improve the decision-making process, by using, as suggested by Van der Aalst [13], stochastic models, and especially queues [11] to lead this analysis at the strategic level. Finally, it should also be noted that document processing is part of the workflow domain, for which a great amount of research has been devoted [14-23].
The second part of this article presents related works. The third part supplements the definitions proposed by MOUKELI and NEMBE [9]. The fourth part sets out in more detail the problem briefly described in the preceding paragraph; this problem is illustrated by a practical case presenting data from an observation of an administrative workstation for six years. The fifth part is devoted to the description of our simple document processing model; starting with general considerations, we describe our mathematical model with its static and dynamic components. The sixth part is devoted to the study of the performances of the system; in particular, it presents the main performance indicators of static and dynamic models, as well as those relating to system saturation and infinite loop detection.
-
II. Related Works
MOUKELI and NEMBE [9] described a general model for document processing. Remember that document processing is a process close to the production management, or more generally, the workflow [20-23], with one fundamental difference: in the case of a document processing system, outputs can become system inputs, as in sequential systems. This justifies the use of Markov processes in the general model proposed by MOUKELI and NEMBE [9].
Our contribution, which is a continuation of the work of MOUKELI and NEMBE, focuses on the workflow of simple documents, as a specific model. Indeed, the processing of simple documents is organized according to a hierarchical tree graph. We were therefore interested in studying the adaptation of the general model to this specific case, in particular by examining the properties of the processing graph and the behavior of the priority queue associated with each node of the processing chart.
-
III. Definitions
In a previous article [9], concepts related to document processing were defined. These include, as a reminder, the following concepts: managerial unit, document, processing, processing time, service time, waiting time, station or processing unit, document transmission, document processing graph, organization chart, document tracking. In addition, the five definitions below.
Definition 1: Simple document. A simple document is any document whose treatment, at each stage of its progression in its processing graph, is provided by a single person. No copy or part of the document can be processed at the same time in another workstation. In the remainder of this article, unless otherwise specified, the term document will refer to a simple document.
Definition 2: Mail. According to Wikipedia, "mail refers to written correspondence between people, usually two: a sender who sends it and a recipient who receives it". In the field of our study, these are handwritten or typed letters, on paper or dematerialized, exchanged along a hierarchical line.
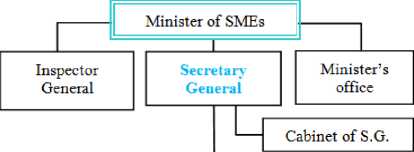
Definition 3: hierarchical organization chart. This is a tree representing a vertical organization. The upstream nodes, whose roots represent the chiefs or hierarchical superiors, while the nodes in front, whose leaves correspond to the subordinates or collaborators. An example of a flowchart is given in Fig. 1. A hierarchical organization chart can be represented by a tree with the highest hierarchical root; it can also represent the entry point into the system.
Definition 4: Hierarchical level. This is the position of a person in a hierarchical organization chart relative to the highest hierarchical leader. Formally: let G = (V , E , R ) be a tree modeling a hierarchical organization chart, of which V is the set of nodes; E all the edges; and R e V , the root. The hierarchical level of a node x e V is the length of the path [ R , x ] ; that is, the number of edges constituting the path from the root R to the node x . It is in fact a function h defined as follows:
h :
V ^N x [R,x]
In this formula, [ R , x ] is the length of the path [ R , x ] , provided that h ( R ) = 0.
Definition 5: Hierarchical line. It is a path from a hierarchical superior to his subordinate in a hierarchical organization chart. The hierarchical line is the path that follows information from a superior to his subordinate or vice versa. For example, in Fig. 1, the axis "Minister -Secretary General - Director General of SMEs - Director of Studies - Head of Service Approval" is a hierarchical line. Formally: let G = (V,E,R) be a tree modeling a hierarchical organization chart, V is the set of nodes; E all the edges; and R e V, the root. A hierarchical line is a tuple (x x ...x ) defined as follows:
( x i , x i + 1 ) e E
- and
h ( x i ) < h ( x i + 1 )
documents processed are simple documents, the most emblematic of which is mail. According to the noticed practices, the hierarchical leader does not often have tools allowing him to know the performances of the system [24] when new simple documents are introduced there. In addition, 10% of these documents get lost in the line of processing, for lack of traceability.
To illustrate this problem, we will present the practical case of a processing station of a Gabonese administration, namely, the General-Secretariat of a ministry, observed by us during the period 2004 - 2009, that is six years. Fig.
-
1 below places this station in the Ministry's organizational chart.
-
IV. The problem of Simple Document Processing
The general problem of the treatment of documents was raised by MOUKELI and NEMBE [9]. In short, document processing occupies a central place in the everyday life of public and private administrations at the level of all jobs; sustainable development and preservation of nature require. The control of this flow (more and more digital) escapes human operator overtimes, which are responsible for monitoring and processing information without adequate tools. This is why the analysis and the follow-up of this flow are necessary for better processing of the documents. For example, one could better identify the points of inertia or bottlenecks, master the capabilities of the system and predict its behavior under certain conditions.
To facilitate the analysis of this data flow, MOUKELI and NEMBE [9] have proposed a general mathematical model to represent it and predict its behavior. They deduced properties that could lead to performance metrics for document processing systems. The purpose of the present study is to adapt this general model to the particular case of simple documents. This study is motivated by the following observation: in both public and private administrations, more than 70% of the
Director
General of SMEs
Director
General of PROMOGABON
Director General of F AGA
Administrative and Financial Director
|
Head of Training Service |
Head of management and control Service |
|
1 |
1 |
1 |
|
|
Research Officers |
Research Officers |
Research Officers |
Fig.1. Functional organization chart of the Gabonese Ministry of SMEs, 2004-2009, (Pavers in bold: non-detailed organization of two trust bodies).
Director of Studies
|
Head of |
Head of |
|
Studies |
Service |
|
Department |
Approvals |
Research Officers
Table 1. Classification of documents processed by the Secretary General 2004-2009 (Pavers in bold: non-detailed organization of two trust bodies)
|
Document type |
Number of processed documents |
Requestors |
Recipients |
||||||
|
Minister |
SG |
subordinates |
External |
Minister |
SG |
Subordinates |
External |
||
|
Speeches & Communication |
16 |
0 |
13 |
3 |
0 |
12 |
1 |
0 |
3 |
|
Memos |
90 |
0 |
90 |
0 |
0 |
3 |
0 |
61 |
26 |
|
Matches |
1000 |
10 |
935 |
5 |
50 |
465 |
0 |
168 |
367 |
|
Financial Documents |
95 |
1 |
65 |
18 |
11 |
28 |
52 |
0 |
15 |
|
Administrative documents |
202 |
0 |
150 |
8 |
44 |
186 |
0 |
13 |
3 |
|
Reports |
52 |
1 |
44 |
7 |
0 |
42 |
7 |
0 |
3 |
|
Technical Sheets or Projects |
63 |
2 |
46 |
15 |
0 |
59 |
0 |
0 |
4 |
|
Conventions |
4 |
2 |
1 |
1 |
0 |
4 |
0 |
0 |
0 |
|
Miscellaneous |
238 |
0 |
134 |
4 |
100 |
64 |
47 |
7 |
120 |
|
Legislative and regulatory texts |
16 |
0 |
11 |
0 |
5 |
13 |
0 |
0 |
3 |
|
1776 |
16 |
1489 |
61 |
210 |
876 |
107 |
249 |
544 |
|
We have classified the documents processed by the Secretary-General into several types ranging from speeches to legislative and regulatory texts (Table 1). The origins (applicants) of the documents are the hierarchical superior who is the Minister, the subordinates of the Secretary-General (SG), who are the Director Generals and other collaborators, as well as the Secretary-General himself and the external natural or legal persons to the Ministry.
The recipients of the documents are the SecretaryGeneral himself for working documents, the Minister, the subordinates, and persons outside the Ministry. Certain documents intended for external persons are transmitted by the Secretary-General's Office to the Minister for signature before being sent to the final recipient. Only the 1776 documents whose content was produced by the station over a period of six years are listed here.
A much bigger crowd of documents is not covered, including documents in simple transit for visas, documents examined in working sessions, documents for signature or countersignature, as well as documents seized or formatted by secretaries from the Cabinet of the Secretary-General. We note that 1344 (or 76%) of the 1776 documents are classified as Simple Documents (orange lines).
The Table 2 shows, for each type of document, the priority level and the mean service time (MST). This time covers the design, control, and validation (signature, countersignature or visa) of the document. This service time is measured in hours of work.
Table 2. Document priority level and mean service time (MST).
|
Document Types |
Priority level |
Number of documents |
MST |
TST |
|
Speeches & Communication |
1 |
16 |
8 |
128 |
|
Memos |
2 |
90 |
1 |
90 |
|
Matches |
3 |
1000 |
1,5 |
1500 |
|
Financial Documents |
4 |
95 |
16 |
1520 |
|
Administrative documents |
5 |
202 |
0,5 |
101 |
|
Reports |
6 |
52 |
16 |
832 |
|
Technical Sheets or Projects |
7 |
63 |
20 |
1260 |
|
Conventions |
8 |
4 |
40 |
160 |
|
Miscellaneous |
9 |
238 |
1 |
238 |
|
Legislative and regulatory texts |
10 |
16 |
12 |
192 |
|
TOTAL |
1776 |
3,4 |
6021 |
With regard to Table 2, we notice that the time taken to serve Simple Documents (orange lines) is 2057 hours, represents 34% of the total service time (TST) which is of 6021 hours. We remind you that it is about average time, because in practice the service time of some documents can be very short (copy-paste with minimal adaptations in the case of the administrative documents) or lengthened in particular by the numerous external requests of the decision-maker who is the Secretary General of the
Ministry (for example the reception of a telephone call during the service).
-
V. Modeling a System of Simple Document Processing
In the previous section, we presented the problem of simple document processing. In this part, we now detail the general model for describing the behavior of a simple document processing system. Beginning with an overview of the general considerations of the model, we will describe our mathematical model with its static and dynamic components
-
A. General considerations on the model
The graph is the most appropriate mathematical tool for modeling the interactions generated by the exchange of documents between processing stations. In the case of a hierarchical organization, this graph is reduced to a tree: T = ( V , E , R ) ; where V is the set of summits or work stations; E is the set of edges, that is, pairs of vertices ( a , b ) ∈ V 2 such that a is the hierarchical leader of b ; which also means that documents can be exchanged by a and b for processing; finally, the node R ∈ V is the root of the tree.
This tree results from the hierarchical organization of the administration. Since the processing stations are interconnected by a computer network, this tree is, in fact, a sub-graph of the said computer network. Therefore, without losing the generality, we will consider in the rest of this article, that the network is reduced to this tree.
Simple documents are processed by a station according to their priority, and with equal priority, according to the order of arrival. These documents are therefore placed in a queue [12] according to their priority and their order of arrival; that is to say in a FIFO with priority.
Formally, if x ∈ V is a processing station, then we write Wx , the priority queue associated with x . Each station x processes the document d of highest priority, first come, which is at the front of the queue. The processing is done in a random time. A document can be put on hold for information provided by other stations outside the hierarchical line; which only impacts the waiting time; when this information is available, the document is put back in the queue according to its priority. Besides, the hierarchical leader may send back a document to his subordinate for correction or for further information. The number of these superior-subordinate roundtrips is not limited, and the priority of a document may change during this journey according to the instructions of the hierarchical leader.
In the present article, we disregard the type of processing performed on a document. After processing, the station can:
-
• close the document (e.g. classification),
-
• send the document outside,
-
• put the document back to its hierarchical leader if
he (she) exists,
-
• send the document to a collaborator with
processing instructions,
-
• send the document to a collaborator with
annotations or corrections,
-
• put the document on hold for information from
stations outside the hierarchy line,
-
• put the document back to his (her) hierarchical
boss for additional instructions.
In addition, each document is labeled with the total processing time (i.e., waiting time and service time).
A previous study [9] identified three problems resulting from the modeling of document processing by a static graph, namely:
-
• How to determine the variables for measuring system performance?
-
• The static graph does not account for the dynamic behavior of the system;
-
• The inputs in the system depend on the outputs.
MOUKELI and NEMBE [9] have proposed a model that addresses (answers) these concerns. In the specific case of simple documents managed in a priority queue, three new problems arise:
-
• How does the general model behave when applied to the specific case of simple documents, especially in terms of indicators and performance measures?
-
• A non-priority document can remain indefinitely in the queue if higher priority documents always arrive in said queue;
-
• A document can turn indefinitely in the hierarchical line due to incessant back and forth caused by the consequent changes. This problem arises acutely when the hierarchical line is reorganized (appointment of new people), or disorganized (case of restructuring).
-
B. Mathematical model
The mathematical model we propose aims to describe the static and dynamic behavior of our system made up of workstations dedicated to the processing of simple documents. This system consists of a static component modeled by a tree reflecting the hierarchical organization of the administration in charge of document processing. The nodes of this tree form the states of a Markov chain, and the edges represent the probabilities of transitions between these states. The properties of the static component are described through states and the matrix of transition probabilities. These probabilities depend on the nature of the simple documents and the processing capacity of the stations.
The dynamic component consists of a network of queues each formed by a priority queue associated with each node. The formal system is a quadruplet (V,E,R,F) ; where V is the set of vertices of the tree; E is the set of edges; R e V is the root of the tree; and F is the set of queues. The next two sections formally describe these two components (static and dynamic).
-
a. Static model of the system
The static component of our system is materialized by a network of workstations dedicated to simple document processing [8]. It is modeled by a tree reflecting the hierarchical organization of the administration in charge of document processing. The remainder of this subsection describes the generalities of this model and the document priority management; it also analyzes the constraints related to priority queues.
-
a) General description
Let T = ( V , E , R ) be a tree such that V is the set of vertices or workstations; E is the set of edges, that is to say pairs of vertices ( a , b ) e V 2 such that a is the hierarchical leader of b ; finally; R e V is the root node of the tree. The nodes are workstations and the edges represent the hierarchical relationship between these stations. Each edge ( a , b ) e E can be labeled by the cost of transition crossing from node a to node b or vice versa; which gives us a vector of valuations. On this tree, each node x is associated with a priority queue denoted W x . This queue contains all simple documents waiting for processing at station x , in order of priority; and with equal priority, in order of arrival. In this queue, based on the model of MOUKELI and NEMBE [9], the waiting time of a document corresponds to the processing time of the documents that will have preceded it in said queue. From this definition, MOUKELI and NEMBE deduced the processing time of a document d :
T p ( d ) = T w ( d ) + T s ( d ); (3)
Where T , TW and TS respectively denote the processing, waiting and service times of the document d ; understood that the service time is the time actually spent by the station to look at the document d .
-
b) Document priority Model
When a document is received, the station assigns it a priority. The notion of priority, although subjective, is the importance or urgency of a document, which will cause it to be processed before other documents already waiting in the queue associated with the station. Inserting a document into this queue means implicitly associating with it a priority. As an indication, Table 2 gives an example of prioritization of documents (column in red), for example, speeches are the highest priority documents, followed by memos and correspondences. We ignore the motivations of the station in its assessment of the priority of one document over another. The only certainty on which we base ourselves is that upon receipt of a document to be processed, either the station processes it immediately, which forces it to stop processing the current document and to put it on hold (return to head of the queue); or put it on hold in the middle of other documents (insertion in the queue) for further processing; which in reality means giving it a priority.
Concretely we suppose that the queue is logically organized according to a partial order noted n defined as follows:
n : D >i\ / V ( d , d ') g D\ d * d ’,
J n ( d ) = n ( d ’) ^ d and d ' can be processed in any order [ n ( d ) < n ( d ') ^ d absolutely must be processed before d '
In the above formula (4), D is the set of documents processed at a given station and is the set of natural numbers.
Implementing priority queues : heaps. Priority queues associated with document processing stations can be effectively implemented with heaps; data structures whose performances in terms of costs are known. Thus for the removal of the root, the insertion of an element and the creation of the heap, we have respectively costs of the order, for the first two, of O ( n ) and for the last, of O ( nLog ( n )) ; where n is the number of documents contained in the heap.
In addition, two priority queues can be merged; what is necessary in case one station transfers its records to another (retirement, vacation, permanent or temporary departure), because the documents are replaced according to their priority in the merged system. As well as we can divide a heap into two heaps of the same size up to one element, even if it is necessary to rebalance the sub-trees obtained. This last operation turns out to be necessary when a station is duplicated to be unloaded.
-
c) Constraints related to priority queues
The dynamic behavior of our document processing model shows that the outputs of the system (processed documents) can become entries in the system (documents to be processed). This dynamic behavior imposes constraints on our system, in particular those that follows:
phenomenon and to be able to detect it.
Solution to the problem of infinite waiting: incremental priority . Holding documents in a priority queue causes a non-zero probability that a non-priority document will remain in the queue indefinitely because higher priority documents are always inserted before it. One solution to this problem is to implement the incremental priority mechanism. For this purpose, when a document has exceeded a certain time in the queue at a given priority, its priority is increased (incremented) by one rank, in order to move it to the next higher priority.
As the lower priority documents, which are overdue, have their priority incremented, the queue tends gradually to a FIFO because all the documents will tend towards the highest priority. This situation actually reflects the case of a station saturated or over-solicited. In such a situation, we suggest either to unload this station for the benefit of other stations or to duplicate this station whenever possible. The system must be able to detect the occurrence of these FIFOs.
Infinite loop solution: dealing with the problem at the organic level . In practice, this infinite loop occurs only in the presence of a real organizational problem: either one of the stations does not have enough skills to properly process the document, or there is a misunderstanding between some actors in the hierarchical line. In other words, the problem is upstream from the mathematical model; it should, therefore, be treated upstream. In the case of proven incompetence, we recommend redirecting the document to a more competent collaborator; where applicable, it is the responsibility of one of the line managers to process the document. In the case of incomprehension, it is recommended to the highest hierarchical leader in the hierarchical processing line to solve the dispute or to process the document.
-
b. Dynamic model of the system
The dynamic model is used to describe the temporal behavior (evolution) of the system, which is modeled as N priority queues, and K document classes or document priority levels; given that Class 1 documents are the highest priority. Each queue, noted MK / MK /1 is modeled by a Markov process [25]. Any document that has spent in a class C i for more than T units of time (with T > 0) becomes a document of class C . Formally:
V d G C , T ( d ) > T ^ d G Ct_;1 < i < K . (5)
The remainder of this subsection formally describes the priority service discipline queue model, as well as service discipline and the M K / M K /1 queue.
-
a) Description of a priority service discipline queue
A network consisting of N priority service discipline queues is considered. The documents belong to K distinct classes (or types). Documents of class C i , (1 < i < K ) arrive in a queue j , (1 < j < N ) according to a
Poisson process with arrival rate A. . The service time of a document of class C i is a random variable that follows an exponential law of parameter ^ , (1 < i < K ). We will assume that the service times of the documents of the class C i are independent and identically distributed (i.i.d). In addition, the document arrival processes are independent of one another and independent of service times. Finally, each queue, assumed to have unlimited capacity, is associated with a single processing unit, that is to say, a single server, also called service station.
-
b) Description of the service discipline
The documents of class Ci are priority with regard to those of the class Ci+1, (1 < i < K) . In each class, processing takes place on a first-come, first-served (FIFO) basis, because documents of the same class have the same importance (equal priority). During the processing of a document d by a station, if a document d’ of higher class (higher priority) appears, it is processed immediately (preemption of service), and the document d is put back at the head of the line; the processing of document d, of lower class, will resume at the point where it ceased, as soon as all the documents of higher classes have been processed, and this, until completion or further interruption of service. Any document leaves the station (queue) only when the service request has been fully satisfied.
In this service discipline, documents with the lowest priority could wait quite a long time. To alleviate this problem, the service discipline is relaxed by introducing the possibility of raising the priority of a document that has waited too long in a class.
Formally:
V d e C i , T wi ( d ) > T ^ d e C i - 1 ; (6)
In formula (6), 1 < i < K , T is the maximum waiting time in a class, and T wi ( d ) the waiting time of the document d in the class C i . This is the incremental priority, stated previously.
The priority queue thus defined is a Markovian system, noted MK / MK /1; that is a multiclass Markovian queue with Poisson arrival processes and exponentially distributed service times; there are K classes of documents and a single server. We consider that our document processing system is a tree consisting of N MK / MK /1 queues; knowing that we have one queue per node of this tree. A graphical representation of this tree is given in Fig. 2.
-
c) Description of a MK/MK/1 queue
An MK / MK /1 queue is the standard M / M /1 queue with K document classes and priority service discipline. A classic monograph on priority queues is Jaiswal [10]. In our system, an MK / MK /1 queue will be modeled by a birth and death process taking values in N xNx... xN , where N is the set of natural integers.
Let us denote by X the state of a MK / MK /1 queue at time t . The state space is described by K-tuples ( n ,..., nK )eN ; where nt is the number of class i documents in the queue, 1 < i < K . We Note \Xt | the size of the queue at time t . We are interested in the stationary behavior of the process ( Xt , t > 0 ) .
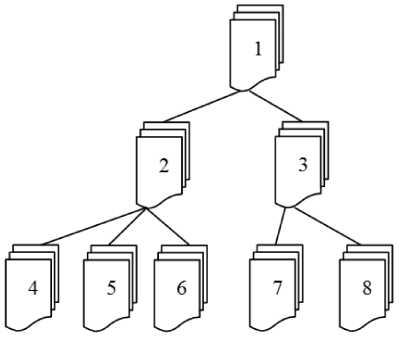
Fig.2. Example of tree with 8 queues
-
d) Description of the multiclass queuing network
Our document processing system is represented by a network of MK / MK /1 queues; it is a tree reflecting the hierarchical relationship between the service stations (nodes).
Each MK / MK /1 queue is represented by a node in the tree (example Fig. 2). We consider a tree with N nodes, noted ( V , E , R ), where V is the set of vertices or workstations; E is the set of edges, that is, pairs of vertices ( a , b ) e V 2, such that a is the hierarchical leader of b ; finally, R e V is the root node of the tree.
The system is described with the following parameters (see [25]):
-
• K : The number of document types in the network; it is the number of priority levels or the number of document classes;
-
• N : the number of queues (nodes) within the network;
-
• n.. : the number of documents of class j , in the
queue i , 1 < i < N and 1 < j < K ;
EN i=1 njj;
The state of the ith node (queue), 1 < i < N ;
s = ( V. S k ) ; (10)
The overall state of the network with multiple classes;
-
• ^ : the service rate of the ith node for documents
of the jth class, 1 < i < N , and 1 < j < K ;
-
• Pk : the probability that a job of the kth class at
the ith node is transferred to the lth class at the jth node (routing probability);
-
• Pk : the probability that a document from outside
the network enters the jth node as a document of the kth class;
-
• P : the probability that a document of the kth class leaves the network after having been serviced at the ith node;
-
• X : the overall arrival rate of documents from outside to the network;
-
• X : the arrival rate from outside to node j for class k documents;
-
• X : the arrival rate of documents of the kth class at the ith node.
The queuing network is modeled by a Markovian process X with values in (NK) = NKxN, where N is the set of natural integers. In fact, the Markov process thus considered has values in the set of matrices K x N.
-
VI. Performance Measures
This part is devoted to the presentation of the system performance indicators. Since a simple document processing system can be likened to a production system, it is likely to become saturated; As a result, we have incorporated features into our model that can capture system saturation. Finally, a simple document processing system includes the possibility that a document will circulate indefinitely in the system; we end this part by showing how our model takes into account such a possibility.
-
A. Performance indicators
The indicators described in this section are divided into two groups with respect to the static and dynamic components of our model.
-
a. Measures relating to the static component of the model
A summary of indicators calculable with our system is given below:
-
• Load of a station or number of documents of different j classes in the queue i :
L=Z K.1 nj/1 < i < N ,1 < j < K.(11)
-
• System load or number of documents in the system:
i=1 L.(12)
-
• Average processing time per station i and per class j of documents:
MeanPT . Stat .Cl ( i , j ) =
— У? T (d..,)/1 < i < N ,1 < j < K, k=1 Pv ijk,, n ij
-
• Average processing time of a document by the system:
MeanPT . Syst ( G ) =
1 N (14)
— ^. ^MeanPT . Station(i ) .
-
b. Measures relating to the dynamic component of the model
This section presents the performance measures for a MK / MK /1 queue. Let us denote by L i the average number of documents of class i in a queue, including the document in service. Let us denote by W i the average sojourn time (waiting time + service time) of a document of class i in that queue. That means that:
W i = Mean ( T p ( d ) ) ; (15)
In equation (15), d are the class i documents, and T ( d )is the processing time of document d (see (3) for detail). Let X finally denote the average arrival rate of class i documents in the queue.
Little's theorem for a multi-class queue is (See [26]):
L i = X W i , i e { 1,2,.., K } . (16)
Let L be the average number of documents of class i in the queue, excluding the document in service; and let W be the average waiting time of a class i document before processing by the server. For 1 < i < K , provided that the service time of a document of class C is a random variable that follows an exponential law of parameter m , we have the following relations:
L q =
J W = W + _
M i
A
Li= Liq + Vi where
I
Let us put:
V = V + V2 +...+ Vk .(18)
The MK I MK /1 queue is stable if: v < 1.
Consider the MK/MK/1 queue with a non- preemptive priority service discipline. Let us put:
^i= V1 + .. + Vi; ^0 = O
k
- M 2
" (1 - t r i . )(1 - r ) i , ,..',K'
Consider the MK / MK /1 queue with a preemptive resume priority service discipline. The mean sojourn time of a document of class i is given by the following relation:
M2
W =---- 1---- +---- j^-j ----, (21)
i ц г (1 - r i - 1 ) (1 - r i )(1 - r i - 1 )
i = 1,2,..., K .
From W other performance measures can be obtained.
-
B. Measuring system saturation
We have pointed out that the change of priority of documents that have spent a certain time in a class of a queue led to the progressive transformation of the aforementioned queue into a FIFO. We will study this situation more precisely.
When an incremental priority queue turns into a FIFO, all the documents it contains have the same highest priority, namely 1. In other words, an incremental priority queue can be transformed into a FIFO if the queue contains only documents entered directly in class 1, or if documents of the lower classes have regularly seen their priorities incremented to reach the class 1. In the first case, the station works normally, while in the second case, the station is saturated. To distinguish these two cases, we introduce a modification in the service discipline: any document whose priority has been incremented receives a mark. Formally:
I d e Ci
V d e C / T ( d ) > T ^ i - 1; (22)
iw M ( d )
where 1 < i < K ; T the maximum waiting time in a class; T w ( d ) the waiting time of the document d in a class C i and M is the marking function.
The mark is removed from a document when its processing is completed or when it changes station.
A station is semi-saturated or k -saturated if it is a FIFO that contains at least one or k marked documents. A station is saturated if it is a FIFO of which all documents are marked. Formally, if x is a station, and W ( x ), the queue of x :
Pr iorit e( d ) = 1
Satured ( x ) ^ V d e W ( x ), J and
M ( d )
A system is semi-saturated if it has at least one saturated station. A system is saturated if all its stations are saturated. Formally, let G = (V , E , F ) be an incremental priority queue system:
Satured ( G ) ^ V x e V , Satured ( x ); (24)
where W ( x ) e F is the queue associated with station x .
-
C. Detection of infinite loops in the system
Recall that there is a non-zero probability that a document circulates indefinitely in the system due to incessant back-and-forth in the hierarchical lines of processing. To detect these infinite loops, each document is marked with the name of each station it has crossed and the number of crossings. Each document d is therefore associated with a vector denoted d i7 such that d^ e N ^ ;
vv where N is the number of stations; knowing that for any document d :
dv [ i ] = n I
i e V n e N
where d [ i ] is the ith scalar of the vector d .
The expression d^ [ i ] = n means that the document d has crossed the station i n times; knowing that d^ [ i ] = 0 means that document d never crossed the station i
A system has an infinite loop if and only if there is a triplet ( d , i , n ) such that:
' d-v [ i ] = n
( d, i, n ) e D x V x N / j and
n ^ +^
Where D is the set of system documents and V is the set of vertices or workstations.
-
VII. Conclusion
In this contribution, based on the general model of MOUKELI and NEMBE [9], we proposed a specific model devoted to the processing of simple documents. The mathematical tools, as well as the performance indicators of this model, are well documented in the literature; see [10, 25, 26, 27]. The example we studied, concerning the observation of a workstation of a Ministry of Gabon, did not allow us to calculate the performance indicators since this study has been carried out many years after the data collection from said station. A possible continuation of this work would be to apply this model to practical cases, in particular, to observe the behavior of performance indicators [7,28]. Such work can then be extended to the development of simple document processing workflow simulators. Finally, as MOUKELI and NEMBE [9] suggest, another way of research would be to study the relationship between the service process [29] and the Markovian transition process that chooses the next node.
References A stochastic model for simple document processing
- United Nations: United Nations E-Government Survey 2016. UN Department of Economic and Social Affairs (2016).
- EUROPEAN COMMISSION: The EU E-Government Action Plan 2016-2020: Accelerating the digital transformation of government. COMMUNICATION FROM THE COMMISSION TO THE EUROPEAN PARLIAMENT, THE COUNCIL, THE EUROPEAN ECONOMIC AND SOCIAL COMMITTEE AND THE COMMITTEE OF THE REGIONS; Brussels, 19.4.2016, in line with COM (2016) 179 final; http://eurlex.europa.eu/legalcontent/EN/TXT/?uri=CELEX:52016DC0179.
- International Telecommunication Union: Electronic Government for Developing Countries. ICT Applications and Cybersecurity Division, Policies and Strategies Department; ITU Telecommunication Development Sector, 2008 www.itu.int/ITU-D/cyb/app/e-gov.html.
- MOUKELI MBINDZOUKOU P., MACKAYA M.: Overview of e-Government Development in Gabon. International Journal of Emerging Trends & Technology in Computer Science (IJETTCS), Volume 6, Issue 3, May- June 2017, pp 78-87, ISSN 2278-6856, Web Site: www.ijettcs.org.
- MOUKELI MBINDZOUKOU P., MACKAYA M.: Assessment of E-government Development in the Economic and Monetary Community of Central African States (EMCCAS). International Journal of Emerging Trends & Technology in Computer Science (IJETTCS), Volume 6, Issue 6, November- December 2017 ISSN 2278-6856, pp 25-34, Web Site: www.ijettcs.org Email: editor@ijettcs.org.
- ROSE Jeremy, PERSON John Stouby, TORDRUP HEEAGER Lise, IRANI Zahir: Managing e-Government: value positions and relationships. Information Systems Journal; (2015) 25, pp 531–571.
- Bauereiss T., Hutter D.: Possibilistic information flow control for workflow management systems. Proceedings GraMSec 2014, arXiv:1404.1634.
- Chang J., Blei D.M.: Hierarchical relational model for document Networks. The Annals of Applied Statistics, 2010, Vol. 4, No. 1, 124150, Euclid.aoas
- MOUKELI MBINDZOUKOU P., NEMBE J. : A Stochastic Model for Document Processing Systems. International Journal of Information Engineering and Electronic Business, 2016, 5, 52-59, Published Online September 2016 in MECS (http://www.mecs-press.org/) DOI: 10.5815/ijieeb.2016.05.07.
- N.K.Jaiswal.: Priority queues. Mathematics in science and engineering, Volume 50. Academic Press, 1968.
- Chen H., Yao D.: Fundamentals of queuing networks: performance, asymptotic and optimization. Springer, 2001. ISBN 0-387-95166-0.
- Gross D., Carl M. Harris: Fundamentals of queuing theory. Wiley, 1998. ISBN 0-471-32812-X.
- van der Aalst W.M.P., van Hee K.: Workflow management models, methods and systems. Book, w.m.p.v.d.aalst@tm.tue.nl, kvanhee@deloitte.nl, http://wwwis.win.tue.nl/ wvdaalst/publications/p120.pdf.
- Gottschalk F., van der Aalst W.M.P., Jansen-Vullers M.H., La Rosa M.: Configurable workflow models. International Journal of Cooperative Information Systems, March 10, 2008.
- Georgakopoulos D., Hornick M., Sheth A.: An overview of workflow management from process modeling to workflow automation infrastructure. Distributed and Parallel Databases, 3, 119-153, 1995.
- Pesic M., Schonenberg M.H., Sidorova N., van der Aalst W.M.P.: Constraint-based workflow models: change made easy. m.pesic, m.h.schonenberg, n.sidorova, w.m.p.v.d.aalst@tue.nl.
- Shi M., Yang G., Xiang Y., Wu S.: Workflow management systems: asurvey. Proceedings of IEEE Intl Conf on Communication Technology, Beijing:, Oct, 1998. shi, ygxin, xyong, wsg@csnet4.cs.tsinghua.edu.cn
- White S. A.: Process modeling notations and workflow patterns. IBM Corporation, BP Trends, March, 2004, www.bptrends.com.
- Zhang J., Kuc D., Lu S. Confucius: a tool supporting collaborative scientific workflow composition. IEEE, Transactions on Services Computing, VOL.PP, NO.99, 2012.
- Deelman E., Gannon D., Shields M., Taylor I.: Workflows and e-Science: an overview of workflow system features and capabilities, Future Generation Computer Systems (2008), doi:10.1016/j.future.2008.06.012
- Chun Ouyang, Michael Adams, Moe Thandar Wynn, and Arthur H.M. ter Hofstede : Workflow Management, Chapter from book Handbook on Business Process Management 1: Introduction, Methods, and Information Systems (pp.387-418), DOI 10.1007/978-3-642-00416-2_18, Springer-Verlag Berlin Heidelberg 2010
- Yong Zhao, Youfu Li, Ioan Raicu, Shiyong Lu, Xuan Zhang: Architecting Cloud Workflow: Theory and Practice, Proceedings - 2014 IEEE International Conference on Computer and Information Technology, CIT 2014, DOI: 10.1109/CIT.2014.81
- Dr. Sumagna Patnaik, Dr. Towheed Sulatna: Workflow in Treatment Process, International Journal of Trend in Scientific Research and Development (IJTSRD), ISSN No: 2456 - 6470 | Volume - 2 | Issue – 6 | Sep – Oct 2018, pp 582-584
- Lazowska, Edward D., John Zahorjan, G. Scott Graham, Kenneth C. Sevcik: Quantitative system performance:computersystem analysis using queuing network models. Prentice-Hall, Inc. 1984. ISBN 0-13-746975-6.
- Gunter Bolch, Stefan Greiner, Hermann de Meer, Kishor S. Trivedi: Queueing Networks and Markov Chains: Modeling and Performance Evaluation with Computer Science Applications. Second edition. Wiley-Interscience, 2006.
- Natarajan Gautam: Analysis of Queues ː Methods and Applications. CRC Press, Taylor & Francis Group, 2012.
- Hideaki Takagi. : Queueing Analysis: A Foundation of Performance Evaluation, vol 1 : Vacation and Priority Systems, Part 1 . North Holland, 1991.
- Abbott K.R., Sarin S.K.: Experiences with workflow management: issues for the next generation. kabbott:osbunorth@xerox:com, proceeding of CSCW 94 Proceedings of the 1994 ACM conference on Computer supported cooperative work, Pages 113-120, http://www:gerrystahl:net/teaching/winter12/Abbottworkflow:pdf.
- Singer R., Kotremba J., Ra S., Joanneum F.: Modeling and execution of multi-enterprise business processes. University of Applied Sciences, 2 Str ICT Solutions GmbH.
