A study on diagnosis of Parkinson’s disease from voice dysphonias

Author: Kemal Akyol
Journal: International Journal of Information Technology and Computer Science @ijitcs
Article in issue: 6 Vol. 10, 2018.
Free access
Parkinson disease that occurs at older ages is a neurological disorder that is one of the most painful, dangerous and non-curable diseases. One symptom that a person may have Parkinson’s disease is trouble that can occur in the voice of a person which is so-called dysphonia. In this study, an application based on assessing the importance of features was carried out by using multiple types of sound recordings dataset for diagnosis of Parkinson disease from voice disorders. The sub-datasets, which were obtained from these records and were divided into 70-30% training and testing data respectively, include the important features. According to the experimental results, the Random Forest and Logistic Regression algorithms were found successful in general. Besides, one or two of these algorithms were found to be more successful for each sound. For example, the Logistic Regression algorithm is more successful for the ‘a’ voice. The Artificial Neural Networks algorithm is more successful for the ‘o’ voice.
Importance of feature, parkinson disease, recursive feature elimination, voice dysphonias
Short address: https://sciup.org/15016270
IDR: 15016270 | DOI: 10.5815/ijitcs.2018.06.04
Text of the scientific article A study on diagnosis of Parkinson’s disease from voice dysphonias
Published Online June 2018 in MECS
Parkinson's disease (PD), which is a neurological illness that impairs motor skills, speech, and other functions such as mood, behavior, thinking, and sensation, leads to vocal impairment in approximately 90% of the patients. The symptoms of PD grow up gradually and mostly target at the elderly people for whom physical visits to the clinic are inconvenient and costly. Telemonitoring of the disease by using measurements of dysphonia has an important role in its early diagnosis [1]. One symptom that a person may have Parkinson's disease is trouble which can occur in the voice of a person which is so-called dysphonia. Dysphonia has a vital place in the advancement of the disease besides being the first signs of this disease. The rotundity, unclearness, roughness, decline and trembling in voice are typical symptoms of dysphonia. In this context Isenkul et al. obtained a total of 41 voice recordings, 21 of whom are Parkinson's patients during the examination. These voice samples are as follows: voices, the numbers between 1 and 10, four rhyming clauses, nine words and extending the letters 'a', 'o', 'u'. Time-frequency-based features are extracted from
-
26 different sound samples from each patient [2].
In the proposed study, the important features, which were obtained with the significance analysis by means of Recursive Feature Elimination method for each voice, were determined. Afterwards, the performances of classification algorithms for these voices were analyzed. The rest of this paper was organized as follows; In Section 2, related studies were examined. In Section 3, the methods used were focused. In Section 4, the dataset was introduced. In Section 5, experimental results were given in a detailed way. Finally, the conclusion was given in Section 6.
-
II. Related Works
There is good deal of investigations on the voice dysphonias concerning the diagnosis of PD. Sakar and Kursun firstly selected a minimal subset of features with maximal joint relevance to the PD-score, remark whether or not the sample belongs to a person with PD through a binary score, and build a predictive model with minimal bias. Support Vector Machine was used to build classification model and test it with a more suitable crossvalidation scheme. They applied the mutual information measure with the permutation test to assess the relevance and the statistical significance of the relations between the features and the PD-score [1]. Little et al. discriminated healthy people from people with PD by detecting dysphonia. In their studies, they collected sustained phonations from 31 people, 23 with PD. After this phase, when they elected ten highly uncorrelated measures, and an exhaustive search of all possible combinations of these measures, they achieved 91.4% overall correct classification performance [3]. Sakar et al. collected a wide variety of voice samples, including sustained vowels, words, and sentences compiled from a set of speaking exercises for people with Parkinson's disease. They investigated the sustained vowels which are more PD-discriminative information by using well-known machine learning tools on their Parkinson dataset [4]. Mahnaz and Ashkan introduced a new approach that uses an independent classifier for each vocal test, which includes sustained vowels, words, numbers, and short sentences compiled from a set of speaking exercises for healthy, and people with Parkinson's disease. Their methodology enhances classification accuracy up to 15% with filter-based feature selection [5]. Tsanas et al. demonstrated rapid, remote replication of unified Parkinson's disease rating scale (UPDRS) assessment with clinically useful accuracy by using only simple, selfadministered, and noninvasive speech tests. They identified the speech by means of signal processing algorithms, extracting clinically useful features of average PD progression. Subsequently, they elected the most parsimonious model by way of a robust feature selection algorithm, and statistically mapped the selected subset of features for UPDRS by using linear and nonlinear regression techniques [6]. Lahmiri investigated the effect of different dysphonia measurements on PD detection by employing Support Vector Machine. Seven categories of dysphonia measurements were assessed in order to detect the PD in patients. Experimental results demonstrate that vocal fundamental frequency statistics yield the highest accuracy of 88%±0.04. When all dysphonia measurements were employed, the Support Vector Machine classifier achieved 94%±0.03 accuracy. Finally, the measures of the ratio of the noise to tonal components in the voice were the most suitable dysphonic symptoms to detect PD subjects as they achieved 99.64%±0.01 specificity. This finding is highly promising for understanding PD symptoms [7]. Sewall et al. conducted an investigation in order to determine if vocal fold injection of Cymetra, which micronized form of collagen, elastin, proteoglycans, is associated with changes in dysphonic voice characteristics in subjects with idiopathic Parkinson’s disease (IPD), and presented the acoustic and aerodynamic measurements of voice are the most reflective of any observed perceptual changes in voice. Transoral collagen injection in patients with Parkinson’s-related dysphonia is safe, well tolerated, and an effective temporary method of subjectively improving voice and speech in selected patients with IPD [8].
-
III. Methods
-
A. Feature selection
Feature selection which improves the efficiency of classification algorithms is an important process. The minimum subset of features from the original data is obtained by removing the redundant and irrelevant features [9]. There are many studies on this subject in the literature. For example, Liu and Aickelin proposed a novel concept of feature matrix so as to detect the adverse drug reaction. They used feature selection methods based on Student’s t-test and Wilcoxon rank-sum test on the feature matrix to detect the significant features for adverse drug reaction [10]. Enshaei and Faith used the ‘Targeted Projection Pursuit (TPP)’ dimension reduction technique for feature selection on a range of gene expression datasets. They compared the performance of TPP with other feature selection techniques [11].
The relevant features for any outcome variable were identified by using feature selection methods. The Recursive Feature Elimination (RFE) method eliminates some of the original input features and retains subset of important features that yield the best classification performance. This method consists of an iterative procedure as follows [12]:
-
• Training of the classifier.
-
• Computing the ranking criterion for all features.
-
• Removing the feature with the smallest ranking criterion.
-
B. Learning Algorithms
Machine Learning uses computers to simulate human learning and allows computers to identify and acquire knowledge from the real world. Today, there are a large number of machine learning algorithms proposed in the literature [13]. The performances of many learning algorithms have been discussed by researchers so far. For example, Priyanka Shetty and Joshi investigated new and useful patterns in order to provide meaningful and useful information for diabetes diseases. The authors designed and implemented a diabetes prediction and monitoring system and implemented by using Iterative Dichotomiser 3 classification algorithm in their studies [14]. Kaur and Kaur proposed a new feature vector that consists of the information of an image patch as well as blur kernel. They extracted kernel-specific feature vector. Then, the features were sent to as input data the Naive Bayes classifier [15]. The learning algorithms used in this study are as follows:
Random Forest (RF):
The tree structure is constituted by making use of the RF algorithm which is introduced by Breiman [16]. This structure is generated by determining the number of trees and the samples will be used in each node. The classification of new dataset is performed by selecting the trees, which have the most votes in these trees [17].
Logistic Regression (LR):
LR is a regression method that helps to classify and assign the binary outcome variable. For example, a relationship between the age and the presence or absence of any disease is analyzed by utilizing this method [18]. It is the most popular model in statistical modeling of binary response Y and quantitative explanatory variables [19].
Artificial Neural Networks (ANN):
A neural network is a combination of interconnected simple processing elements, units or nodes. The ability of the network depends on a number of weights that are obtained through learning a set of training examples [20]. A neural network derives the computing power from the structure with parallel distributes, and learning and therefore, generalizing ability in a large manner. Generalization is used to produce reasonable outputs for inputs that are not encountered during neural network training [21].
Support Vector Machine (SVM):
This algorithm transform training data into a higher dimension, where it finds a hyperplane that separates the data. The SVM finds this hyperplane by utilizing support vectors which are essential training tuples and margins defined by the support vectors [22].
Naive Bayes (NB):
NB uses the probability theory in order to find the most possible classifications [23]. NB classifier assumes that the effect of an attribute value on outcome variable is irrelevant of the values of the other attributes [22].
-
C. Performance Evaluation
The performances of the learning algorithms are analyzed by utilizing Accuracy (Acc) and Sensitivity (Sen) metrics. The effectiveness of the proposed study was demonstrated by using the metrics given below:
Acc = ( TP + TN ) / ( TP + FP + TN + FN ) (1)
Sen = TP/(TP + FN) (2)
The Acc metric given in Equation 1 can be expressed as the ratio of the number of accurately diagnosed instances to the number of total instances and it is the most used measurement of model success. The Sen metric which is given in Equation 2, can be expressed as the ratio of the number of the patients who were classified as correctly to total patients having PD [24]. These metrics can be calculated based on four values:
-
a) True Positive (TP), the number of the patients who were classified as correctly out of the patients having PD,
-
b) False Negative (FN), the number of the patients who were classified as incorrectly out of the patients having PD,
-
c) True Negative (TN), the number of the patients who were classified as correctly out of the patients not having PD,
-
d) False Positive (FP), the number of the patients who were classified as incorrectly out of the patients not having PD.
-
IV. Data
The publicly available UCI dataset named “Parkinson Speech Dataset with Multiple Types of Sound
Recordings” has a variety of vocal tests, which include sustained vowels, words, numbers, and short sentences compiled from a set of speaking exercises for healthy people and ones with Parkinson's disease. The dataset consists of 20 PWP (6 females, 14 males) and 20 healthy individuals (10 females, 10 males) who applied to the Department of Neurology in Cerrahpasa Faculty of Medicine, Istanbul University. The voice information in the dataset was given in Table 1 [4]. 28 PD patients were asked to say only the sustained vowels “a” and “o” three times respectively, which makes a total of 168 recordings in step of the collection of test dataset.
Table 1. The voice information in the raw data file [4].
|
Voice No |
Explanation |
|
1 |
“a” sustained vowel |
|
2 |
“o” sustained vowel |
|
3 |
“u” sustained vowel |
|
4-13 |
numbers from 1 to 10 |
|
14-17 |
short sentences |
|
18-26 |
words |
A detailed information of 26 features which were extracted from each voice samples was given in Table 2. This dataset was used as an independent test set to validate the results obtained on training set.
Table 2. The feature information in the raw data file [4].
|
Feature No |
Feature Name |
|
features 1-5 |
Jitter (local),Jitter (local, absolute),Jitter (rap),Jitter (ppq5),Jitter (ddp) |
|
features 6-11 |
Shimmer (local),Shimmer (local, dB),Shimmer (apq3),Shimmer (apq5), Shimmer (apq11),Shimmer (dda) |
|
features 12-14 |
AC, NTH, HTN |
|
features 15-19 |
Median pitch, Mean pitch, Standard deviation, Minimum pitch, Maximum pitch |
|
features 20-23 |
Number of pulses, Number of periods, Mean period, Standard deviation of period |
|
features 24-26 |
Fraction of locally unvoiced frames, Number of voice breaks, Degree of voice breaks |
-
V. Experimental Results
Fig. 1 describes the flowchart of the proposed approach for the Diagnosis of Parkinson's Disease from Sound Dysphonias. This flowchart consists of two steps.
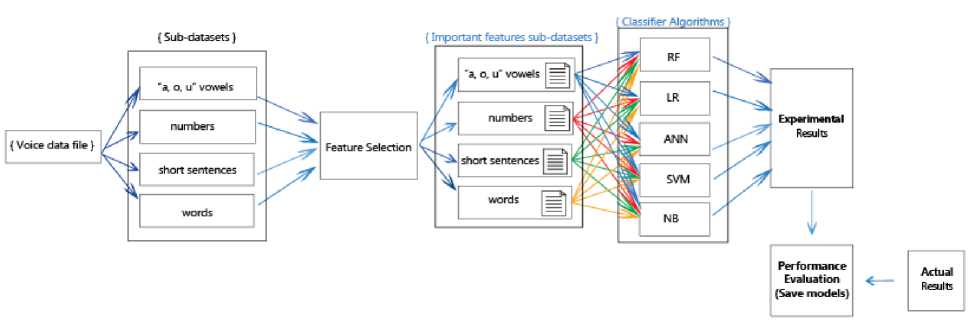
Fig.1. A general flowchart of the proposed approach.
-
(1) Obtaining the voice sub-datasets: Firstly, the subdatasets were obtained from raw file which includes all the vocal tests. Thus, there were 26 sub-datasets each containing 40 samples. After this phase, the importance of features for outcome variable was investigated on each
sub-dataset by applying the RFE method. This information was presented in Fig. 2. The point order on each chart is in line with the feature order in Table 2. For example, the attributes 1, 4, 5, 6 and 11 are important for voice no. 1.
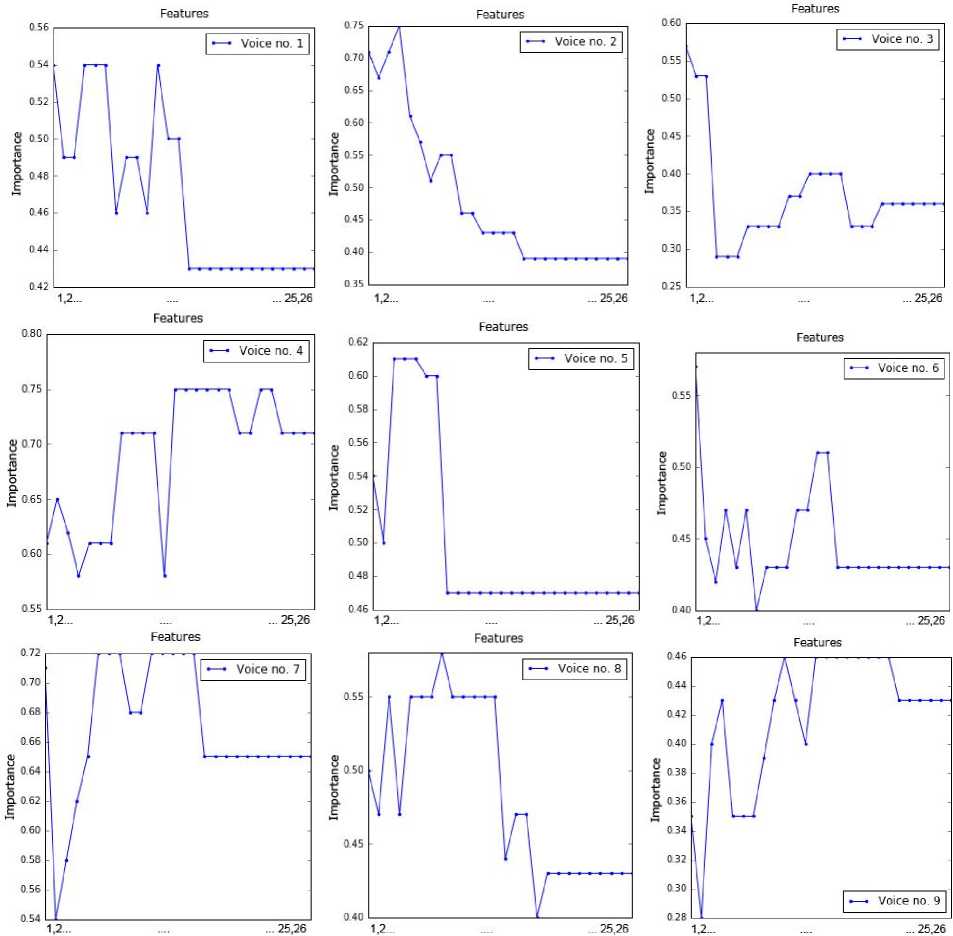
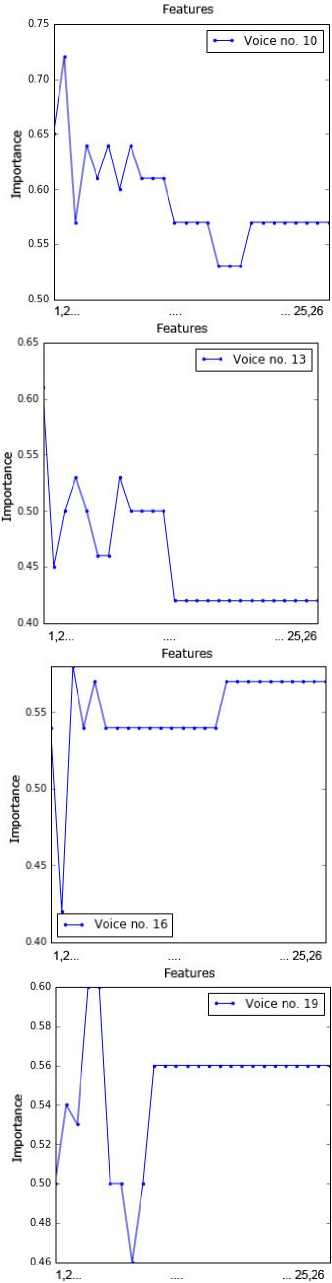
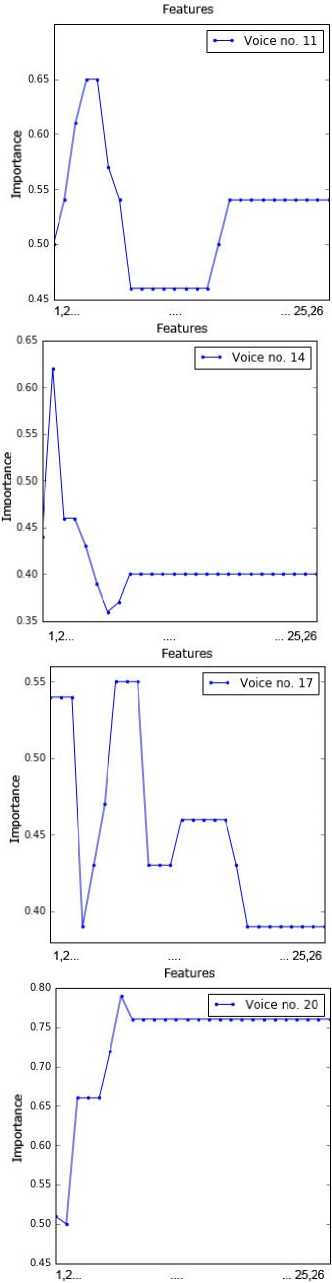
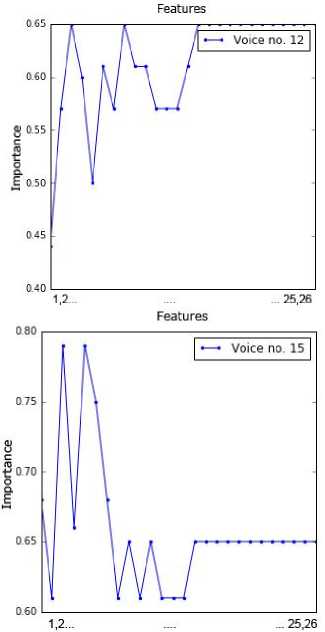
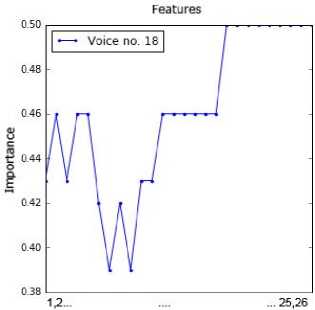
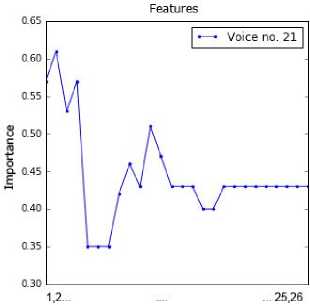
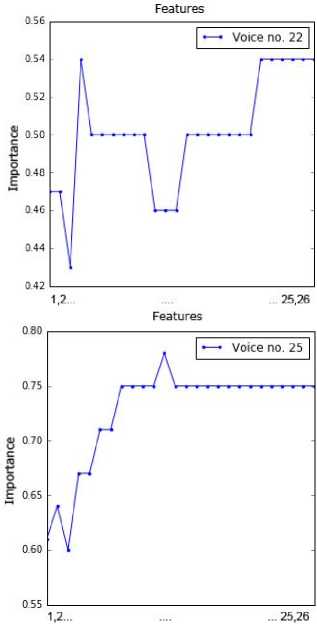
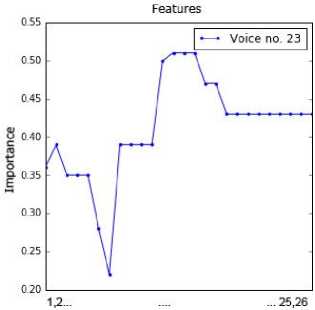
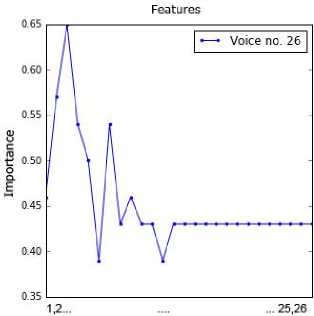
Fig.2. Importance of values of the attributes for all voice samples.

Table 3. The performance results of the algorithms.
|
Learning Algorithms |
||||||||||
|
RF (%) |
LR (%) |
SVM (%) |
ANN (%) |
NB (%) |
||||||
|
Sen |
Acc |
Sen |
Acc |
Sen |
Acc |
Sen |
Acc |
Sen |
Acc |
|
|
‘a’ |
60.0 |
66.67 |
80.0 |
66.67 |
100.0 |
58.33 |
100.0 |
41.67 |
40.0 |
25.0 |
|
‘o’ |
40.0 |
50.0 |
40.0 |
58.33 |
40.0 |
50.0 |
100.0 |
58.33 |
80.0 |
41.67 |
|
‘u’ |
80.0 |
41.67 |
80.0 |
41.67 |
80.0 |
41.67 |
80.0 |
41.67 |
80.0 |
41.67 |
|
1 |
80.0 |
75.0 |
60.0 |
58.33 |
100.0 |
41.67 |
100.0 |
41.67 |
80.0 |
50.0 |
|
2 |
100.0 |
75.0 |
100.0 |
50.0 |
100.0 |
58.33 |
0.0 |
33.33 |
40.0 |
66.67 |
|
3 |
60.0 |
75.0 |
60.0 |
75.0 |
60.0 |
75.0 |
60.0 |
75.0 |
60.0 |
75.0 |
|
4 |
60.0 |
66.67 |
80.0 |
66.67 |
80.0 |
33.33 |
100.0 |
41.67 |
60.0 |
58.33 |
|
5 |
20.0 |
33.33 |
80.0 |
50.0 |
100.0 |
41.67 |
100.0 |
41.67 |
60.0 |
41.67 |
|
6 |
80.0 |
66.67 |
80.0 |
50.0 |
100.0 |
41.67 |
100.0 |
41.67 |
80.0 |
41.67 |
|
7 |
20.0 |
33.33 |
60.0 |
58.33 |
80.0 |
41.67 |
100.0 |
41.67 |
40.0 |
50.0 |
|
8 |
100.0 |
66.67 |
40.0 |
41.67 |
100.0 |
41.67 |
100.0 |
41.67 |
100.0 |
50.0 |
|
9 |
40.0 |
58.33 |
60.0 |
58.33 |
100.0 |
41.67 |
40.0 |
41.67 |
80.0 |
33.33 |
|
10 |
60.0 |
50.0 |
60.0 |
50.0 |
60.0 |
50.0 |
100.0 |
41.67 |
40.0 |
50.0 |
|
short sent_1 |
40.0 |
16.67 |
40.0 |
50.0 |
60.0 |
25.0 |
100.0 |
41.67 |
80.0 |
33.33 |
|
short sent_2 |
80.0 |
58.33 |
100.0 |
66.67 |
100.0 |
75.0 |
100.0 |
41.67 |
100.0 |
66.67 |
|
short sent_3 |
100.0 |
66.67 |
60.0 |
41.67 |
100.0 |
58.33 |
100.0 |
41.67 |
80.0 |
58.33 |
|
short sent_4 |
80.0 |
75.0 |
80.0 |
58.33 |
80.0 |
41.67 |
100.0 |
41.67 |
100.0 |
91.67 |
|
word_1 |
80.0 |
66.67 |
40.0 |
33.33 |
100.0 |
41.67 |
0.0 |
41.67 |
20.0 |
50.0 |
|
word_2 |
60.0 |
66.67 |
80.0 |
50.0 |
100.0 |
41.67 |
100.0 |
41.67 |
60.0 |
58.33 |
|
word_3 |
60.0 |
58.33 |
80.0 |
66.67 |
100.0 |
41.67 |
80.0 |
66.67 |
80.0 |
41.67 |
|
word_4 |
100.0 |
75.0 |
100.0 |
50.0 |
100.0 |
50.0 |
80.0 |
33.33 |
60.0 |
41.67 |
|
word_5 |
40.0 |
50.0 |
40.0 |
33.33 |
40.0 |
41.67 |
100.0 |
41.67 |
20.0 |
33.33 |
|
word_6 |
60.0 |
41.67 |
60.0 |
50.0 |
100.0 |
41.67 |
100.0 |
41.67 |
80.0 |
50.0 |
|
word_7 |
20.0 |
33.33 |
20.0 |
50.0 |
100.0 |
41.67 |
100.0 |
58.33 |
40.0 |
50.0 |
|
word_8 |
100.0 |
50.0 |
80.0 |
58.33 |
100.0 |
41.67 |
100.0 |
50.0 |
100.0 |
50.0 |
|
word_9 |
60.0 |
58.33 |
60.0 |
58.33 |
40.0 |
41.67 |
100.0 |
41.67 |
60.0 |
50.0 |
|
Note: short_sent: short sentence |
||||||||||
-
VI. Conclusion
Parkinson disease is a neurological disorder which is one of the most painful, dangerous and non-curable diseases. In this study, an application based on assessing the importance of features was carried out by using multiple types of sound recordings dataset for the diagnosis of PD from voice disorders. Dysphonia has an important role in the development of symptoms of the disease, as well as being the first signs of this disease. The rotundity, unclearness, roughness, decline and trembling are typical symptoms of dysphonia. In this context, the important attributes for each voice were investigated through RFE method. In the next stage, performance analysis of classification algorithms for these voices was carried out. As can be seen from the experimental results, the small number of samples negatively affected the machine learning. The results of the classification are quite different from each other for each vowel. While an algorithm is the best success for a voice, another algorithm is the best success for the other voice. For this reason, the multi-model system was designed by using the best-performing model information for each voice. Thus, the analysis will be performed with the model that provides the best success for the related voice. In this context, it is thought that this work will be useful for the field specialists.
Acknowledgments
The author is thankful to publicly available Parkinson Speech Dataset with Multiple Types of Sound Recordings Dataset.
References A study on diagnosis of Parkinson’s disease from voice dysphonias
- C.O. Sakar, O. Kursun, “Telediagnosis of Parkinson's disease using measurements of dysphonia,” J Med Syst, Vol. 34, pp. 591-599, 2010.
- M.E. Isenkul, B. Erdoğdu, C.O. Şakar, E. Gümüş, M.Ş. Delil, F. Gürgen, A. Sertbaş, O. Kursun, “Building a speech database and using speech patterns for diagnosis of Parkinson’s disease from voice dysphonias,” In: Tıptekno’11 Tıp Teknolojileri Ulusal Kongresi, Antalya, Turkey.
- M.A. Little, P.E. McSharry, E.J. Hunter, J. Spielman, L.O. Ramig, “Suitability of dysphonia measurements for telemonitoring of Parkinson’s disease,” In: IEEE T Bio-Med Eng, Vol. 56, pp. 1015-1022, 2009.
- B.E. Sakar, M.E. Isenkul, C.O. Sakar, A. Sertbas, F. Gurgen, S. Delil, H. Apaydin, O. Kursun, “Collection and analysis of a Parkinson speech dataset with multiple types of sound recordings,” In: IEEE Journal of Biomedical and Health Informatics, Vol. 17, pp. 828-834, 2013.
- B. Mahnaz, S. Ashkan, “A multiple-classifier framework for Parkinson's disease detection based on various vocal tests,” International Journal of Telemedicine and Applications, Vol. 6837498, pp.1-9, 2016.
- A. Tsanas, M.A. Little, P.E. McSharry, L.O. Ramig, “Accurate telemonitoring of Parkinson's disease progression by noninvasive speech tests,” In: IEEE T Bio-Med Eng, Vol. 57, pp. 884-893, 2010.
- S. Lahmiri, “Parkinson’s disease detection based on dysphonia measurements,” Physica A, Vol. 471, pp. 98-105, 2017.
- G.K. Sewall, J. Jiang, C.N. Ford, “Clinical evaluation of Parkinson’s-related dysphonia,” Laryngoscope, Vol. 116, pp. 1740-1744, 2006.
- Ahmed F. Alia, Adel Taweel,"Feature Selection based on Hybrid Binary Cuckoo Search and Rough Set Theory in Classification for Nominal Datasets", International Journal of Information Technology and Computer Science(IJITCS), Vol.9, No.4, pp.63-72, 2017. DOI: 10.5815/ijitcs.2017.04.08
- Yihui Liu, Uwe Aickelin,"Feature Selection in Detection of Adverse Drug Reactions from the Health Improvement Network (THIN) Database", IJITCS, vol.7, no.3, pp.68-85, 2015. DOI: 10.5815/ijitcs.2015.03.10
- A. Enshaei and J. Faith, “Feature Selection with Targeted Projection Pursuit,” I.J. Information Technology and Computer Science, vol. 7, no. 5, pp. 34-39, 2015. DOI: 10.5815/ijitcs.2015.05.05
- I. Guyon, J. Weston, S. Barnhill, V. Vapnik, “Gene selection for cancer classification using support vector machines,” Mach Learn, Vol. 46, pp. 389-422, 2002.
- I. Portugal, P. Alencar, D. Cowan, “The use of machine learning algorithms in recommender systems: A systematic review,” Expert Systems with Applications, 2018, Vol. 97, pp. 205-227.
- S. R. Priyanka Shetty, Sujata Joshi,"A Tool for Diabetes Prediction and Monitoring Using Data Mining Technique", International Journal of Information Technology and Computer Science(IJITCS), Vol.8, No.11, pp.26-32, 2016. DOI: 10.5815/ijitcs.2016.11.04
- Harjot Kaur, Mandeep Kaur,"A Hybrid Approach for Blur Detection Using Naïve Bayes Nearest Neighbor Classifier", International Journal of Information Technology and Computer Science(IJITCS), Vol.8, No.12, pp.75-82, 2016. DOI: 10.5815/ijitcs.2016.12.09
- L. Breiman, “Random forests,” Mach Learn, Vol. 45, pp. 5-32, 2001.
- O. Akar, O. Gungor, “Classification of multispectral images using Random Forest algorithm,” Journal of Geodesy and Geoinformation, Vol. 1, pp. 139-146, 2012.
- S. Lemeshow, D. Hosmer, Applied Logistic Regression, 2nd ed. New York, USA: Wiley, 2000.
- A. Agresti, An Introduction to Categorical Data Analysis, 2nd ed. New Jersey, USA: Wiley, 2007.
- K. Gurney, An Introduction to Neural Networks. London and New York, USA: UCL Press, 1997.
- S. Haykin, Neural Networks and Learning Machines. 3rd ed., New York, USA: Prentice Hall, 2009.
- J. Han, M. Kamber, J. Pei, Data Mining Concepts and Techniques, 3rd ed, Waltham, USA: Elsevier, 2012.
- M. Bramer, Principles of Data Mining, Undergraduate Topics in Computer Science. 2nd ed. London: Springer, 2013.
- S.A. Shaikh, Measures derived from a 2x2 table for an accuracy of a diagnostic test. J Biom Biostat, vol. 2, no. 128, pp. 1-4, 2011.
