A study on liver disease diagnosis based on assessing the importance of attributes

Author: Kemal Akyol, Yasemin Gültepe
Journal: International Journal of Intelligent Systems and Applications @ijisa
Article in issue: 11 vol.9, 2017.
Free access
Liver is a needful body organ that forms an important barrier between the gastrointestinal blood, which contains large amounts of toxins, and antigens. Liver diseases contain hepatitis B and hepatitis C virus infections, alcoholic liver disease, nonalcoholic fatty liver disease and associated cirrhosis, liver failure and hepatocellular carcinoma are primary causes of death. The main purpose of this study is to investigate which attributes are important for effective diagnosis of liver disorders by performing the machine learning approach based on the combination of Stability Selection and Random Forest methods. In order to generate more accuracy, dataset was balanced by utilizing the Random Under-Sampling method. Important ones in all attributes were detected by utilizing the Stability Selection method which was performed on sub-datasets, which were obtained with 5 fold cross-validation technique. By sending these datasets to the Random Forest algorithm, the performance of the proposed approach was evaluated within the frame of accuracy and sensitive metrics. The experimental results clearly show that the Random Under-Sampling method can potentially improve the performance of the combination of Stability Selection and Random Forest methods in machine learning. And, the combination of these methods provides new perspectives for the diagnosis of this disease and other medical diseases.
Classification, liver disease, under-sampling, stability selection, random forest
Short address: https://sciup.org/15016430
IDR: 15016430 | DOI: 10.5815/ijisa.2017.11.01
Text of the scientific article A study on liver disease diagnosis based on assessing the importance of attributes
Published Online November 2017 in MECS
The liver is an essential body organ that forms an important barrier between the gastrointestinal blood, which contains large amounts of toxins and antigens in the body [1]. Liver, also known as hepatic, liver comprises a wide range of complex functions that affect it [2]. These functions are as follows [3]:
-
• Fighting infections and illness
-
• Removing toxins (poisons), such as alcohol, from
the body
-
• Controlling cholesterol levels
-
• Helping blood clot (thicken)
-
• Releasing bile, a liquid that breaks down fats and aids digestion
Liver diseases contain hepatitis B virus and hepatitis C virus infections, alcoholic liver disease, nonalcoholic fatty liver disease and associated cirrhosis, liver failure and hepatocellular carcinoma are primary causes of death [4]. Hepatitis is a viral infection caused by inflammation of the liver tissue. More than four million people have been exposed to Hepatitis C and most of them do not know this. Every year, 8-10.000 people die from complications of chronic liver disease related to Hepatitis C [5]. Alcoholic liver disease impairs the liver and its function because of alcohol abuse [6]. And it is the most prevalent cause of advanced liver disease in Europe [7]. Cirrhosis is late-stage liver disease which emerges when scar tissue substitute healthy tissue [8]. Alcoholic liver disease is the most common reason of cirrhosis in the Western world and one of the most common reasons for death [9]. According to [10], the number of liver patients is increasing day by day due to excessive consumption of alcohol, inhale of harmful gases, intake of contaminated food and drugs.
In this study, the importance of attributes for this disease was investigated and the machine learning was realized in this context. In order to achieve more accuracy for liver disease, the Random Under-Sampling (RUS) method was performed for major classes. After this step, the combination of Stability Selection (SS) and Random Forest (RF) methods were carry out on sub-datasets, which were obtained from the BUPA (The BUPA Liver Disorders) and ILPD (Indian Liver Patient Dataset) with 5 fold cross-validation technique. The rest of this paper was organized as follows. In Section 2, related studies were examined. In Section 3, information about the datasets which were used in this study were given. In Section 4, the proposed approach and experimental results were given in detail. Finally, conclusion and future work were presented in section 5.
-
II. Related Works
There are many studies and methods on this disease. As can be seen in the studies [1, 10-17], most of them constitute data mining and classification algorithms. The algorithms used in these studies were given in Table 1.
Table 1. Some of the Studies in Literature
|
Study |
Classifier Algorithms |
|
Hashem and Mabrouk [1] |
Support Vector Machine Algorithm |
|
Pahareeya et al. [10] |
J-48, Multilayer Perceptron, Random Forest, Multiple Linear Regression, Support Vector Machine, Genetic Programming |
|
Pakhale and Xaxa [11] |
C4.5, Random Forest, Multilayer Perceptron, Classification and Regression Technique, BayesNet and Ensemble Models of These |
|
Dhamodharan [12] |
Bayesian Classification, Frequent-Pattern Tree |
|
Reetu and Kumar [13] |
J48 Decision Tree |
|
Aneeshkumar and Venkateswaran [14] |
Naive Bayesian, C4.5 Decision Tree |
|
Jin et al. [15] |
Decision Tree, k-Nearest Neighbor, Multi-Layer Perceptron, Naïve Bayes, Random Forest and Logistic Regression |
Rajeswari and Reena [16] Naïve Bayes, KStar, FT Tree
|
Liang and Peng [17] |
The combination of Artificial Immune and Genetic Algorithms |
The studies in [18-19], which include the clustering algorithms, were done for this disease. In the first of them P. Saxena et al. [18] worked with COBWEB [20], DBSCAN [21], Hierarchical and K-means clustering [22] algorithms. Experimental results show that k-means clustering algorithm is the simplest and fastest algorithm as compared to others. In the second study [19], Kant and Ansari presented that K-means clustering algorithm with Atkinson index gives better result as compared to K- means clustering algorithm. Besides, in order to overcome the problem of unbalanced data, author proposed a method based on over-sampling and undersampling methods in [23]. In the study, the author focused on the better decision trees for the diagnosis of BUPA liver disorder. As in the case of the study [24], special cases that may be useful in the treatment of this disease are also investigated. In this study, the author investigated the beneficial effects of Korean Red Ginseng for chronic liver disease, a condition encompassing nonalcoholic fatty liver disease, alcoholic liver disease, chronic viral hepatitis, and hepatocellular carcinoma. In another study [4], the authors investigated the characteristics and epidemiology of liver diseases, which mainly includes hepatitis B virus and hepatitis C virus infections, alcoholic liver disease, nonalcoholic fatty liver disease and end-stage liver diseases, and liver-related research in China in their studies. In [25], the authors aimed to describe the successful components of a dynamic and responsive transition service for the young adults who have struggled with liver disease since childhood. In [26], the authors investigated the relation between the gender and this disease for the most representative hepatic diseases. In [27], the author investigated effects of excessive alcohol usage on alcoholic liver disease, and liver transplantation.
-
III. Datasets
BUPA and ILPD datasets which were taken from web site of the University of California at Irvine Machine Learning Repository were used in this study. These datasets consist of 345 and 583 instances which include 6 and 10 attributes respectively and an outcome value. And, these datasets were used commonly in liver disorder studies. Detail information about attributes in both datasets was presented in Table 2.
Table 2. The Datasets and Available Attributes
|
BUPA |
ILPD |
||
|
Attribute |
Description |
Attribute |
Description |
|
MCV |
Mean Corpuscular Volume |
AGE |
Age of the Patient |
|
ALKPHOS |
Alkaline Phosphotase |
GENDER |
Gender of the Patient |
|
SGPT |
Alamine Aminotransferase |
TB |
Total Bilirubin |
|
SGOT |
Aspartate Aminotransferase |
DB |
Direct Bilirubin |
|
GAMMAGT |
Gamma-Glutamyl Transpeptidase |
ALKPHOS |
Alkaline Phosphotase |
|
Number of Hal-pint Equivalents of Alcoholic Beverages Drunk Per Day |
SGPT |
Alamine Aminotransferase |
|
|
DRINKS |
SGOT |
Aspartate Aminotransferase |
|
|
TP |
Total Proteins |
||
|
ALB |
Albumin |
||
|
A/G |
Ratio Albumin and Globulin Ratio |
||
-
IV. Proposed Approach and Experimental Results
The classification process is carried out in order to determine the class of data in the phase of evaluation or analysis of the data. Classification algorithms are widely used in various medical applications. It is aimed to build an effective model for predicting class labels of unknown data by utilizing these algorithms. The model which includes a two phase process describes and distinguishes data classes, for the purpose of being able to use the model to predict the class of objects whose class label is unknown [28]. These algorithms build a classifier by using the training data in first phase. The performance of model is analyzed on the testing data in second phase. The machine learning is carried out by means of these steps. That is, the model performs class assignment for the data that it does not known and encounter firstly within the frame of its abilities and skills. Feature ranking is useful to gain knowledge of data and identify relevant features. There are many studies on this subject in the literature. For example, Akyol investigated the important attributes for effective diagnosis of liver disorders by performing the machine learning approach based on the combination of Stability Selection and Random Forest methods [29]. Chittineni and Bhogapathi applied the Exhaustive search and Heuristic search techniques in order to determine features that contribute to cluster data
-
[3 0]. Parimala and Nallaswamy proposed swarm optimization technique, binary particle swarm optimization technique and its variants in order to select the optimal feature subset [31]. Kalpana and Mani compared the two methods Median Based Discretization and ChiMerge discretization. In their studies, the original features were ranked by both methods and the top ranked attributes were selected as the more relevant ones by using the feature relevance [32]. In another study, Alia and Taweel developed a new algorithm for Feature Selection based on hybrid Binary Cuckoo Search and rough set theory for classification on nominal datasets [33]. In this study, the SS method [34] which is beneficial in order to gain knowledge of data and identify germane features was used. RF which was introduced by Breiman [35] and which is ensemble learning method was used to compare its performance on the balanced and unbalanced datasets. To evaluate the performance of proposed approach, the Sensitivity (Sen) and Accuracy (Acc) metrics [36] which were defined in Equation (1) and (2) respectively were calculated for each dataset.
Sen = TP/(TP + FN) (1)
Acc = ( TP+TN ) / ( TP+FP+TN+FN ) (2)
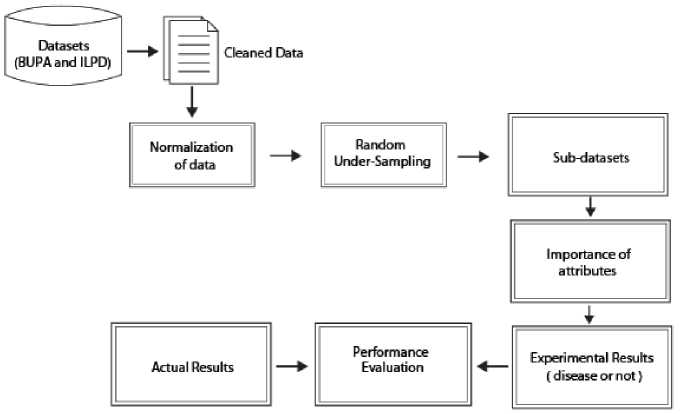
Fig.1. A flowchart of the proposed method.
Figure 1 shows the flow chart of the proposed approach. According to this flow chart, the operations which were performed in order to investigate the importance of attributes for liver disorder. The details are as follows:
-
a) Raw dataset was prepared and cleaned. The number of instance is 345 for BUPA dataset, and none of these instances contain null values or irrelevant values. On the other hand, the number of instance processed is 579 while there are 583 instances in ILPD after the instances which
include the null or irrelevant values were removed from this dataset.
-
b) The dataset was normalized into range from 0 to 1 values.
-
c) As seen in Table 3, the instance space in both datasets has an unbalanced distribution. Therefore, firstly Random Under-Sampling (RUS) method was performed on datasets for balancing it. And so, there are 145 patients and 145 non-patients, and 165 patients and 165 non-patients for BUPA and ILPD respectively.
-
d) And then, the sub-datasets were obtained from the
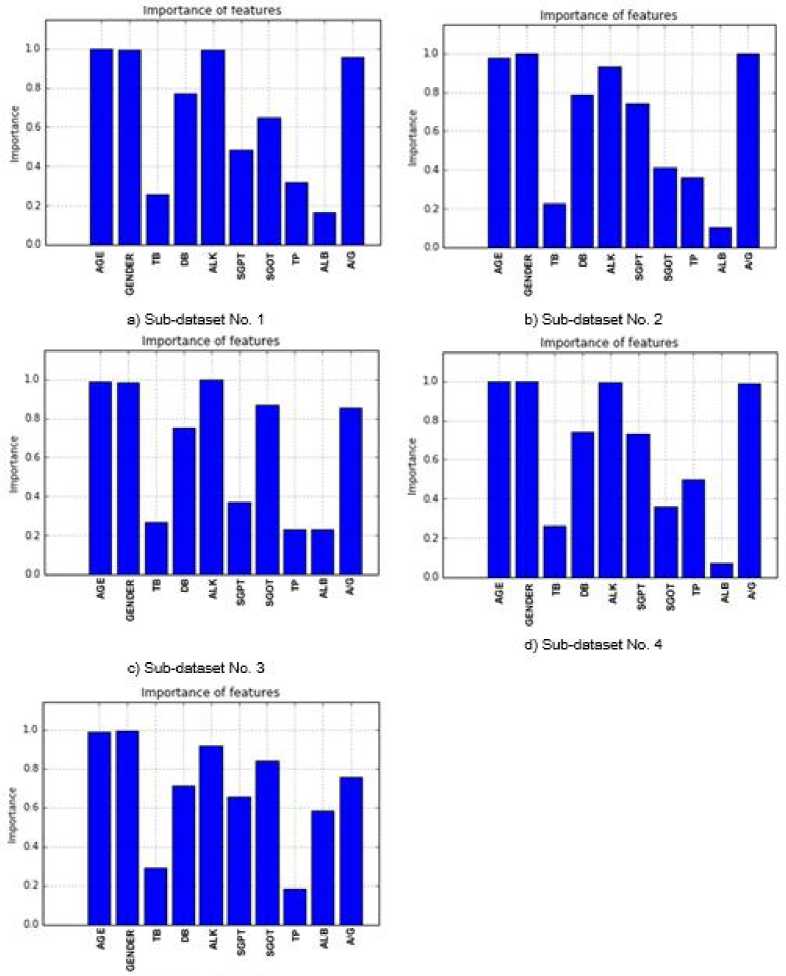
unbalanced and balanced datasets by using 5-fold cross-validation technique for successfully classification of all the data. After this, SS method was applied on these sub-datasets in order to identify the most effective attributes for outcome variable. The significance levels of the important attributes were presented in Figure 2 and 3. The averages of these values which were obtained on 5 sub-datasets were given in Table 4. According to this table, all variables but DRI are very important for the BUPA dataset. On the other hand, it seems to be quite important that AGE, GENDER, ALK and A/G test variables compared to others for the ILPD.
-
• These sub-datasets were divided into two parts. That is, 70% and 30% are used for training and testing respectively in order to achieve a high level of efficiency for the proposed approach. And after this step, these sub-datasets as the input data are sent to the RF algorithm and then machine learning were realized in order to predict the liver
disease or not. Thus, performance evaluations were performed on both unbalanced and balanced sub-datasets. The analysis results and the performance evaluations were presented in confusion matrix structure in Table 5. For example, according to the results of the classification analysis on the balanced sub-dataset no. 1, out of 32 data which was considered as positive, the RF found that 27 of them were positive. Also, out of 26 data which was considered as negative, the RF found that 19 of them were negative. Accordingly, the averages of the experimental results for each dataset were given at the bottom of the relevant tables. According to this table, the 77.24% and 74.85% accurate classification were achieved for both balanced datasets respectively. Experimental studies show that the combination of SS and RF methods proves to be efficient significantly. Also, Receiver Operating Characteristic (ROC) curve results of each model were given in Figure 4.
Importance of features importance of features
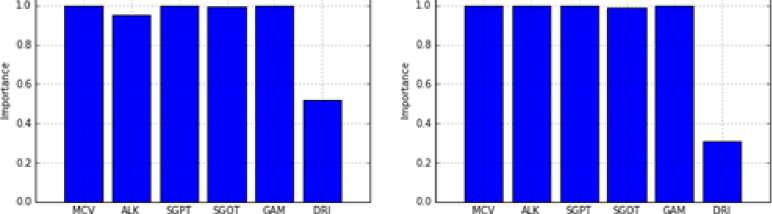
a) Sub-dataset No. 1 b) Sub-dataset No. 2
Importance of features Importance of features
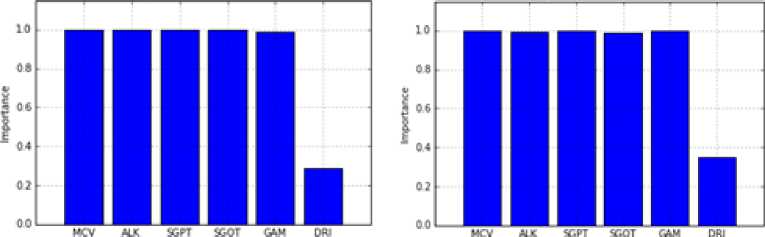
d) Sub-dataset No. 4
c) Sub-dataset No. 3
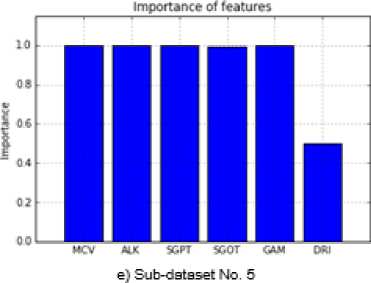
Fig.2. Importance of the Attributes for BUPA.
Table 3. Unbalanced and Balanced Sub-datasets
|
Datasets |
Unbalanced dataset |
Balanced dataset (RUS) |
||||
|
Train |
Test |
Train |
Test |
|||
|
True |
166 |
34 |
True |
113 |
32 |
|
|
False |
110 |
35 |
False |
119 |
26 |
|
|
True |
164 |
36 |
True |
116 |
29 |
|
|
False |
112 |
33 |
False |
116 |
29 |
|
|
LD |
LD |
|||||
|
BUPA |
True 200 True |
158 |
42 |
True 145 True |
111 |
34 |
|
False 145 False |
118 |
27 |
False 145 False |
121 |
24 |
|
|
True |
152 |
48 |
True |
117 |
28 |
|
|
False |
124 |
21 |
False |
115 |
30 |
|
|
True |
163 |
37 |
True |
113 |
32 |
|
|
False |
113 |
32 |
False |
119 |
26 |
|
|
Train |
Test |
Train |
Test |
|||
|
True |
131 |
34 |
True |
135 |
30 |
|
|
False |
332 |
82 |
False |
129 |
36 |
|
|
True |
131 |
34 |
True |
130 |
35 |
|
|
False |
332 |
82 |
False |
134 |
31 |
|
|
LD |
LD |
|||||
|
ILPD |
True 165 True |
138 |
27 |
True 165 True |
128 |
37 |
|
False 414 False |
325 |
89 |
False 165 False |
136 |
29 |
|
|
True |
135 |
30 |
True |
132 |
33 |
|
|
False |
328 |
86 |
False |
132 |
33 |
|
|
True |
133 |
32 |
True |
136 |
29 |
|
|
False |
330 |
84 |
False |
128 |
37 |
|
Table 4. The Average Significance Values of the Attributes
|
Dataset Name |
Abbreviation Average significance values of the test variables |
|
BUPA |
MCV 1.0 ALK 0.989 SGPT 1.0 SGOT 0.994 GAM 0.998 DRI 0.393 |
|
ILPD |
AGE 0.992 GENDER 0.995 TB 0.259 DB 0.751 ALK 0.967 SGPT 0.596 SGOT 0.626 TP 0.319 ALB 0.23 A/G 0.912 |
e) Sub-dataset No. 5
Fig.3. Importance of the Attributes for ILPD.
Trut Positive Rite
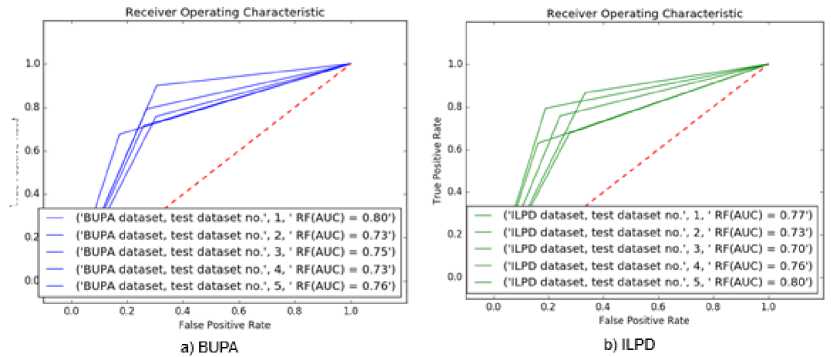
Fig.4. ROC Curve Results.
Table 5. Classification Results for All Sub-datasets
|
Confusion Matrices |
|||||
|
Datasets |
Unbalanced datasets |
Balanced datasets by utilizing RUS method |
|||
|
B U P A |
Sub-dataset no. 1 |
N P |
N P |
||
|
N P A S |
24 11 6 28 cc: 75.36% en: 82.35% |
N P A S |
19 7 5 27 cc: 79.31% en: 84.38% |
||
|
Sub-dataset no. 2 |
N P |
N P |
|||
|
N P A S |
16 17 2 34 cc: 72.46% en: 94.44% |
N P A S |
23 6 3 26 cc: 84.48% en: 89.66% |
||
|
Sub-dataset no. 3 |
N Y |
N P |
|||
|
N P A S |
23 4 7 35 cc: 84.06% en: 83.33% |
N P A S |
21 3 11 23 cc: 75.86% en: 67.65% |
||
|
Sub-dataset no. 4 |
N P |
N P |
|||
|
N P A S |
14 7 13 35 cc: 71.01% en: 72.92% |
N P A S |
18 12 2 26 cc: 75.86% en: 92.86% |
||
|
Sub-dataset no. 5 |
N P |
N P |
|||
|
N P A S |
9 23 8 29 cc: 55.07% en: 78.38% |
N P A S |
19 7 10 22 cc: 70.69% en: 68.75% |
||
|
Average Acc Average Sen |
71.59% 82.28% |
77.24% 80.66% |
|||
|
I L P D |
Sub-dataset no. 1 |
N P |
N P |
||
|
N P A S |
76 6 26 8 cc: 72.41% en: 23.53% |
N P A |
25 11 3 27 cc: 78.79% Sen: 90.0% |
||
|
Sub-dataset no. 2 |
N P |
N P |
|||
|
N P A S |
74 8 28 6 cc: 68.97% en: 17.65% |
N P A S |
23 8 10 25 cc: 72.73% en: 71.43% |
||
|
Sub-dataset no. 3 |
N P |
N P |
|||
|
N P S |
78 11 18 9 Acc: 75% en: 33.33% |
N P A S |
24 5 12 25 cc: 74.24% en: 67.57% |
||
|
Sub-dataset no. 4 |
N P |
N P |
|||
|
N P A S |
76 10 23 7 cc: 71.55% en: 23.33% |
N P A S |
23 10 8 25 cc: 72.73% en: 75.76% |
||
|
Sub-dataset no. 5 |
N P |
N P |
|||
|
N P A S |
71 13 20 12 cc: 71.55% en: 37.50% |
N P A S |
27 10 6 23 cc: 75.76% en: 79.31% |
||
|
Average Acc Average Sen |
71.9% 27.07% |
74.85% 76.77% |
|||
|
N: Negative, P: Positive |
|||||
This study shows that working with a balanced dataset increases the success of any system. In other words, when unbalanced data are used, the memorization occurs and this prevents the machine learning.
-
V. Conclusion
The liver is an essential body organ that forms an important barrier between the gastrointestinal blood which contains large amounts of toxins and antigens in the body. The impairment of this organ is the main reason of illness and death. The main purpose of this study is to investigate the importance of attributes for the disease and to realize machine learning in this context. A machine learning approach based on SS and RF methods were presented for effective diagnosis of liver disorders in this study. In order to generate more accuracy for liver disorder disease, this study suggests an approach consist of two phases: (1) Random Under-Sampling method was used in major classes to compensate effectively the insufficiency of data (2) The performance of the combination of SS and RF methods were evaluated. Important attributes in all attributes were detected by utilizing the SS method which was performed on subdatasets, which were obtained with 5 fold crossvalidation technique. By sending these datasets to the Random Forest algorithm, the performance of the proposed approach was evaluated within the frame of the Acc and Sen metrics. Experiments were carried out on two datasets, BUPA and ILPD. The experimental results show clearly that the RUS method can potentially improve the performance of SS and RF methods in machine learning. And, the combination of these methods provide new perspectives for the diagnosis of this disease and other medical diseases.
Acknowledgments
The authors would like to thank the UCI Machine Learning Repository for providing the ILPD (Indian Liver Patient Dataset) and BUPA Dataset.
References A study on liver disease diagnosis based on assessing the importance of attributes
- E.M. Hashem, and M.S. Mabrouk, “A study of support vector machine algorithm for liver disease diagnosis,” American Journal of Intelligent Systems, vol. 4, pp. 9-14, 2014.
- W.A. Zatoński, U. Sulkowska, M. Mańczuk, J. Rehm, P. Boffetta, A.B. Lowenfels, and C. La Vecchia, “Liver cirrhosis mortality in Europe, with special attention to Central and Eastern Europe,” Eur Addict Res, vol. 16, pp. 193-201, 2010.
- Internet: Liver disease, http://www.nhs.uk/conditions/liver-disease/Pages/Introduction.aspx, 2017.
- F.S. Wang, J.G. Fan, Z. Zhang, B. Gao and H.Y. Wang, “The global burden of liver disease: The major impact of China,” Hepatology, vol. 60, pp. 2099-2108, 2014.
- Internet: Liver Center - Liver Disease Facts, http://livercenter.slu.edu/index.php?page=liver-disease-facts, 2017.
- Internet: Medline Plus. Alcoholic liver disease, http://www.nlm.nih.gov/medlineplus/ency/article/000281.htm, 2017.
- European Association for the Study of the Liver, “Clinical practical guidelines: management of alcoholic liver disease,” J. Hepatol, vol. 57, pp. 399-420, 2012.
- P. Byass, “The global burden of liver disease: a challenge for methods and for public health,” BMC Med., vol. 12, pp. 1-3, 2014.
- Internet: Alcohol - alcohol use disorders and alcoholic liver diseases, http://www.who.int/medicines/areas/priority_medicines/BP6_14Alcohol.pdf?ua=1, 2017.
- J. Pahareeya, R. Vohra, J. Makhijani and S. Patsariya, “Liver patient classification using intelligence techniques,” International Journal of Advanced Research in Computer Science and Software Engineering, vol. 4, pp. 295-299, 2014.
- H. Pakhale and D.K. Xaxa, “Development of an efficient classifier for classification of liver patient with feature selection,” International Journal of Computer Science and Information Technologies, vol. 7, pp. 1541-1544, 2016.
- S. Dhamodharan “Liver disease prediction using Bayesian classification,” 4th National Conference on Advanced Computing, Applications & Technologies, pp. 1-3, May 2014.
- Reetu and N. Kumar, “Medical diagnosis for liver cancer using classification techniques,” International journal of Recent Scientific Research, vol. 6, pp. 4809-4813, 2015.
- A.S. Aneeshkumar and C. Jothi Venkateswaran, “Estimating the survallience of liver disorder using classification algorithms,” International Journal of Computer Applications, vol. 57, pp. 39-42, 2012.
- H. Jin, S. Kim and J. Kim, “Decision factors on effective liver patient data prediction,” International Journal of Bio-Science and Bio-Technology, vol. 6, pp. 167-178, 2014.
- P. Rajeswari and G.S. Reena, “Analysis of liver disorder using data mining algorithm,” Global Journal of Computer Science and Technology, vol. 10, pp. 48-52, 2010.
- C. Liang and L. Peng, “An automated diagnosis system of liver disease using Artificial Immune and Genetic Algorithms,” J Med Syst., vol. 37, p. 9932, 2013.
- P. Saxena and S. Lehri, “Analysis of various clustering algorithms of data mining on health informatics,” International Journal of Computer & Communication Technology, vol. 4, pp. 108-112, 2013.
- S. Kant and I.A. Ansari, “An improved K means clustering with Atkinson index to classify liver patient dataset,” International Journal of System Assurance Engineering and Management, vol. 7 (Supplement 1), pp. 222–228, 2016.
- D.H. Fisher, “Knowledge acquisition via incremental conceptual clustering,” Machine Learning, vol. 2, pp. 139-172, 1987.
- M. Ester, H.P. Kriegel, J. Sander and X. Xu, “A density-based algorithm for discovering clusters in large spatial databases with noise,” In Proceedings of 2nd International Conference on KDD, pp. 226-231, 1996.
- Internet: Hierarchical and K-means clustering, https://www.autonlab.org/tutorials/kmeans.html, 2017.
- H. Sug, “Improving the prediction accuracy of liver disorder disease with oversampling,” Proceedings of the 6th WSEAS international conference on Computer Engineering and Applications, and Proceedings of the 2012 American conference on Applied Mathematics, Applied Mathematics in Electrical and Computer Engineering, pp. 331-335, Harvard, Cambridge, Jan 2012.
- T.Y. Park, M. Hong, H. Sung, S. Kim and K.T. Suk, “Effect of Korean Red Ginseng in chronic liver disease,” Journal of Ginseng Research, in press.
- D. Joshi, N. Gupta, M. Samyn, M. Deheragoda, F. Dobbels and M.A. Heneghan, “The management of childhood liver diseases in adulthood,” Journal of Hepatology, vol. 66, pp. 631-644, 2017.
- E. Buzzetti, P.M. Parikh, A. Gerussi and E. Tsochatzis, “Gender differences in liver disease and the drug-dose gender gap,” Pharmacological Research, vol. 120, pp. 97-108, 2017.
- J.F. Gallegos-Orozco and M.R. Charlton, “Alcoholic liver disease and liver transplantation,” Clinics in Liver Disease, vol. 20, pp. 521-534, 2016.
- J. Han, M. Kamber and J. Pei, Data Mining: Concepts and Techniques, 3rd ed., San Francisco, CA, USA, 2011.
- K. Akyol, “Assessing the importance of attributes for diagnosis of diabetes disease,” International Journal of Information Engineering and Electronic Business(IJIEEB), vol. 9, pp. pp. 1-9, 2017.
- S. Chittineni and R.B. Bhogapathi, “Determining contribution of features in clustering multidimensional data using Neural Network,” I.J. Information Technology and Computer Science, vol. 10, pp. 29-36, 2012.
- R. Parimala and R. Nallaswamy, “Feature selection using a Novel Particle Swarm Optimization and It’s variants,” I.J. Information Technology and Computer Science, vol. 5, pp. 16-24, 2012.
- P. Kalpana and K. Mani, “An exploratory analysis between the feature selection algorithms IGMBD and IGChiMerge,” I.J. Information Technology and Computer Science, vol. 7, pp. 61-68, 2017.
- A.F. Alia and A. Taweel, “Feature selection based on hybrid Binary Cuckoo Search and Rough Set Theory in classification for nominal datasets,” I.J. Information Technology and Computer Science, vol. 4, pp. 63-72, 2017.
- F. Mordelet, J. Horton, A.J. Hartemink, B.E. Engelhardt, R. Gordân, “Stability selection for regression-based models of transcription factor–DNA binding specificity,” Bioinformatics, vol. 29, pp. i117–i125, 2013.
- L. Breiman, “Random forests,” Mach Learn, vol. 45, pp. 5-32, 2011.
- A. Baratloo, M. Hosseini, A. Negida and G.E. Ashal, “Part 1: Simple definition and calculation of accuracy. sensitivity and specificity,” Emerg (Tehran), vol. 3, pp. 48-49, 2015.
