A study on the diagnosis of parkinson’s disease using digitized wacom graphics tablet dataset

Author: Kemal Akyol
Journal: International Journal of Information Technology and Computer Science @ijitcs
Article in issue: 12 Vol. 9, 2017.
Free access
Parkinson Disease is a neurological disorder, which is one of the most painful, dangerous and non-curable diseases, which occurs at older ages. The Static Spiral Test, Dynamic Spiral Test and Stability Test on Certain Point records were used in the application which was developed for the diagnosis of this disease. These datasets were divided into 80-20% training and testing data respectively within the framework of 10-fold cross validation technique. Training data as the input data were sent to the Random Forest, Logistic Regression and Artificial Neural Networks classifier algorithms. After this step, performances of these classifier algorithms were evaluated on testing data. Also, new data analysis was carried out. According to the results obtained, Artificial Neural Networks is more successful than Random Forest and Logistic Regression algorithms in analysis of new data.
Parkinson disease, digitized Wacom graphics tablet, Static Spiral Test, Dynamic Spiral Test, Stability Test on Certain Point
Short address: https://sciup.org/15016218
IDR: 15016218 | DOI: 10.5815/ijitcs.2017.12.06
Text of the scientific article A study on the diagnosis of parkinson’s disease using digitized wacom graphics tablet dataset
Published Online December 2017 in MECS DOI: 10.5815/ijitcs.2017.12.06
Parkinson’s disease (PD) is a neurological disorder, which is one of the most painful, dangerous and non-curable diseases, which occurs at older ages. So, it has negative impacts on patients’ daily life [1]. A common disease of the central nervous system among the elderly [2], Parkinson’s disease (PD) is currently incurable [3]. The correct diagnosis of this disease is very difficult [4], but proper treatment of this disease can ease the symptoms and improve the quality of life of patients significantly [3]. Its complex symptoms bring about challenges for the clinical diagnosis [2]. Thus, its efficient monitoring and management are very important [3]. Digital analysis of writing and drawing turned into a valuable research and clinical tool for the patients with essential tremor, Parkinson’s disease, dystonia, and related disorders [5]. Digitized spiral drawing correlates with motor scores and might be more delicate in early changes than subjective ratings [6]. Spiral drawing is used in assessing of tremor severity for the clinical evaluation of medical treatments [7]. Sakar et al. [8] collected a wide range of voice samples for building predictive telediagnosis and telemonitoring models. They investigated more PD-discriminative information, using well-known machine learning tools and published the dataset for researchers. In this study, the SST, DST and STCP datasets were obtained from this publicly raw data source. These datasets were divided into 80-20% training and test data respectively within the framework of 10fold cross validation technique. The diagnosis of this disease was explored by utilizing these datasets. Next, by sending these datasets as input data to the classifier algorithms, successes of these algorithms were analyzed. The rest of this paper was organized as follows: In Section 2, related studies were examined. In Section 3 and 4, information about the machine learning algorithms and statistical analysis metrics which were used in the designed application were given respectively. In Section 5, the information about the data was given in detail. In Section 6, design process and results were presented. Finally, the conclusion was given in Section 7.
-
II. Related Works
There are numerous studies on this disease. Some of the studies are as follows: In [2], the authors proposed a new method based on a polar coordinate system with varying origin in order to quantitatively evaluate the performance in spiral drawing tasks for patients with PD. Fifteen subjects, three of whom normal subjects and twelve of whom are PD patients, were included in the designed spiral drawing experiment. The hand movements of patients were recorded by utilizing the digitized tablet respectively. The variation of origin, radius, degree and other characteristics of hand movements were evaluated by introducing a set of parameters for feature extraction. The result showed that the proposed polar coordinate system embraced good performance in the quantitative evaluation of spiral drawing. In [3], the authors proposed a machine learning model that detects bradykinesia and dyskinesia for selfmonitoring the motor function in Parkinson's disease. Bradykinesia, which is the slowness of movement, is typically associated with under-medication. Dyskinesia which is involuntary movements can be the result of over-medication. More specifically, the aim was to objectively assess motor symptoms related to bradykinesias and dyskinesias. This work combined spirography data and clinical assessments from a longitudinal clinical study in Sweden with the features and pre-processing methodology of a Slovenian spirography application. Over the course of three years, over 30.000 spiral-drawing measurements were involved on 65 advanced PD patients, and 86% classification accuracy and over 0.90 AUC were achieved. In [4], The authors developed a new dataset based on handwritten exams to aid diagnosis of Parkinson's Disease. The features were extracted from this dataset over two different drawings: spirals and meanders. This approach seemed to be suitable for aiding in the automatic diagnosis of this disease by means of computer vision and machine learning techniques. In [5], the authors introduced a novel adaptation of the Wacom-based method, using an Apple iPad-based system for computerized spiral analysis of hand-drawn Archimedean spirals. These spirals provide insight into movement dynamics beyond subjective visual assessment, using a Wacom graphics tablet. In [6], the authors drew spirals on a digitizing tablet, generating x, y, z data-coordinates and time data, and derived indices corresponded to overall spiral execution, shape and second order smoothness, first order zero-crossing, tightness, mean speed and variability of spiral width. All indices were significantly different between PD cases and controls, except for zero-crossing. Their model using all indices had high discriminative validity (sensitivity = 0.86, specificity = 0.81). In [7], the authors proposed new methods which provide new insight into tremor amplitude and frequency variations for computerized spiral analysis. Successful results were obtained from the digitized tablet with their implementation. In [9], the authors used a test battery consisting of self-assessments and motor tests which include tapping and spiral drawing tasks, on 9482 test occasions by 62 patients with advanced PD in a telemedicine setting. On each test occasion, three Archimedes spirals were traced. Bland-Altman analysis was used to evaluate agreement between the spiral score and the standardized manual rating. In [10], the authors investigated the spiral drawing performance as an indicator of fine motor function. Seven people with multiple sclerosis, nine younger controls, and eight older controls drew spirals on a graphics tablet at a comfortable speed and size. Analysis results demonstrated the utility of the analysis of spiral movements as an objective technique for assessing motor control degradation. In [11], the authors investigated whether a smartphone-based system can be used to quantify dexterity in PD. More specifically, they developed data-driven methods in order to quantify and characterize dexterity in PD. Nineteen advanced PD patients and 22 healthy controls participated in a clinical trial in Uppsala, Sweden. The subjects were asked to perform tapping and spiral drawing tests, using a smartphone. The raw tapping and spiral data were processed and analyzed with time series analysis techniques in order to extract 37 spatiotemporal features. For each of the five scales, machine learning models were built and tested by utilizing the principal components of the features as predictors and mean ratings of the three specialists as target variables. In [12], the authors demonstrated that handwriting markers could be used for PD symptoms profiling successfully. They defined a novel metric as the normalized velocity variability. This metric is very potent in identifying pathological movement patterns. And they explored the use of a pen-and-tablet device to study differences in hand movement and muscle coordination between healthy subjects and PD patients. They applied a comprehensive machine learning approach to build a model that could classify unknown subjects based on their line-drawing performances. The results showed that this study was a good candidate for recognition of healthy and PD individuals, and promised in the context of telemedicine applications.
-
III. Machine Learning Algorithms
A machine learning is the process which obtained meaningful information from the data stack. There are many studies which carried out on this subject in the literature. Bhuvaneswari and Sabarathinam detected the defects in the manufactured ceramic tiles to ensure high density quality, using Artificial Neural Network [13]. Khazaee proposed a multi-class support vector machine (SVM)-based classifier for heart beat classification [14]. Nanda et al. used the Multi Layer Perceptron, Functionallink Artificial Neural Network and Legendre Polynomial Equation models for prediction of Rainfall in India. Quite accurate results were obtained with these models for complex time series model [15]. Ghiasi-Freez et al. optimized the Neural Network models for the prediction of nuclear magnetic resonance parameters in carbonate reservoir. For this, they used Genetic Algorithm, Particle Swarm Optimization, and Ant Colony Intelligent optimization algorithms [16]. The authors carried out voice analysis for telediagnosis of Parkinson disease, using Artificial Neural Networks and Support Vector Machines [17]. Finally, Al-Tahrawi performed the Arabic text categorization by using Logistic Regression method [18].
In this study, the classification algorithms which mentioned below were used for the machine learning. Besides, 10-fold cross validation technique was applied to improve the performance of the study. Each model was built and tested with training and testing data respectively.
-
A. Random Forest (RF)
With the RF algorithm which introduced by Breiman [19], the tree structure is constituted by determining the number of trees and the samples will be used in each node. The classification of new dataset is performed by selecting the trees, which have the most votes in these trees [20].
-
B. Logistic Regression (LR)
LR is a regression method that helps to classify and assign the binary outcome variable. For example, a relationship between the age and the presence or absence of any disease is investigated by utilizing this method [21]. It is the most popular model in statistical modeling of binary response Y and quantitative explanatory variables [22].
-
C. Artificial Neural Networks (ANN)
A neural network is a machine. It is designed in order to perform the human brain functions [23]. An ANN is a combination of interconnected simple processing elements, units or nodes. The ability of the network depends on a number of weights that are obtained through learning a set of training examples [24].
-
IV. Statistical Analysis
The performances of the machine learning methods are assessed by utilizing the Accuracy (Acc) and Sensitivity (Sen) metrics. These metrics are used to show the effectiveness of the proposed methodology. The definitions of these metrics are as follows:
Acc = ( TP + TN ) / ( TP + FP + TN + FN )
The Acc metric, which is given in Equation 1, can be expressed as the ratio of the number of accurately diagnosed instances to the number of total instances and it is the most widely used measurement of model success. The Sen metric, which is given in Equation 2, can be expressed as the ratio of the number of the patients who were classified as correctly to total patients having PD [25]. These metrics can be calculated based on four values:
-
a) True Positive (TP), the number of the patients who were classified as correctly out of the patients having PD,
-
b) False Negative (FN), the number of the patients who were classified as incorrectly out of the patients having PD,
-
c) True Negative (TN), the number of the patients who were classified as correctly out of the patients not having PD,
-
d) False Positive (FP), the number of the patients who were classified as incorrectly out of the patients not having PD.
Sen = TP/(TP + FN)
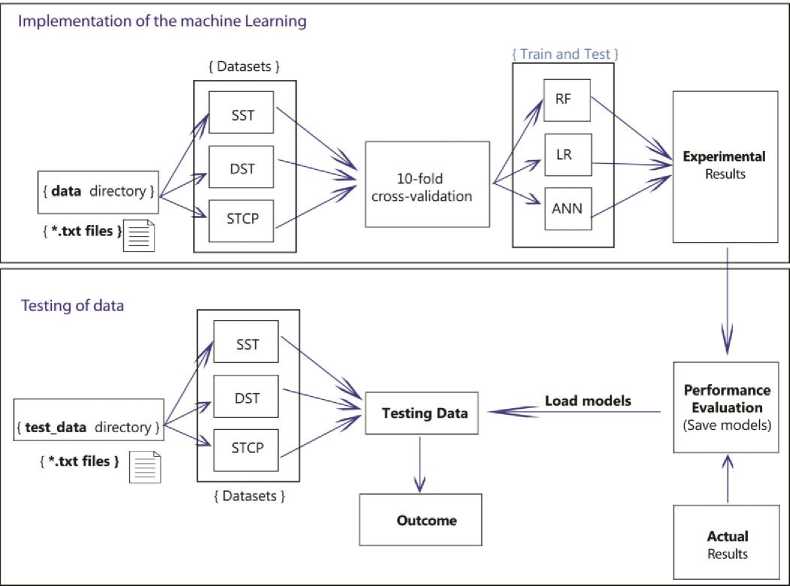
Fig.1. A general flowchart of the proposed approach.
-
V. Data
The publicly available dataset ( 1 ) which was constructed, using Wacom Cintiq 12WX graphics table 1
ngs+Using+Digitized+Graphics+Tablet consists of two different groups of handwriting samples (62 people with Parkinson (PWP) and 15 healthy individuals) from the Department of Neurology in Cerrahpasa Faculty of Medicine, Istanbul University. There are three different kinds of tests developed for the data collection via graphics tablet. They are as follows: Static Spiral Test (SST): Three wound Archimedean spirals appears on the graphics tablet using the software and patients were asked to retrace the same spiral as much as they can, using the digital pen in this test. Dynamic Spiral Test (DST): The purpose of this test is to determine the change in patient's drawing performance and pause times since it is more difficult to retrace the Archimedean spiral in this case. It was observed that most of the patients continued drawing but nearly all of them lost the pattern as a result of this test. Stability Test on Certain Point (STCP): There is a certain red point in the middle of the screen and the subjects are asked to hold the digital pen on the point without touching the screen in a certain time in this test. The purpose of this test is to determine the patient's hand stability or hand tremor level [8, 20].
b) Evaluation metrics for the DST
VI. Design Process and Results
Figure 1 describes the flowchart of the proposed approach for diagnosis of the PD. This study was carried out on the Python 2.7 platform imported “scikit-learn” machine learning library. As shown in the flowchart, the datasets were obtained by reading data directory which includes control (the patients non-having PD) and parkinson (the patients having PD) directories for the SST, DST and STCP. The information obtained from these directories was presented in Table 1 and 2. These datasets were divided into 80-20% training and testing data respectively within the framework of 10-fold crossvalidation technique. Training data as the input data were sent to the RF, LR and ANN classifier algorithms. Each classifier predicted whether the subject had PD or not. After this step, performances of these classifier algorithms were evaluated on testing data.
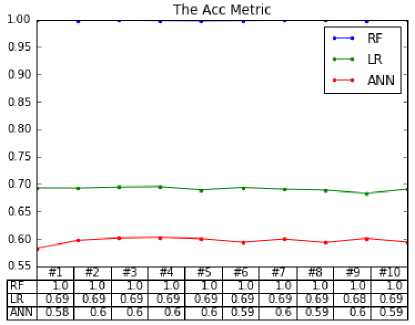
Table 1. Information of parkinson and control directories in data directory.
|
{ data directory } |
|||
|
Test name |
parkinson (1) |
control (0) |
Total |
|
SST |
81073 |
53186 |
134259 |
|
DST |
84258 |
56372 |
140630 |
|
STCP |
37328 |
10752 |
48080 |
a) Evaluation metrics for the SST
___ The Acc Metric
|
LOO 0 95 0.90 0.85 0.80 0.75 0.70 0.65 0.60 0.55 |
— RF — LR — ANN |
||||||||||
|
#2 |
#4 |
#5 |
#7 |
#9 |
#10 |
||||||
|
RH |
10 |
10 |
10 |
10 |
10 |
10 |
10 |
10 |
10 |
||
|
LH |
0./3 |
0.72 |
0./2 |
0./2 |
0.72 |
0./2 |
0.72 |
0./2 |
0.72 |
0./3 |
|
|
ANN |
0 61 |
0.6 |
0.6 |
0.6 |
0.6 |
0.6 |
0.6 |
0.6 |
0.6 |
0.61 |
|
c) Evaluation metrics for the STCP
The Acc Metric
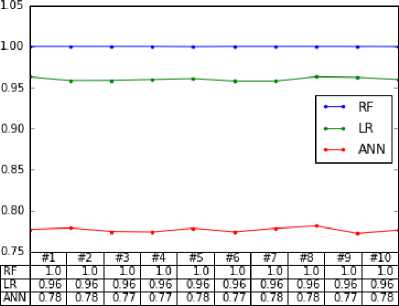
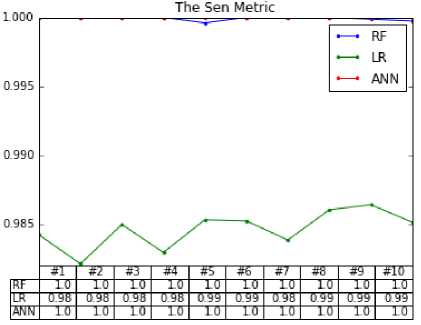
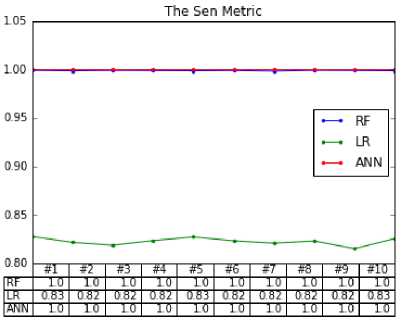
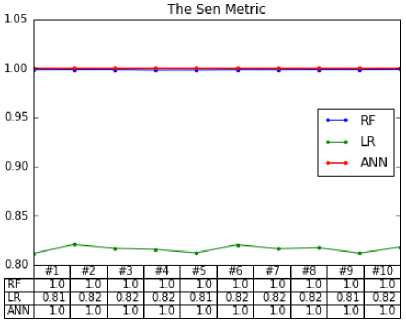
Fig.2. Classification results for the SST, DST and STCP datasets.
The Acc and Sen metrics for each learning were given in Figure 2. According to this figure, experimental results are as follows:
The best performance was achieved with the RF algorithm for each three datasets based on the Acc metrics. That is to say, the RF classifier is more successful than others for the SST and DST in terms of this metric.
On the other hand, the RF and LR classifiers are more successful than ANN classifier for the STCP.
The RF and ANN classifiers but LR are the best for all datasets based on the Sen metric.
In addition, new data analysis was carried out by reading the data in the test_data directory in line with this information. Only the information of patients having PD is available in test dataset, and the number of them is 87455. Therefore, Acc metrics are the same as the Sen metrics. The obtained results which were given in the 3-column and 4-row confusion matrix were presented in
Table 3. According to this table, experimental results on testing data are as follows:
The Acc metrics are 100.0%, 100.0% and 100.0% on the SST, DST and STCP datasets respectively by performing with the ANN. That is, the ANN correctly classified all of the patients having PD for each dataset.
The Acc metrics are 52.90%, 51.94% and 99.74% on the SST, DST and STCP datasets respectively by performing with the RF algorithm. It can be said that the RF algorithm is quite successful for STCP. Namely, the RF algorithm was classified correctly 46268 out of 87455 PD for SST. It classified correctly 27004 out of 51992 patients for DST and classified 62163 out of 62327 patients for STCP.
The Acc metrics are 50.37%, 57.98% and 86.87% on the SST, DST and STCP datasets respectively by performing with the LR algorithm. The LR algorithm was classified correctly 44052 out of 87455 PD for SST. It classified correctly 30143 out of 51992 patients for DST and classified 54142 out of 62327 patients for STCP. It can be seen that RF and LR algorithms are quite successful for STCP. However, they are not successful for the other datasets, SST and DST.
It is interesting to note that the ANN algorithm is more successful in the classification of Table 2 data (test_data directory), while the RF algorithm in the classification of Table 1 data (data directory) is ahead.
Table 3. Classification results for test data.
|
Classifier Algorithms |
|||||||||||||||
|
Test data |
RF |
LR |
ANN |
||||||||||||
|
Dataset no. 1: SST |
|||||||||||||||
|
No |
Yes |
No |
Yes |
No |
Yes |
||||||||||
|
No |
0 |
0 |
No |
0 |
0 |
No |
0 |
0 |
|||||||
|
Yes |
41187 |
46268 |
Yes |
43403 |
44052 |
Yes |
0 |
87455 |
|||||||
|
Acc: 52.9% |
Acc: 50.37% |
Acc: 100.0% |
|||||||||||||
|
Sen: 52.9% |
Sen: 50.37% |
Sen: 100.0% |
|||||||||||||
|
Dataset no. 2: DST |
|||||||||||||||
|
No |
Yes |
No |
Yes |
No |
Yes |
||||||||||
|
No |
0 |
0 |
No |
0 |
0 |
No |
0 |
0 |
|||||||
|
Yes |
24988 |
27004 |
Yes |
21849 |
30143 |
Yes |
0 |
51992 |
|||||||
|
Acc: 51.94% |
Acc: 57.98% |
Acc: 100.0% |
|||||||||||||
|
Sen: 51.94% |
Sen: 57.98% |
Sen: 100.0% |
|||||||||||||
|
Dataset no. 3: STCP |
|||||||||||||||
|
No |
Yes |
No |
Yes |
No |
Yes |
||||||||||
|
No |
0 |
0 |
No |
0 |
0 |
No |
0 |
0 |
|||||||
|
Yes |
164 |
62163 |
Yes |
8185 |
54142 |
Yes |
0 |
62327 |
|||||||
|
Acc: 99.74% |
Acc: 86.87% |
Acc: 100.0% |
|||||||||||||
|
Sen: 99.74% |
Sen: 86.87% |
Sen: 100.0% |
|||||||||||||
Table 2. PD information in “test_data” directory
|
{ test_data directory } |
|||
|
Test name |
parkinson (1) |
control (0) |
Total |
|
SST |
87455 |
--- |
87455 |
|
DST |
51992 |
--- |
51992 |
|
STCP |
62327 |
--- |
62327 |
-
VII. Conclusion
PD is a neurological disorder, which is one of the most painful, dangerous and non-curable diseases, which occurs at older ages. So, it has negative impacts on patients’ daily life. Static Spiral Test, Dynamic Spiral Test and Stability Test on Certain Point records were used in the application which was developed for the diagnosis of this disease. These records, which were obtained from the raw-dataset, were divided into 80-20% training and testing data respectively within the framework of 10-fold cross validation technique. Training data as the input data were sent to the RF, LR and ANN classifier algorithms. After this step, performances of these classifier algorithms were evaluated on testing data. Moreover, new data analysis was carried out. According to the results obtained, it is interesting to note that the ANN algorithm has proved more successful in the classification of Table 2 data, while the RF algorithm in the classification of Table 1 data is ahead. Namely, ANN algorithm is more successful than RF and LR algorithms for the analysis of new data.
Acknowledgment
The author would like to thank the UCI Machine Learning Repository for providing the Parkinson Disease Dataset.
References A study on the diagnosis of parkinson’s disease using digitized wacom graphics tablet dataset
- G. Yadav, Y. Kumar and G. Sahoo, “Predication of Parkinson's disease using data mining methods: a comparative analysis of tree, statistical, and support vector machine classifiers,” Indian J Med Sci, vol. 65, pp. 231-242, 2011.
- M. San Luciano, C. Wang, R.A. Ortega, Q. Yu, S. Boschung, J. Soto-Valencia, et al., “Digitized Spiral Drawing: A Possible Biomarker for Early Parkinson’s disease,” PLoS One, vol. 11, e0162799, 2016.
- J. Westin, S. Ghiamati, M. Memedi, D. Nyholm, A. Johansson, M. Dougherty, T. Groth, “A new computer method for assessing drawing impairment in Parkinson's disease,” J Neurosci Methods, vol. 130, pp. 143-148, 2010.
- M.G. Longstaff, and R.A. Heath, “Spiral drawing performance as an indicator of fine motor function in people with multiple sclerosis,” Human Movement Science, vol. 25, pp. 474-491, 2006.
- J.A. Sisti, B. Christophe, A.R. Seville, A.L. Garton, V.P. Gupta, A.J. Bandin, Q. Yu, S.L. Pullman, “Computerized spiral analysis using the iPad,” Journal of Neuroscience Methods, vol. 275, pp. 50-54, 2017.
- M. Wang, B. Wang, J. Zoua, M. Nakamura, “A new quantitative evaluation method of spiral drawing for patients with Parkinson’s disease based on a polar coordinate system with varying origin,” Physica A: Statistical Mechanics and its Applications, vol 391, pp. 4377-4388, 2012.
- A.P. Legrand, I. Rivals, A. Richard, E. Apartis, E. Roze, M. Vidailhet, S. Meunier, E. Hainque, “New insight in spiral drawing analysis methods – Application to action tremor quantification,” Clinical Neurophysiology, vol. 128, pp. 1823-1834, 2017.
- B.E. Sakar, M.E. Isenkul, C.O. Sakar, A. Sertbas, F. Gurgen, S. Delil, H. Apaydin, O. Kursun, “Collection and analysis of a Parkinson speech dataset with multiple types of sound recordings,” Journal of Biomedical and Health Informatics, vol. 17, pp. 828–834, 2013.
- S. Aghanavesi, D. Nyholm, M. Senek, F. Bergquist, M. Memedi, “A smartphone-based system to quantify dexterity in Parkinson's disease patients,” Informatics in Medicine Unlocked, vol. 9, pp. 11-17, 2017.
- C.R. Pereira, D.R. Pereira, F.A. Silva, J.P. Masieiro, S.A. Weber, C. Hook, J.P. Papa, “A new computer vision-based approach to aid the diagnosis of Parkinson's disease,” Comput Methods Programs Biomed, vol. 136, pp. 79-88, 2016.
- A. Sadikov, V. Groznik, M. Možina, J. Žabkar, D. Nyholm, M. Memedi, D. Georgiev, “Feasibility of spirography features for objective assessment of motor function in Parkinson's disease,” Artificial Intelligence in Medicine, in press, 2017.
- C. Kotsavasiloglou, N. Kostikis, D. Hristu-Varsakelis, M. Arnaoutoglou, “Machine learning-based classification of simple drawing movements in Parkinson's disease,” Biomedical Signal Processing and Control, vol. 31, pp. 174-180, 2017.
- S. Bhuvaneswari, J. Sabarathinam, “Defect Analysis Using Artificial Neural Network,” I.J. Intelligent Systems and Applications, vol. 05, pp. 33-38, 2013.
- A. Khazaee, “Heart Beat Classification Using Particle Swarm Optimization,” I.J. Intelligent Systems and Applications, vol. 06, pp. 25-33, 2013.
- S.K. Nanda, D.P. Tripathy, S.K. Nayak, S. Mohapatra, “Prediction of Rainfall in India using Artificial Neural Network Models,” I.J. Intelligent Systems and Applications, vol. 12, pp. 1-22, 2013.
- J. Ghiasi-Freez, A. Hatampour, P. Parvasi, “Application of Optimized Neural Network Models for Prediction of Nuclear Magnetic Resonance Parameters in Carbonate Reservoir Rocks,” I.J. Intelligent Systems and Applications, vol. 06, pp. 21-32, 2015.
- Saloni, R. K. Sharma, A. K. Gupta, “Voice Analysis for Telediagnosis of Parkinson Disease Using Artificial Neural Networks and Support Vector Machines,” I.J. Intelligent Systems and Applications, vol. 06, pp. 41-47, 2015.
- M.M. Al-Tahrawi, “Arabic Text Categorization Using Logistic Regression,” I.J. Intelligent Systems and Applications, vol. 06, pp. 71-78. 2015.
- L. Breiman, “Random forests”, Mach Learn, vol. 45, pp. 5-32, 2001.
- O. Akar, and O. Gungor, “Classification of multispectral images using Random Forest algorithm,” Journal of Geodesy and Geoinformation, vol. 1, pp. 139-146, 2012.
- S. Lemeshow, and D. Hosmer, “Applied logistic regression”, 2nd ed. New York, USA: Wiley, 2000.
- A. Agresti, “An introduction to categorical data analysis”, 2nd ed. New Jersey, USA: Wiley, 2007.
- S. Haykin, “Neural Networks and Learning Machines”, 3rd ed., Prentice Hall, New York.
- K. Gurney, “An introduction to neural networks”, London and New York, UCL Press, 1997.
- A. Baratloo, M. Hosseini, A. Negida, and G.E. Ashal, “Part 1: Simple Definition and Calculation of Accuracy, Sensitivity and Specificity,” Emerg (Tehran), vol. 3, pp. 48-49, 2015.
- M.E. Isenkul, B.E. Sakar, O. Kursun, “Improved spiral test using digitized graphics tablet for monitoring Parkinson's disease,” The 2nd International Conference on e-Health and Telemedicine (ICEHTM-2014), pp. 171-175, 2014.
