A Survey On Emotion Classification From Eeg Signal Using Various Techniques and Performance Analysis

Author: M. Sreeshakthy, J. Preethi, A. Dhilipan
Journal: International Journal of Information Technology and Computer Science(IJITCS) @ijitcs
Article in issue: 12 Vol. 8, 2016.
Free access
In this paper, the human emotions are analyzed from EEG Signal (Electroencephalogram) with different kinds of situation. Emotions are very important in different activity and decision making. Various feature extraction techniques like discrete wavelet transform, Higher Order crossings, Independent component analysis is used to extract the particular features. Those features are used to classify the emotions with different groups like arousal and valence level using different classification techniques like Neural networks, Support vector machine etc.. Based on these emotion groups analyze the performance and accuracy for the classification are determined.
Feature Extraction, Classification, Valence and Arousal, Neural Networks
Short address: https://sciup.org/15012596
IDR: 15012596
Text of the scientific article A Survey On Emotion Classification From Eeg Signal Using Various Techniques and Performance Analysis
Published Online December 2016 in MECS DOI: 10.5815/ijitcs.2016.12.03
Emotions are playing an important role in several activities like decision making, cognitive process and Human Computer Interface. Based on the emotion, the Human Human Interaction (HHI), Human Machine Interaction (HMI) has played on important role in affective computing [2]. The emotions can be determined by various ways. The first kind of approach focuses the Facial expressions or speech. The audio –visual based techniques used to detect the emotion. The Second kind of approaches focuses on peripheral physiological signal. Different emotional state has been identified by using the Electrocardiogram, Skin Conductance. Third approach uses EEG signal. EEG signal is used to extract the human emotion because facial expression cannot be used to find the exact emotions. People can ignore to tell their feelings inside open; they can act in front of camera [3]. But the EEG tells that accurate feelings in a particular person. The emotions may be Happy, Sad, Fear, disgust, etc., this is the basic emotion, which is used to identify the mental stress, mental disorders. In Human Brain each and every cell has performed the particular functions like, occipital lobes perform visual tasks and temporal cell performs auditory task. EEG power has decreased during the sad emotion and increased during the happiness. The region that shows the difference between sadness and happiness is the frontal pole with left CBF being higher during sadness and lower during happiness [1]. So that we can identify the positive and negative emotions from the past experience. The emotions can be classified by using two ways, implicit memory and explicit memory. The implicit memory the emotions and decision making analysis only the present incident and explicit memory is used to analysis the past experience [1]. The Basic brain images are shown in Fig1. The Figure explains that, basic brain structure and its parts for storing and processing the information.
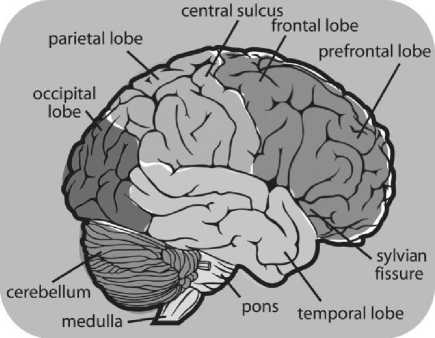
Fig.1. Brain Configuration
EEG signals are captured from the brain activity and the signal has to be preprocessed, after preprocessing those signals, feature has to be extracted and classifying those emotions. The basic EEG signal is shown in Fig 2. The Following figure shows that the sample EEG Signal which is used to analysis the emotion of the Human which is used for the cognitive thinking and decision making process.
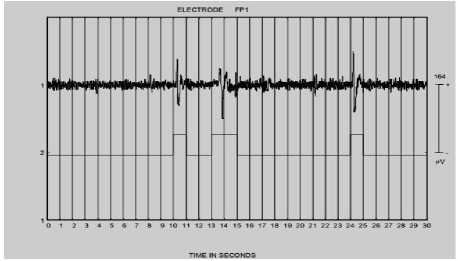
Fig.2. Sample EEG Signal
In this rest of the paper, Section II deals with, how the data’s are collected and how it's organized what are the different kinds of the bands available in EEG Data. Section III describes that Methods and Preprocessing the EEG signal for analysis, Feature Extraction and Emotion Classification and their related work are discussed. Sample Result will be discussed in Section IV. Performance Accuracy of the classification is discussed in Section V and Conclusion will be discussed in Section.
-
II. EEG D ATA
The EEG Data is collected from the healthy subjects. The subject is seated in the experimental room in front of the system and asked to fill the some set of questions , after finishing that process, some electrode has to be placed on the scalp. The EEG recorded using BIMEC from Brain maker BV [1]. The BIMEC has the reference channel with eight EEG sample signal with 250Hz. The EEG signal has collected from several activities. It has to be recorded using different factors like Subject- elicited vs. event- elicited, Laboratory setting vs. Real World, focus on expression vs. feeling of the emotion, openly recorded vs. hidden recording and emotion- purpose vs. other purpose [3].The emotions have to be captured by one minute eye closed and eye opener and also it has to be recorded with different kind of picture related signal. The pictures are collected from International Affective Picture System (IAPS) and the International Affective Digitized Sound [IADS] [1]. The signal has different kind of band levels like Alpha, Beta, Gamma, and Theta. Each band stores the particular information about the emotions, which was shown in Table 1. The following table contains the different band details and its frequency ranges and their location in the brain.
Table 1. EEG- Different Band Levels
|
BAND |
FREQUENCY RANGE |
LOCATION |
|
DELTA |
0-4Hz |
Frontal Lobe |
|
THETA |
4-7Hz |
Midline Temp |
|
ALPHA |
8-13Hz |
Frontal Occipital |
|
MU |
8-12Hz |
Central |
|
BETA |
13-30Hz |
Frontal Central |
|
GAMMA |
30-100Hz |
Based on these bands, the different emotions and related frequency are recorded and classify using different classification method and analysis the accuracy and performance of the particular method. The Overall Structure of the EEG Processing for emotion classification is shown in Fig 3.This following figure explains the overall process of the EEG Signal Analysis and also explains the flow of the steps for emotion classification.
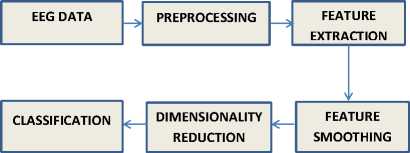
Fig.3. Overall structure
-
III. E EG D ATA A NALYSIS M ETHODS
EEG Signal is an analysis based on three main steps. There is, EEG Preprocessing, Feature Extraction, and Classification of emotions. The Signal preprocessing methods, various feature extraction and classification techniques are shown in fig 4.
-
A. Eeg Preprocessing
Preprocessing is the process of removing the noise from the signal. EEG Signal has recorded over the scalp; it may contain different kind of artifacts, power line, heartbeat, oculars [4]. Those noises are removed from EEG using Surface Laplacian Filtering, Spectral Filtering etc., Band pass filter is used to extract the signal from 4 to 40Hz using Surface Laplacian filtering.
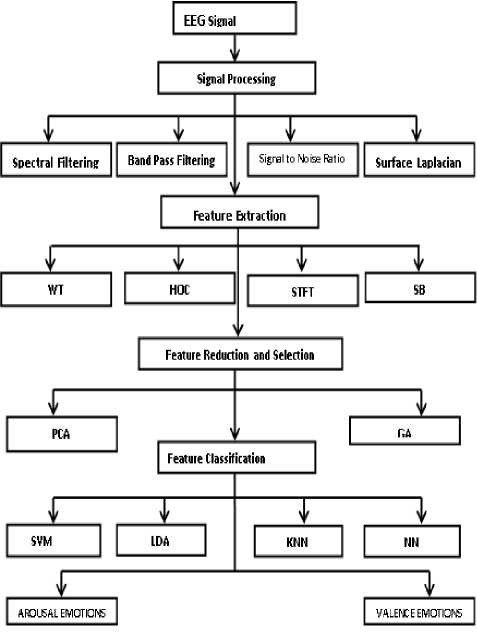
Fig.4. Various Approaches in Emotion Classification-Feature Extraction Methods
fingerprint recognition.
Related Works For Discrete Wavelet Transformation:
DWT includes the time scale signal analysis, signal decomposition and signal compression [6]. Murugaappan et al and Mohan Kumar et al [4,7] paper deals with the Wavelet Transform is the Non- Parametric method of feature extraction based on multi resolution analysis.The time, frequency resolution has obtained by wavelet transform and then wavelet function has to be choosers.

In Xiao-weiwang et al., [5] the wavelet function is chosen based on the time location properties. This function decomposes the signal into different time frequency. Wavelet function is calculating the different shapes of particular time, frequency then that total energy has to be estimated.
E
P = (2)
j E total
Then wavelet entropy has to be calculated, it can be defined as,
-
B. Feature Extraction
Feature extraction is the process of analysis the characteristics of waves and extracts the useful information bearing feature which was used for pattern classification. The main aim of the feature extraction is used to analyze the raw signal [7].There are Several feature extraction techniques like DWT, HOC, PCA, STFT, SB etc.
Discrete Wavelet Transformtion:
DWT is a linear signal processing which is applied to the particular data. The data has the same length, and then apply these techniques to data reduction. It has the following steps...
-
• The Length of L, input vector must power of 2
-
• Apply data smoothing (sum or weighted average)
and perform a weight difference wh ich gives detail feature about particular data
-
• After applying this function the res ulting output is L/2 which has low frequency or high frequency respectively.
-
• These functions applied to the resulting dataset
obtain the length of 2.
-
• Select values from data obtained apply to the
coefficient of transformation.
The DWT can be providing the best result and it was applied for data cleaning, analysis, time series data, and
n
W = £ Pn ln Pj (3)
i = 1
Mohan Kumar et al.,[ 7] Extract wavelet energy coefficient gives a representation of EEG signal in time and frequency. It has decomposed the different level of frequency signals. Table 2 shows that the details of the decomposed signals [8].
Table 2. Frequency corresponding to different level of decomposition
|
FREQUENCY RANGE |
DECOMPOSITION LEVEL |
BAND |
FREQUENCY BAND WIDTH(Hz) |
|
0 -(fs/2J+1) |
A5 |
Theta |
0-4 |
|
(2fs/2J+1) -(3fs/2 J+1) |
D5 |
Delta |
4-8 |
|
(2fs/2J+1) -(4fs/2 J+1) |
D4 |
Alpha |
8-16 |
|
(2fs/2J+1) -(5fs/2 J+1) |
D3 |
Beta |
16-32 |
|
(2fs/2J+1) -(6fs/2 J+1) |
D2 |
Gama |
32-64 |
A5 decomposition is the in the range (0-4) Hz,D5 decomposition is in the range (4-8) Hz,D4 decomposition are in the range (8-12) Hz, D3 decomposition is in the range (12-32) Hz.. Different Level of decomposition and its frequency levels are shown in Table 2. DWT is used to analysis the EEG signal for classification using mathematical steps.[6] wavelet functions can be derived from the dilation equation and also form the wavelet transform coefficient from the matrix with Nonzero elements and each row corresponding to the own dilation Co efficient. It defines the special filter, which can be used for analysis signals. Those filter features are used for classification.
Statstical Based Feature
It was applied to the physiological signal like EEG, MRI,ECG etc.; it has to be following some of the mathematical steps.
-
• Mean of Raw signal
-
• Standard Deviation
-
• Mean of absolute values of the first different raw signal
-
• Mean of the absolute value of second different raw signal
-
• Mean of the absolute value of second standard signal. Based on these steps the exact patterns are extracted from EEG.
Related Works For Statstical Based Features:
Chai Tong Yuen et al., [9, 10] paper deals with that, statistical based features are used to classify the human emotion from EEG signals. Each Statistical features are used to classify different types of emotions. The signals recorded from the EEG is X, then the Nth Sample of signal is X n where N=1024, The Mean of the raw signal is
N
M x = 7 К X . (4)
N n = 1
And also find Standard Deviations,
N 2
^ x К X . - M x ) 2 (5)
V N 1 . = 1 7
And also find the mean absolute values of raw signal, normalized signals. Here few combinations of Statistical Feature Vectors are,
X I = [ a , ^ x ]
X 2 = k , Y x ] (6)
C. Petrantonais [2] paper, Statistical Feature Vector (FV) is used to classify the emotion from the EEG s ignal. FV is calculated by using the mean, standard deviation and etc. The corresponding FV is defined by
I ( X , : X j ) = H ( X ,) - H
' X I
Short Time Fourier Transformation
STFT is a signal processing method used to analyze the non-stationary signals. It is used to determine the sinusoidal frequency and phase content of the local section of a signal as it changes over the time.
Related Works For Short Time Fourier Transformation:
STFT is used to extract from the each electrode sliding window of 512 samples and its overlapping between two consecutive windows. [3] EEG signal features are extracted by STFT and each electrode with sliding window with 512 samples. For each electrode, we have to select the 9 frequency band range from 4 to 22Hz and also find the mutual information between the each electrode which was measured by the statistical dependencies between the different brain areas.
Abdul-Bary Raouf Suleiman et al., [11] the EEG signal is the time domain signal the spectrum can be changed over the time, so that features are extracted using Short Time Fourier Transform which is type of Time frequency Representation.
Principal Component Analysis
PCA is a statistical technique that has used for face recognition, image compression, and it is common techniques for finding patterns in data of huge dimension. It has used some mathematical terminology like mean, standard deviation, variance, co-variance, covariance matrix, matrix algebra, Eigenvector, Eigen value. It has the following steps...
-
• Gather the input data
-
• Calculate mean vector
-
• Computing co-variance Matrix
-
• Find corresponding Eigen Vector and Eigen value.
-
• Ranking and Choosing K Eigenvector and
generate the new feature vector
-
• Transform the samples on the new subspace.
-
• New Data=Row Feature vector*Row Data Adjust
Related For Principal Component Analysis :
Ales Proch Azka et al., [12] paper deals with that, segmenting the EEG multichannel signal and classify the human emotions. Principal Component Analysis is used to reduce the dimensionality of the Matrix using linear algebra.
The Principal Component Matrix P M, M is orthogonal evaluating column matrix is Y N,M with the decreasing variance. Reza khosrowbadi et al [1] paper, Non Negative Principal Component Analysis is used to reduce the dimensionality of the data, because the high dimensional data is difficult to process and identify the human emotions in accurate. This transformation maximizes the variance of the transformed features using the original coordinates.
Independent Component Analysis
M. Ungureanu et al [16] paper deals that, it converts the multivariate signal to signal having component, which are independent. It removes all the noise from the EEG signal and extracts the particular feature which is not related to another. Suppose the signal X (t) assume vector has zero mean then,
-
C. Feature Classification
After Extracting the particular features, the best features have to be selected using optimization method like Genetic Algorithm. The best features are selected, based on this features the emotions are classified into particular group. Classification is the process of grouping the related data into a single group. The classification may be Supervised or Unsupervised Classification. There are several classification methods like, NN, SVM, K-NN, and LDA.
Neural Networks
ANN is a biological way of work to store the information in Neurons. Connection and Interconnection between the neurons are used to pass the information from one node to another node. Neurons are called as the Elements. NN has the input layer, hidden layer and output layer. The Basic Neural Network diagram is shown in Fig 5. It has following features, Computer Based Learning, Ability to arrange nodes itself, Real Time Processing, Ability to withstand in failure. Neural networks are used to find the pattern to analysis the particular emotion. There are three types of learning from the neural network. Supervised learning there is a target class which is used to find the output exactly we want. Unsupervised Training there is no target class we have to find the output, which is related to the problem. Reinforcement is the combination of both. Based on these NN we have to find a particular pattern for emotion.
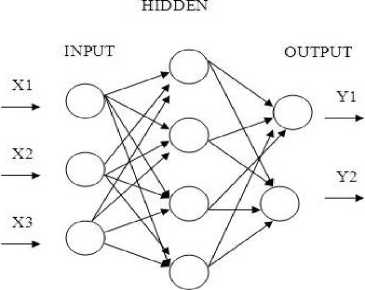
Fig.5. Neural Networks
Related Works For Neural Networks:
Reza khosrowbadi et al., [1] paper deals that emotions are classed using Feed Forward Neural Network. The features are extracted using Connectivity between the one feature into other features. Magnitude square Coherence estimation is applied for computing the connectivity features between the brain signals. After reducing the dimensionality of the features, the best features are used for classification. The Radial Basis Function Network is used to classify the particular emotion. The emotions are classified into Valence and Arousal Level. Seyyed Abed Hosseini et al., [13] paper tells that classify the emotions using two layers Back propagation network, which gives the feedback between the hidden layer and the input layer. Sigmoid Functional is used for the activation function. Levenberg-Marquardt back propagation algorithm is used for training the network. Based on these, emotions are classified. Chai Tong Yuen et al., [9] the emotions are classified using the back propagation neural network. The features are selected using the statistical features, these features are applied to the NN and the classification results are analysed using 60 data.
Support Vector Machine
SVM is used for classifying both linear and non-linear data. It uses a non-linear mapping to transform the original training data into higher dimension. The new dimension, it searches the linear optimal hyper plane that is decision boundary. It is used; separate the one class from another one. The SVM finds the hyper plane using support vectors and margin. The basic SVM is shown in fig 6.The following figure explains the SVM classifier which has the margin between the two classes.
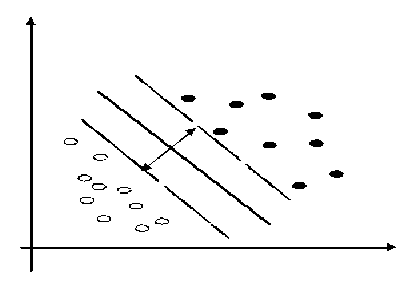
Fig.6. Small Margin using SVM
Related Works For Support Vector Machine:
-
C. Petrantonais [2] paper deals that, SVM Classifier used a polynomial function and Kernel Function that reflects the high dimensional feature space.
K (FVs, FVq )=(FVSv , FVq+1)” (8)
By using the SVM the different class of emotions is classified. Mohammed Soleymani [3] paper human short term emotions are identified using Support Vector Machine. It has maximum margin classifiers that maximize the distance between the decision surface and the nearest point to this surface and also minimize the error on the training set. It also used for linear and radial basis function to analysis the features and classifies those emotions. Ali S. AlMejrad [15] the emotions are classified by using SVM. The Extracted features are input to the SVM for emotion analysis; here they need not reduce the dimensionality of the features. The extracted features separated by linear classifier.
K-Nearest Neighbor
Nearest-neighbor classifiers are based on learning by comparing test tuple with training tuples that are similar to it. When a tuple is not familiar, then k -nearest-neighbor classifier searches the pattern space for the k training tuples that are closest to the unknown tuple. These k training tuples are the k “nearest neighbors” of the unfamiliar tuple. The closeness is defined by using Euclidean distance. Sample K-NN is shown in fig 7. Following figure explains the different tuples are grouped by using the K-NN classifier.
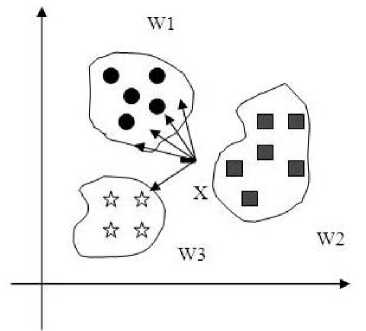
Fig.7. K-Nearest Neighbor
The Euclidean space between two points or tuples, say, X 1 = ( x 11, x 12... x 1 n ) and X 2 = ( x 21, x 22... x2 n ), is
Dist(Xi,X2)=j£(Xi, -X2,)2 (9)
Related Works For K-Nn
Mohammed Soleymani [3] paper recognizes the emotions from EEG using Higher Order Crossing. The Feature Vectors (FV) is the input to the K-NN. In the D-Space, the nearest neighbors are defined by using the Euclidean Distance by equ 15. It follows two steps, 1. Define the training set of FV and 2. For a given query of FV’s then find the nearest of FV. And then it comes under the particular majority of the class. Murugappan et al., [4] in this paper emotion are classified using K-NN. It is a simple and intuitive method for classifying images and signal. The training sample is compared with the testing data, the closest or nearest emotion related features are identified and majority vote related features are grouped into the particular same class.
Linear Discriminant Analysis
LDA methods used in statistics, recognition of pattern and regularities in data, artificial intelligence to find a linear combination of features which separates two or more classes of objects. It is similar to regression analysis. The main concept of searching for a linear combination of variables the best separates two targets. It is extremely fast computation of unknown inputs performed by distance calculation between the new sample data and training data. It is used to find the optimal hyper plane to separate five classes of emotion like happy, sad, fear, surprise, etc. LDA does not require any external parameter to classify the emotions.
Related Works For Lda:
Mohammed Soleymani [3] In this paper deals that, the short term emotions are identified by using discriminate analysis. The emotions are analysis using Linear Discriminate Analysis and Quadratic analysis; both analyses are based on the Bayes Rule, which fined the class with the highest posterior probability P (Wi|f). Murugappan [4] In this paper emotions are classified using DWT features and it has found the fast and extreme evaluation of unknown inputs performed by distance calculation between new sample and mean of training data samples. It is used to find the optimal hyper plane, which separates five different class emotion like happiness, surprise, fear, disgust, and neural. [14] In this paper deals that, how the EEG related emotions are classified using time domain parameter as a feature. To classify the emotion LDA is used because it has high dimensionality of the features which was compared to the number of trails; LDA has found a one dimensionality subspace. In which that class are separated. The ratio of the class variance to within the class variance is maximal.
W = ^- 1(^1 - ^2 ) (10)
Where sample Co variance Matrix µ1 and µ2 are sample Class Mean.
-
IV. S AMPLE R ESULT
In this Section we are explained sample result which was obtained by Independent Component Analysis method is used. The raw input signal is given to the input and preprocesses the data and that signal is analysis based on the component. Those components are separate from the different way. Using the components the different emotions are classified. The sample screen shots are shown in fig 8 and 9. The following figure explains the sample result for component analysis using ICA and classifies the emotions into different groups.

Fig.8. Front page of the tool box
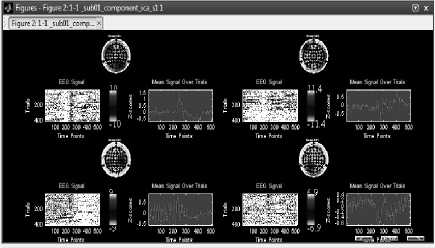
Fig.9. Component analysis and classification
-
V. P ERFORMANCE AND A CCURACY
The emotions are identified by EEG signal with different feature extraction techniques and classification methods. The emotions accuracy may be varied from one extract technique to another. Different extraction techniques that combine with the classification method provide better results. The Table 3 shows that the various accuracy levels of feature extraction and classification methods during the emotion identification process .
Table 3. Accuracy of methods
|
NO |
EXTRACT METHOD |
CLASSIFY METHOD |
ACCURACY |
REF |
|
1 |
DWT |
K-NN |
83.26 |
[4] |
|
2 |
Dynamic and PCA Features |
SVM |
64.7 to 82.91 |
[5] |
|
3 |
WT |
SVM |
82.38 |
[4] |
|
4 |
HOC |
SVM |
82.33 |
[2] |
|
5 |
STFT |
SVM |
80 |
[3] |
|
6 |
HOC |
NN |
80.5 |
[2] |
|
7 |
PCA Features |
RBF |
84.6 |
[1]] |
|
8 |
DWT |
LDA |
75.21 |
[4] |
|
9 |
HOC |
QDA |
62.30 |
[14] |
Fig 10 The accuracy of feature extraction method and classification method
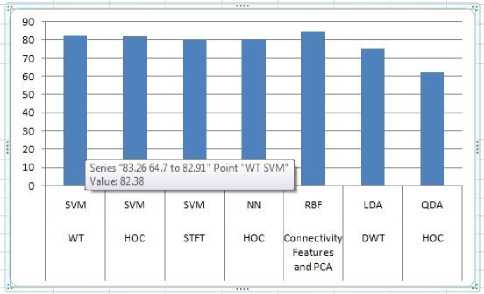
Fig.10. Performance Analysis
-
VI. C ONCLUSION
An Emotion can be identified by extracting the different kind of feature from the signal. For extracting the features from the signal Wavelet Transform will give the highest accuracy, after preprocessing the signal it has to be smoothed and optimized for the particular feature, using different optimization techniques like GA, PSO, etc. After getting the optimized result apply the RBF and SVM it will provide the high accuracy of emotions in any situation. These emotions will used for Human Computer Interaction, Affective Computing and Robotics etc.
A CKNOWLEDGMENT
I extend my sincere thanks and gratitude to my guide and mentor who has helped me all through the way to make out this project. My heartfelt thanks to my family and friends. Of all, my humble prayers to God for making me persuade through this way.
References A Survey On Emotion Classification From Eeg Signal Using Various Techniques and Performance Analysis
- Reza khosrowbadi, Kai Keng Ang, and Abdul Wahab “ERNN: A biologically Feedforward Neural Network to Discriminate Emotion from EEG Signal” IEEE neural network and learning systems. Vol. 25, No 3, Mar-2014
- C. Petrantonais, “Emotion recognition from EEG using higher order” vol. 14, pp-390-396 in 2010 IEEE.
- Mohammed Soleymani, “Short term Emotion assessment in a recall paradigm” in 2009 Elsevier.
- Murugappan, N. Ramachandaran, and Y. Sazali, Mohd “Classification of Human Emotion from EEG discrete wavelet” J. Biomed. SCI. Eng., vol. 3, pp-390-396, Apr-2010
- Xiao-Wei Wang, Dan Nile, “Emotional State Classification from EEG data using machine Learning Approach” in 2013 Elsevier.
- Ales Prochazka and Jaromır Kukal, Oldrich Vysata “Wavelet Transform Using for Feature Extraction and EEG Signal Segments Classification” in IEEE.
- Mr. C. E. Mohan Kumar. Mr. S. V. Dharani Kumar “Wavelet Based Feature Extraction Scheme of Electroencephalogram” in IJIRSET.
- M.Murugappan, M.Rizon, RNagarajan, S. Yaacob, I. Zunaidi, and D. Hazry “EEG Feature Extraction for Classifying Emotions using FCM and FKM in IJCC.
- Chai Tong Yuen , Woo San San1, Mohamed Rizon and Tan Ching Seong “Classification of Human Emotions from EEG Signals using Statistical Features and Neural Network” in IJIE.
- Chai Tong Yuen, Woo San San, Jee-Hou Ho and M. Rizon “ Effectiveness of Statistical Features for Human Emotions Classification using EEG Biosensors´in RJAET.
- Abdul-Bary Raouf Suleiman, Toka Abdul-Hameed Fatehi “features extraction techniqes of eeg signal for bci applications”.
- Ales porch Azka, Martina Mudrov a, Oldˇrich Vysata, Robert H´av, and Carmen Paz Su´arez Araujo “Multi-Channel EEG Signal Segmentation and Feature Extraction”.
- Seyyed Abed Hosseini and Mohammad Bagher Naghibi-Sistani “ Classification of Emotional Stress Using Brain Activity”.
- C. Petrantonais, “Adaptive Emotional Information Retrieval from EEG signals in the Time Frequency Domain” in 2012 IEEE.
- Ali S. AlMejrad. “Human Emotions Detection using Brain Wave Signals: A Challenging”, 2010
- M. Ungureanu, C. Bigan, R. Strungaru, V. Lazarescu,“Independent Component Analysis Applied in Biomedical Signal Processing,” Measurement Science Review, Vol. 4, section 2, 2004
- S. Karpagachelvi, Dr. M.Arthanari, M. Sivakumar, “ECG Feature Extraction Techniques – A Survey Approach,” IJCSIS, vol. 8, no. 1, April 2010.
- Yuan-Pin Lin, Chi-Hong Wang, Tien-Lin Wu, Shyh-Kang Jeng,“Support Vector Machine for EEG signal classification during listening to emotional music,” Multimedia Signal Processing, IEEE 10th Workshop, 2008.
- Ali S. AlMejrad. “Human Emotions Detection using Brain Wave Signals: A Challenging”, 2010.
- Garrett, D., Peterson, D. A., Anderson, C. W., & Thaut, M. H.“Comparison of linear, nonlinear, and feature selection methods for EEG signal classification”. Neural Systems and Rehabilitation Engineering, IEEE Transactions on, 11 (2), 141-144, 2003
- P.C. Petrantonakis and L. J. Hadjileontiadis, “EEG-Based Emotion Recognition Using Hybrid Filtering and Higher Order Crossings”, Proc. 3rd International Conference on Affective Computing and Intelligent Interaction (ACII) and Workshops: IEEE, 2009, pp. 1-6, Amsterdam.
- Marcin Kołodziej, Andrzej Majkowski, Remigiusz J. Rak, Linear discriminant analysis as EEG features reduction technique for brain-computer interfaces, Przegląd Elektrotechniczny (Electrical Review), R. 88 NR 3a/2012.
- E. D. Ubeyli, “Combined Neural Network Model Employing Wavelet Coefficients for EEG Signal Classification”, Digit. Signal. Process, Vol. 19, pp. 297-308, 2009
- Rashima Mahajan, Dipali Bansal, Shweta Singh, “A Real Time Set Up for Retrieval of Emotional States from Human Neural Responses”, Vol 8, No: 3,2011
- Sample result performed by using the ICA tool box.
