A Temporal Reasoning System for Diagnosis and Therapy Planning

Author: Akash Rajak
Journal: International Journal of Information Technology and Computer Science(IJITCS) @ijitcs
Article in issue: 12 Vol. 7, 2015.
Free access
The research is based on the designing of Clinical Temporal Mediator for medical domain. The Clinical Temporal Mediator incorporates the concept of artificial intelligence for performing temporal reasoning tasks. The designing of reasoning system involves the implementation of various mathematical models of insulin-glucose metabolism. The reasoning system consists of three subsystems: Nuti-Diet subsystem, Insulin-Glucose subsystem and Therapy Planner and Diagnosis subsystem. The paper discusses about the designing of TPD subsystems. The temporal mediator perform diagnosis on patient's time oriented database and also suggest therapy planning for diabetes mellitus patient.
Artificial intelligence, temporal mediator, temporal reasoning, temporal maintenance, diabetes mellitus
Short address: https://sciup.org/15012408
IDR: 15012408
Text of the scientific article A Temporal Reasoning System for Diagnosis and Therapy Planning
Published Online November 2015 in MECS DOI: 10.5815/ijitcs.2015.12.03
The Clinical Temporal Mediator (CTM) integrates the tasks of temporal reasoning and temporal maintenance. The tasks of temporal reasoning and temporal maintenance are performed by CTM reasoning system and CTM maintenance system respectively [1,2,3,4,5]. The CTM reasoning system consists of three subsystems: ND (Nutri-Diet), IG (Insulin-Glucose) and TPD (Therapy and Diagnosis). The ND defines various states (meal and exercise) for achieving open-loop insulin delivery. The IG implements the states by utilizing various models of IG metabolism (adapted from [15,17,10]). The interval based temporal abstraction (temporal patterns) obtained from IG is passed to the Therapy Planner and Diagnosis (TPD) subsystem. The temporal reasoning is based on the blood glucose episodes encountered during the 24hrs of blood glucose cycle. The TPD subsystem performs the diagnosis if the blood glucose concentration shows an unexpected behavior. The behavior is based on various bands range. Depending on the diagnosis the subsystem also plans the therapy based on meal intakes, insulin injections and physical exercises. By adopting the new therapy the patient may refashion his/her blood glucose profile to normoglycemia level. The 24hrs blood glucose profile of patients can be modeled as set of blood glucose temporal patterns.
-
II. Temporal Reasoning System
The Clinical Temporal Mediator (CTM) integrates the tasks of temporal reasoning and temporal maintenance. The CTM is designed for medical domain to model the blood glucose profile of the type-1 diabetic mellitus (T1DM) patient. The reasoning system of CTM consists of three subsystems: (i) ND subsystem, (ii) IG subsystem and (iii) Therapy Planner and Diagnosis (TPD) subsystem. The IG subsystem serves as the main function of CTM reasoning system. The subsystem exhibits the behavior of blood glucose and insulin in blood plasma. The design is based on open-loop insulin delivery strategy [13]. The outputs obtained from ND subsystem can be provided as inputs to IG subsystem. The various inputs provided to IG subsystem are net carbohydrate (CHO) intake, quantity of insulin induced exogenously and intensity of physical exercise along with patient’s weight. Each of these inputs (clinical events) is associated with some various time-points along the 24hrs of time axis. Apart from these clinical events other inputs provided to the subsystem are physical examination of patient (weight, gender and age) and quantitative parameters (fasting blood glucose value). The subsystem forecasts the blood glucose concentration and the effect of carbohydrates (CHO) on blood glucose profile of a patient having T1DM. Further the subsystem does predict temporal patterns by adopting a time series based temporal mining. The temporal patterns are based on various bands. In our model the safety band corresponds to normoglycemia range between 72 to 180^. If the blood glucose level crosses the minimum value (72 ~“ ) it will fall in lower band, while if it exceeds the maximum range (180 ^) it will fall in upper band. The blood glucose values falling under lower or upper bands represent the unconscious state of patient, while within safety band represents the normoglycemia range. The blood glucose curve crossing the barriers of safety band would depicts the unexpected behavior of blood glucose profile. To maintain the profile within the safety band the patient may modify dietary plan, quantity of insulin injection and exercise plan [6,7,8].
-
III. TPD Subsystem of Reasoning System
The temporal patterns are diagnosed by TPD subsystem in terms of blood glucose episodes. These episodes can be classified into two categories:
-
a) Hyperglycemia or Hyper episodes
-
b) Hypoglycemia or Hypo episodes
The temporal patterns related to hyperglycemia episode are occurred due to high blood glucose level and falls in upper band range (above 180 ^ ), while hypoglycemia episodes is due to low blood glucose level and falls in lower band range (below 72^). Based on the diagnosis the TPD subsystem also plan a therapy for the patient, if the blood glucose level crossed the barriers of safety band range (72-180^).
The Figure 1 demonstrates the architecture of TPD subsystem. The IG subsystem provides an interface to TPD subsystem. By adopting the models of IG metabolism [16,14,11] the IG subsystem forecasts the blood glucose concentration in form of temporal patters. These temporal patterns are passed to TPD subsystem for diagnosis. After successful diagnosis, the subsystem plans the therapy. The therapy will be based on three ways:
-
a) Modifying dietary intake
-
b) Manipulating insulin delivery
-
c) Adopting new exercise plan
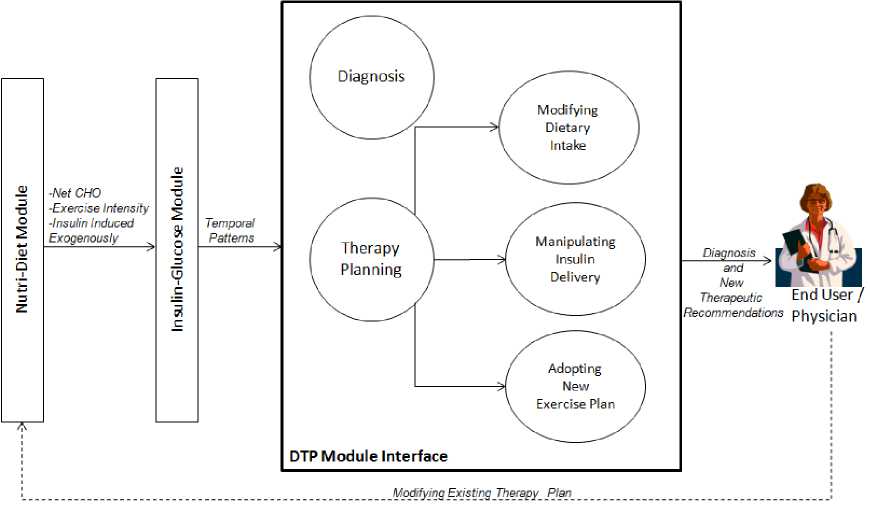
Fig. 1. The architecture of TPD subsystem.
IV. Diagnosis and Therapy Plan Cycle
The diagnosis and therapy plan cycle can be viewed as illustrated in Figure 2. The data related to diabetic patient has been collected and stored in temporal database. The temporal data consists of patient’s history, physical examination (age, weight and gender), laboratory tests, schedule of dietary intakes, insulin regimen and exercise schedule [9]. All these data values are collected on some time-points or time-intervals. This data can be processed into useful information, which helps in decision making. The decision making process helps in diagnosis or assessment regarding the blood glucose profile of the patient. After successful diagnosis the system plans for the therapy. Based on therapy planning the patient or physician can project the blood glucose concentration by making use of CTM, if still there is deviation from normal blood glucose values, the system recommends a new therapy. This cycle continues until normoglycemia range of blood glucose levels is achieved.
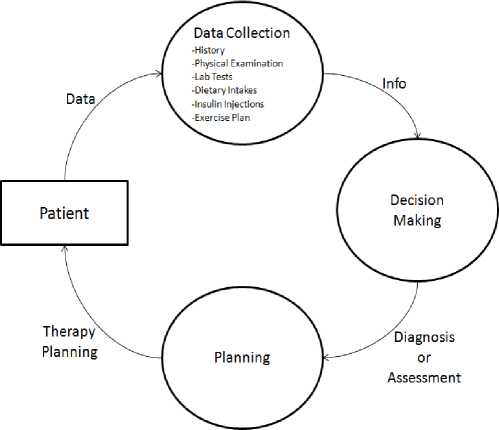
Fig. 2. Diagnosis and therapy plan cycle of the CTM, performing the tasks of data collection, decision making and planning related to the patient suffering from type 1 diabetes mellitus.
-
V. Temporal Reasoning Task
Shahar et al. [22,23,24,25,26] defined diagnosis as a temporal reasoning task that explains a set of findings and symptoms. The TPD subsystem of CTM reasoning system performs the task of diagnosis on the patients having type 1 diabetes mellitus (T1DM).
-
A. Diagnosis
The IG subsystem projects the blood glucose concentration of the patient by utilizing various models of IG metabolism [27,28,29] and abstracts the information in form of temporal patterns.
-
B. Blood Glucose Episodes
The temporal patterns are evaluated by TPD subsystem for performing the task of diagnosis. Each temporal pattern may fall either in three bands range. These temporal patterns are evaluated in terms of various blood glucose episodes by the TPD subsystem. The blood glucose episodes crossing the normoglycemia range (72-180 —”) of blood glucose level corresponds to unexpected trend in the time series and hence to be diagnosed. If the blood glucose level is below 72— then hypoglycemia (hypo) episode is triggered, else if it crosses beyond 180— hyperglycemia (hyper) episode is determined. A severely very high blood glucose level (hyper episode) may results to heart or kidney failure and very low blood glucose (hypo episode) may leads to unconscious state of the patient which results to coma.
-
C. Visualization of Time Oriented Medical Data
The TPD subsystem also abstracts the blood glucose episodes in form of graphical patterns (Figure 3). By visualizing this graph one can easily predict the timeinterval at which the blood glucoses episodes are encountered. The graph is plotted against the lower and upper bands range, to predict the unexpected behavior of blood glucose values. The different colors of the curve demonstrate the blood glucose values during various meal states (Breakfast, Snack-1, Lunch, Snack-2, Dinner and Snack-3). The basal glucose value represents the fasting blood glucose value (80—).
Algo. 1. The Algorithm illustrates the various functions performed by subsystems of CTM reasoning system. The Step 1 corresponds to ND subsystem which defines the various states. The Steps 2 to 3 includes the functions of IG subsystem relates to implementation of various states. The Steps 4 to 6 are the part of TPD subsystem related to the task of diagnosis (discussed in Algorithm 2).
Step 1: Accept inputs from the various states related to CHO intakes, exogenous insulin delivery and intensity of physical exercise and other clinical parameters (basal blood glucose level, weight and gender).
Step 2: Forecast the blood glucose concentration of the patient along the 24 hours of time axis.
Step 3: Abstracts the temporal patterns of all the six meal states.
Step 4: For each temporal pattern, scan the entire meal state for blood glucose (BG) values.
Step 5: If the value of BG is less that 72 it will corresponds to hypo episode, while if the value is more that ISO it will corresponds to hyper episode.
Step 6: Initialize temporal pattern with the next meal state and goto Step 4. (if meal state is empty then Exit.)
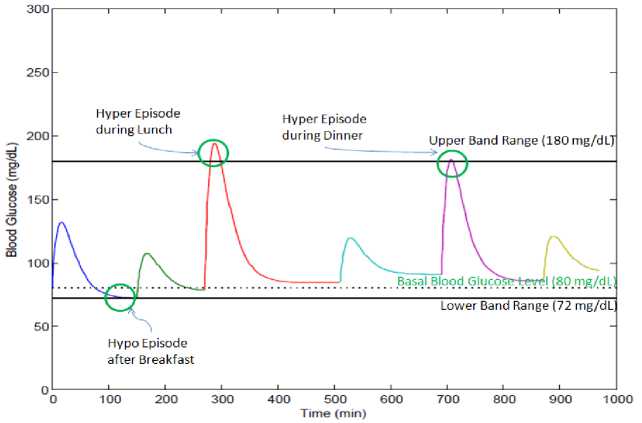
Fig. 3. The different color of the curve shows the blood glucose concentration at different meal states. The black dotted line shows the basal or fasting blood glucose level.
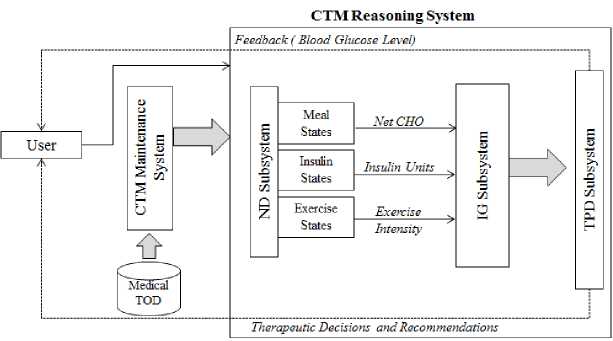
Fig. 4. Clinical temporal mediator.
After successful diagnosis, the TPD subsystem suggests a therapy based on meal intake, insulin injection and exercise for achieving normoglycemia level. This therapy acts as feedback to ND subsystem (Figure 4) and based on these therapeutic recommendations the patient blood glucose profile is redefined.
Algo. 2. The Algorithm illustrates the task of diagnosis performed by TPD subsystem. The tpattern (temporal patterns) are the value of BGvalue collected over a meal state (Breakfast, Snacks-1, Lunch, Snacks-2, Dinner and Snacks-3). The algorithm scans each temporal pattern for BGvalues to check for blood glucose episodes until all the tpatterns are scanned. While scanning each tpattern the algorithm check for blood glucose episodes. The hypo episodes correspond to low BG value, while hyper episode denotes high BG value.
Step 1: [Initialize tpattern to initial meal state. The initial and final meal states are Breakfast and Snacks-3.] set tpattern := meal state.
Step 2: Repeat Steps 3 to 7 while tpattern * null.
Step 3: [Initialize blood glucose value with initial value.] set BGvalue := initial.
Step 4: Repeat Steps 5 to 6 while BGvalue * final.
Step 5: ztBGvalue > 180, then:
write: DIAGNOSIS: Hyperglycemia Episode during tpattern, if BGvalue < 72, then: write: DIAGNOSIS: Hypoglycemia Episode during tpattern.
Step 6: [Assign the blood glucose value with next value.]
set BGvalue := next [BGvalue].
[End of Step 4 loop,]
Step 7: [Assign tpattern with next state,] set tpattern := next [tpattern], [End of Step 2 loop.]
Step 8: Return.
Algo. 3. The Algorithm illustrates the task of therapy planning performed by TPD subsystem. The TPD subsystem scans tpatterns (temporal patterns) associated with each meal state for BG episodes. If subsystem suggests therapy for the meal state associated with BG episodes. The therapy is based on meal intake, insulin regimen and physical exercise.
Step 1: [Initialize tpattern to initial meal state. The initial and final meal states are Breakfast and Snacks-3.]
Set tpattern := meal_state.
Step 2: Repeat Steps 3 to 12 while tpattern * null.
Step 3: [Initialize blood glucose value with initial value.] set BGvalue := initial.
Step 4: Repeat Steps 5 to 11 while BGvalue * final.
Step 5: if BGvalue > 180 дм? tpattern := Breakfast, then:
Write: THERAPY: Decrease Breakfast Intake.
write: THERAPY: Increase Dose of Breakfast Insulin.
write: THERAPY: Adopt a New Physical Exercise.
if BGvalue < 72 am? tpattern := Breakfast, then: write: THERAPY: Increase Breakfast Intake. write: THERAPY: Decrease Dose of Breakfast Insulin. Write: THERAPY: Adopt Different Exercise or Reduce the Intensity of Existing Exercise.
Step 6: if BGvalue > 180 AND tpattern := Snacks-1, then: write: THERAPY: Decrease Snacks-1 Intake.
if BGvalue < 72 and tpattern := Snacks-1, then:
write: THERAPY: Increase Snacks-1 Intake.
Step 7: if BGvalue > 180 am? tpattern := Lunch, then:
write: THERAPY: Decrease Lunch Intake.
write: THERAPY: Increase Dose of Lunch Insulin.
if BGvalue < 72 AM? tpattern := Lunch, then: write: THERAPY: Increase Lunch Intake. Write: THERAPY: Decrease Dose of Lunch Insulin.
Step 8: if BGvalue > 180 AM? tpattern :=Snacks-2, then:
Write: THERAPY: Decrease Snacks-2 Intake.
write: THERAPY: Adopt a New Physical Exercise.
if BGvalue < 72 am? tpattern := Snacks-2, then:
write : THERAPY: Increase Snacks-2Intake.
write: THERAPY: Adopt Different Exercise or Reduce the Intensity of Existing Exercise.
Step 9: if BGvalue > 180 am? tpattern := Dinner, then;
write: THERAPY: Decrease Dinner Intake.
write: THERAPY: Increase Dose of Dinner Insulin.
if BGvalue < 72 AM? tpattern : = Dinner, then :
write: THERAPY: Increase Dinner Intake.
Write: THERAPY: Decrease Dose of Dinner Insulin.
Step 10: if BGvalue > 180 AND tpattern := Snacks-3, then; Write: THERAPY: Decrease Snacks-3 Intake. Write; THERAPY: Increase Dose of Snacks-3 Insulin.
else if BGvalue < 72 andtpattern := Snacks-3, then; Write: THERAPY: IncreaseSnacks-3 Intake. write: THERAPY: Decrease Dose of Snacks-3 Insulin.
Step 11: [Assign the blood glucose value with next value.] Set BGvalue := next [BGvalue], [End of Step 4 loop.]
Step 12: [Assign tpattern with next state.] Set tpattern := next [tpattern], [End of Step 2 loop.]
Step 13: Return.
-
VI. Therapy Planning
When the patient’s blood glucose profile is simulated the TPD subsystem performs the task of diagnosis, if the value of blood glucose concentration crosses the range of safety band (72-180^) the subsystem suggests therapy for the patient.
The TPD subsystem performs the tasks of therapy planning in three ways:
-
A. Modifying dietary intake
-
B. Manipulating insulin delivery
-
C. Adopting new exercise plan
-
A. Modifying Dietary Intake
The diabetic patient has to take a calculated diet as suggested by the physician for regulating the blood glucose level. If the patient takes excess of food it may lead to hyperglycemia state. There should be a proper management of diet if it consists of too many carbohydrates. While eating carbohydrates, glycemic load (GL) and glycemic index (GI) should be kept in mind.
The TPD subsystem suggests the therapy based on dietary intake in two ways:
If hyperglycemia episode is encountered, the subsystem suggests for reducing the dietary intake, as the hyper episode is occurred due to rise in the blood glucose level.
For hypoglycemia episode, the subsystem suggests to increase the dietary intake.
From Figure 3 the hyper episodes occurred during Lunch and Breakfast is resolved by reducing the dietary intake, while the hypo episode occurred after Breakfast can be resolved by increasing the dietary intake.
Apart from modifying dietary intake, the patient may also manipulate the insulin regimen for having a tighter control of blood glucose level.
-
B. Manipulating Insulin Delivery
An unacceptable rise or lowering in the blood glucose level can be controlled through quantity of insulin delivered. If excess insulin is induced in the body of patient, it results in lowering of blood glucose level below the lower band range (<72 ^) and leads to unconscious state which results to coma. The amount of insulin delivered depends on the type of insulin adopted and the percentage rise in the blood glucose level. The various types of insulin available in market are rapid acting, short acting, intermediate acting and long acting.
The TPD subsystem suggests the therapy based on insulin in two ways:
For hyperglycemia episode, the subsystem suggests to increase the dose of insulin.
For hypoglycemia episode, the subsystem suggests to decrease the dose of insulin.
By adopting therapeutic guidelines, based on type and quantity of insulin the patient may forecast the blood glucose profile.
-
C. Adopting New Exercise Plan
-
VII. Implementation
The Figure 4 illustrates the interface of “Clinical Temporal Mediator” (CTM). It is programmed in MATLAB R2008b version 7.7.0.471. A diabetic patient profile is simulated to project the blood glucose values. The CTM accepts various inputs at different time stamps. The inputs are meal intakes (during Breakfast, Snacks-1, Lunch, Snack-2, Dinner and Snack-3), fasting blood glucose value (basal value), quantity of insulin injections (during Breakfast, Lunch and Dinner) and exercises intensity. The fasting blood glucose value is calculated before meal intake (or 180 minutes after meal) and it found to be 80—. This value acts as basal value and is dL
utilized by IG subsystem to forecast blood glucose concentration. When the profile is simulated the CTM performs the tasks of diagnosis in the form of blood glucose episodes. The various blood glucose episodes encountered during 24hrs of patients profile is given in Figure 3.
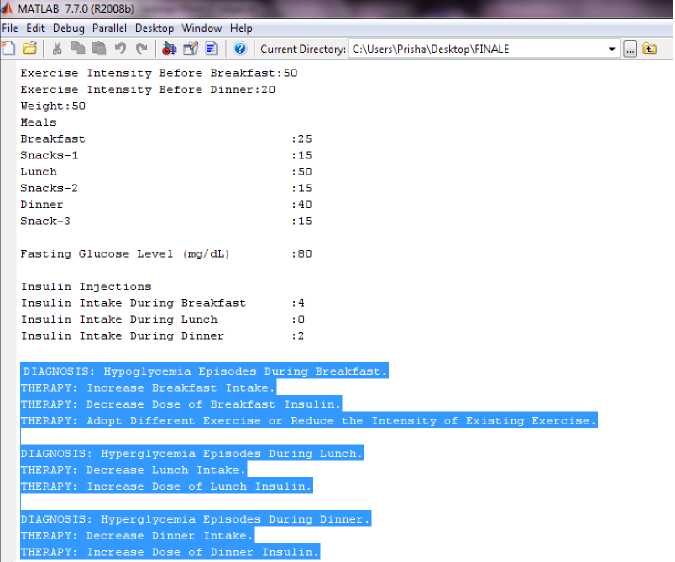
Fig. 5. Snapshot of CTM reasoning system.
From the Figure 3, the blood glucose profile of the patient has three episodes. One episode is for hypoglycemia (hypo) and remaining two are of hyperglycemia (hyper). Hyper episodes are occurred during Lunch and Dinner, while hypo is during Breakfast. The hypo episode during Breakfast is due to higher intensity of exercise. The hyper episode during Lunch is due to excess meal intake and no exogenous insulin infusion. The hyper episode during Dinner is due to excess meal intake and low insulin infusion. These blood glucose episodes are diagnosed by TPD subsystem and possible therapy has been suggested (Figure 5).
-
VIII. Conclusions
The TPD subsystem of CTM reasoning system successfully performs diagnosis of the patient having type 1 diabetes mellitus. The temporal patterns of blood glucoses concentrations are evaluated by TPD subsystem for performing the task of diagnosis. The temporal patterns are evaluated in terms of blood glucose episodes. Two blood glucose episodes are defined one is hyper and another is hypo, which corresponds to rise in blood glucose level above the upper band range (>180^) and another represents the lowering in blood glucose level below the lower band range (<72^) respectively.
After successfully diagnosis the subsystem also plans therapy for the patient. The recommendations are passed to the physician or end-user. The TPD subsystem plans the new therapy in three ways: modifying dietary intake, manipulating insulin delivery and adopting new exercise plan. The patient may adopt the new therapy plan for maintaining the normoglycemia level of the blood glucose concentration (72-180^).
The therapy based on dietary intake would accounts for either reducing or increasing the dietary intakes at various time-intervals, so as to reduce the possibility of hyper or hypo blood glucose episodes. In case of insulin based therapy the TPD subsystem may suggest a new insulin regimen based on new insulin injections and/or quantity of insulin doses. In exercise based therapy the patient may choose a new exercise for reducing the chances of hyperglycemia blood glucose episodes. The TPD subsystem gives the complete visualization of time oriented medical data of the diabetic patient, which can be easily interpreted by the end user or a physician.
References A Temporal Reasoning System for Diagnosis and Therapy Planning
- A. Rajak, and K. Saxena, “Modeling the effect of Meal on Blood Glucose Concentration using Clinical Temporal Mediator,” in Proceedings of IEEE 2013 International Conference on Machine Intelligence Research and Advancement, pp. 208-212, 21-23 Dec. 2013.
- A. Rajak, and K. Saxena, "Temporal reasoning with time oriented medical database using models based on IG metabolism," International Journal of Computer Science and Information Technology & Security, vol. 1(2), pp. 66–70, Dec. 2011.
- A.Rajak, and K. Saxena,"Achieving Open-loop Insulin Delivery using ITM Designed for T1DM Patients", International Journal of Computer Network and Information Security, vol.4, no.1, pp.52-58, Feb. 2012.
- A.Rajak, and K. Saxena, “Modeling Clinical Database using Time Series Based Temporal Mining,” International Journal of Computer Theory and Engineering (ISSN: 1793-821), Vol. 2, No. 2, pp. 185-188, April 2010.
- A.Rajak, and K. Saxena, “Achieving Realistic and Interactive Clinical Simulation Using Case Based TheraSim’s Therapy Engine Dynamically,” National Conference on Advance Pattern Mining and Multimedia Cmputing, National Institute of Technology, Trichy, pp. 624-628, Feb. 2010.
- A.Rajak, and K. Saxena, “Modeling temporal databases-A Survey,” International Journal of Computer and Electronics Engineering (ISSN: 0975-4202), Vol. 1, No. 1, pp. 77-82, June 2009.
- A.Rajak, and K. Saxena, “Research issues related to temporal mediators based on clinical domain,” International Journal of Recent Trends in Engineering (ISSN: 1797-9617), Vol. 1, No. 1, pp. 535-540, May 2009.
- A.Rajak, and K. Saxena, “Temporal abstraction database mediators based on clinical guidelines,” in Proceedings of IEEE International Advance Computing Conference (ISBN: 978-981-08-2465-5), Patiala, India, pp. 2274-2279, March 6-7, 2009.
- A.Rajak, and K. Saxena, “Managing temporal databases,” in Proceedings of International Conference on Managing Next Generation Software Applications (ISBN: 978-81-907870-0-0, Shri Garuda Publications, Coimbatore), Coimbatore, India, pp. 107-114, December 5-6, 2008.
- A. Roy, “Dynamic modeling of free fatty acid, glucose, and insulin during rest and exercise in insulin dependent diabetes mellitus patients,” Doctoral Dissertation, University of Pittsburgh, Ph.D., 2008.
- A. Roy, and R. S. Parker, “Mixed meal modeling and disturbance rejection in type 1 diabetes patients,” in Proc. of the Annual International Conference of the IEEE Engineering in Medicine and Biology Society, New York, pp. 323–326, 2006.
- A. Roy, and R. S. Parker, “Dynamic modeling of free fatty acid, glucose, and insulin: An extended minimal model,” Diabetes Technology & Therapeutics, vol. 8(6), pp. 617–626, Dec. 2006.
- E. D. Lehman, “Preliminary experience with the internet release of AIDA- An interactive educational diabetes simulator,” Computer Methods and Programs in Biomedicine, vol. 32, pp. 311–318, 1995.
- M. E. Fisher, “A semi-closed loop algorithm for the control of blood glucose levels in diabetes,” IEEE Transactions on Biomedical Engineering, vol. 38, pp. 57–61, 1991.
- R. N. Bergman. Minimal Models for Glucose and Insulin Kinetics. [Online]. Available: http://www.civilized.com/mlabexamples/glucose.htmld/
- R. N. Bergman, G. M. Steil, A. Volund, and S. E. Kahn, “Reduced sample number for calculation of insulin sensitivity and glucose effectiveness from the minimal model,” Diabetes, vol. 42, pp. 250–256, 1993.
- R. N. Bergman, and G. Pacini, “MINMOD: A computer program to calculate insulin sensitivity and pancreatic responsivity from the frequently sampled intravenous glucose tolerance test,” Computer Methods and Programs in Biomedicine, vol. 23, pp. 113–122, 1986.
- R. N. Bergman, G. Toffolo, D. T. Finegood, C. R. Bowden, and C. Cobelli, “Quantitative estimation of beta cell sensitivity to glucose in the intact organism-A minimal model of insulin kinetics in the dog,” Diabetes, vol. 29, pp. 979–990, 1980.
- R. N. Bergman, L. S. Phillips, and C. Cobelli, “Physiological evaluation of factors controlling glucose tolerance in man,” Journal of Clinical Investigation, vol. 68, pp. 1456–1467, 1981.
- R. N. Bergman, M. F. Saad, R. L. Anderson, A. Laws, R. M. Watanabe, W. W. Kades, Y. D. I. Chen, R. E. Sands, D. Pei, and P. J. Savage, “A comparison between the minimal model and the glucose clamp in the assessment of insulin sensitivity across the spectrum of glucose tolerance,” Diabetes, vol. 43, pp. 1114–21, 1994.
- R. N. Bergman, Y. Z. Ider, C. R. Bowden, and C. Cobelli, “Quantitative estimation of insulin sensitivity,” American Journal of Physiology, vol. 236, pp. E667–77, 1979.
- Y. Shahar, and C. Combi, “Temporal reasoning and temporal data maintenance in medicine: Issues and challenges,” Computers in Biology and Medicine, Elsevier, vol. 27(5), pp.353–368, 1997.
- Y. Shahar, “A knowledge-based method for temporal abstraction of clinical data,” Ph.D. dissertation, Program in Medical Information Sciences, Stanford University School of Medicine, 1994, Knowledge Systems Laboratory Report No. KSL-94–64, 1994, Department of Computer Science report No. STAN-CSTR-94-1529, Stanford University, Stanford, CA, 1994.
- Y. Shahar, and D. Boaz, “Idan: A distributed temporal- abstraction mediator for medical databases,” in Proc. of the 9th Conference on Artificial Intelligence in Medicine- Europe (AIME), Protaras, Cyprus, 2003.
- Y. Shahar, and M. A. Musen, “RéSUMé: A temporal-abstraction system for patient monitoring,” Computers and Biomedical Research, vol. 26(3), pp. 255–273, 1993.
- Y. Shahar, S. W. Tu, J. H. Nguyen, A. K. Das, and M. A. Musen, “Integration of temporal reasoning and temporal-data maintenance into a reusable database mediator to answer abstract, time-oriented queries: The tzolkin system,” Journal of Intelligent Information Systems, Vol. 13(1/2), pp. 121–145, 1999.
- Y. Shahar, and C. Combi, “Temporal reasoning and temporal data maintenance in medicine: Issues and challenges,” Computers in Biology and Medicine, Elsevier, vol. 27(5), pp.353–368, 1997.
- Y. Shahar, “Dimensions of time in illness: An objective view,” Annals of Internal Medicine, vol. 132(1), pp. 45–53, 2000.
- Y. Shahar, “Time is everything: Temporal reasoning and temporal data maintenance in medicine,” AIMDM, pp. 30–46, 1999.
