A Tool for Diabetes Prediction and Monitoring Using Data Mining Technique

Author: S. R. Priyanka Shetty, Sujata Joshi
Journal: International Journal of Information Technology and Computer Science(IJITCS) @ijitcs
Article in issue: 11 Vol. 8, 2016.
Free access
Data mining is the process of analyzing different aspects of data and aggregating it into useful information. Classification is a data mining task generally used in medical data mining. The goal here is to discover new and useful patterns to provide meaningful and useful information for the users about the diabetes. Here a diabetes prediction and monitoring system is designed and implemented using ID3 classification algorithm. The symptoms causing diabetes are identified and are applied to the prediction model based on which the prediction is done. The monitoring module analyzes the laboratory test reports of the blood sugar levels of the patient and provides proper awareness messages to the patient through mail and bar chart.
Data mining, Classification, Decision tree, ID3, Diabetes dataset, Prediction
Short address: https://sciup.org/15012586
IDR: 15012586
Text of the scientific article A Tool for Diabetes Prediction and Monitoring Using Data Mining Technique
Published Online November 2016 in MECS DOI: 10.5815/ijitcs.2016.11.04
-
A. Data mining
Data mining is the process of extracting hidden knowledge from large volumes of raw data. It is the analytical process designed to explore data in search of consistent patterns and find systematic relationships between variables. The application areas of data mining are in field of education system, market basket analysis, customer relationship management, banking application, sports and in Health care system.
In recent years medical data mining has become prominent, since there is enormous amount of medical data available which can be used for discovering useful patterns. The data mining techniques such as classification, clustering, association, outlier analysis help in finding useful patters from the huge amount of medical data.
Data mining has great potential for the healthcare industry since it helps health systems to use medical data for analysis and to offer improved healthcare at reduced cost. The data mining techniques when applied to health care play a significant role in prediction and diagnosis of various health problems like heart disease, diabetes, cancer, skin disease and many more.
-
B. Classification
Data mining includes classification as one of the fundamental task. Classification is used to predict the group membership of data instance. Classification is applied in areas such as weather prediction, medical diagnosing, scientific experiments etc.
The classification technique is generally used in medical data mining. The classification techniques generally used are Decision trees, Bayesian classifier, Random Forest, Random tree, classification by back-propagation and rule based classifiers. Classification is performed in two steps:
Model construction: In this step the prediction model is built using appropriate algorithm.
Model Usage: In this step the prediction model is applied to actual data and prediction is done accordingly.
-
C. Decision Tree
Decision tree is a commonly used technique in data mining which is used for classification. The decision tree classifier is built in a top-down manner with root node and involves partitioning the data into subsets that contains instance with similar values.
The decision analysis helps to visualize and explicitly represent decisions and the classification tree helps in decision making. This algorithm creates a model that predicts the value of a target variables based on several input variables.
The decision tree applications in the real-world are found in field of medical, agriculture, financial analysis, biometric engineering, plant disease and software development. The commonly used algorithms using Decision tree are ID3, C4.5 and CART.
The decision tree algorithm is used widely as it is simple to understand and it can handle both numeric and categorical data. It is robust as well and performs well with large dataset.
-
D. Diabetes
Diabetes mellitus (DM) is a chronic disease, in which the person has high blood sugar levels. It affects the ability of body to use the energy found in food for life long. Once the body absorbs simple sugar (sucrose) it usually converts them into glucose and it will act as main source fuel for the body. The glucose usually transports through bloodstreams and is taken up by cells.
There are three types of Diabetes. They are:
-
• Type1 - Here the pancreas does not produce required amount of insulin and hence the glucose level in blood is above normal range. People suffering from this type are usually dependent on external insulin.
-
• Type2 –Here the cells of the body fail to use the insulin produced because of insulin resistance.
-
• Gestational diabetes – This occurs when pregnant women who do not have the diabetes history will be found diabetic with high blood sugar level.
Presently 1.5 to 4.9 million deaths are occurring every year because of diabetes and it may increase to 500 billion till 2030. So it is better to know the state of the disease based upon the symptoms and follow the required measures to keep the blood sugar level in control. Here a tool is developed with the help of data mining technique, which predicts the person as diabetic or non diabetic. It also helps diabetic patients to monitor their blood sugar levels.
-
II. Related Work
-
[1] Presents the study to apply different data mining techniques in the healthcare application by using different tools on different types of disease that are commonly seen in many people. The algorithms and techniques play important role in diagnosing and predicting the disease in healthcare field. The mining techniques applied to the health data are classification, clustering, association rule mining and Naïve Bayes. After applying these methods on different kinds of disease it was found the accuracy around 97.77% for cancer prediction.
-
[2] The study includes the characteristics of diabetes and to find the number of people suffering from diabetes. This process is performed by considering the diabetic population of 249 instance and 7 unique attributes. The dataset of 249 instances are applied to WEKA tool and performed on algorithms such as Bayes network classifier, J48 Pruned tree, REP tree and Random forest. This survey was done to create awareness about the increasing population of diabetes among people all over the world and helps in knowing the status of the disease.
-
[3] Presents the study that includes different data mining algorithms applied on diabetes data set, it also included the data mining measures/ fitness criteria such as: sensitivity, specificity, accuracy, positive precision, negative precision and error rate. This all were performed to find out the best prediction measure for diabetes to classify tested positive or tested negative. The measure calculation is performed based on the confusion matrix that include “true positive, true negative, false positive and false negative”.
-
[4] The awareness tool is created for diabetic foot problem which is often seen in diabetic patients. The model is built by using the ontology model, which includes the 4
main modules like: patient, support, report and results. The support includes the advice, action and reminder activities. The report includes the foot observations, fife style factors, medical test and symptoms. Based upon the foot observation the results like: immediate action or symptom advice or foot reminders are sent to the patients. This tool is helpful in raising the awareness of dangers developed as diabetic foot in diabetes patients.
-
[5] The Diabetes Early Warning System considers the non laboratory data set of diabetic and non diabetic patients. The data includes the attributes such as age, gender, height, weight and family history. Found achieving the accuracy of 90% on hyper tension patients and 85% on diabetic patients. Also found out the number of people under risk were 75%. The algorithms used for this analysis are AdaBoost and C4.5. It was helpful in predicting of diabetes in new patients.
-
[6] The Temporal reasoning system consists of three subsystems: Nutria-Diet subsystem, Insulin-Glucose subsystem and Therapy Planner and Diagnosis subsystem. Artificial intelligence is used for temporal reasoning task. This system helps to plan the therapy for the diabetic patients based on the diagnosis performed on patient earlier, which is extracted from the database.
-
[7] Fuzzy logic is used to improve the prediction rate of the diabetes. Based on the knowledge of patient’s diagnosis and experience, the system will predict the diabetes. The crisp data is converted to fuzzy data, then by using the IF-THEN rule the fuzzy input is converted to fuzzy output. The decision making algorithms are used to perform the required operation and Defuzzification helps to get the crisp set from fuzzy set.
-
III. System Architecture
System design is the process of defining system architecture, modules and interfaces for the proposed system to satisfy specified requirements.
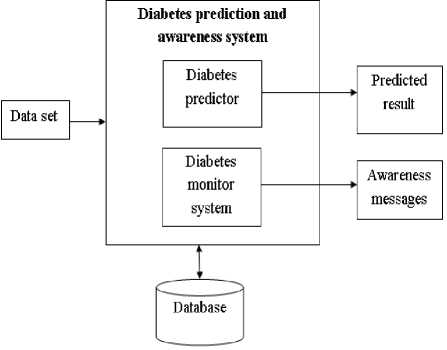
Fig.1. System Architecture.
The System architecture is shown in the Fig 1. The Diabetes Data set is given as input to the Diabetes prediction and awareness system. The Diabetes predictor helps in prediction of diabetes based on the symptoms provided. The Diabetes monitor system helps in monitoring the blood sugar level and provides the awareness message based on the sugar level.
The standard blood sugar levels are shown in Table 1 in which indicate the category of diabetes. Based upon the category, in proposed system the necessary awareness message are provided to the users.
Table 1. Blood sugar level chart
|
Blood sugar chart |
|||
|
Category |
Fasting Value (mg/dl) |
Post Prandial (mg/dl) |
|
|
Minimum Value |
Maximum Value |
Value 2 hours after consuming meal |
|
|
Normal |
70 |
100 |
Less than 140 |
|
Early Diabetes |
101 |
125 |
141 to 200 |
|
Established Diabetes |
More than 126 |
- |
More than 200 |
The awareness message is sent to the user through mail for knowing their health status. The bar chart includes the five times checkup details of fasting and post prandial blood sugar level, which helps in keeping track of his health status.
-
IV. Methodology
-
A. ID3 (Iterative Dichotomiser 3)
The ID3 algorithm is used to generate decision tree from the data set. It is mostly used in machine learning domain. It accepts only categorical attributes for building the model.
Algorithm: Iterative Dichotomiser 3
This algorithm begins by taking the training dataset as input. The entropy and information gain is calculated for all attributes of training dataset. The attributes are ranked based on the information gain. Splitting attribute is chosen based on the minimum entropy or maximum information gain from the ranked attributes to form subset of training data. This action is performed iteratively until no attribute remains other than the attributes selected before.
//Algorithm
//Input: Training dataset D and associated class label, Attribute_list: symptoms list
//Output: Predicted result
//Method:
Establish Classification Attribute.
If the attribute_list is empty then, return value with the majority class label in dataset D.
for all unused attribute in D calculate entropy
H(S) = -Z xex P(x)log 2 P(x) (1)
for all unused attributes in D calculate information gain
IG(A,S) = H(S)-^ teT P(t)H(t) (2)
for each attribute i ^ 0 to n-1 do
//for finding splitting factor
return Gx; // x is the splitting attribute.
Entropy
Entropy H(D) is the measure of amount of uncertainty in the data set D
H(D) = — Z yeY P(y)log 2 P(y) (3)
Where,
D - Data set
Y - set of classes in data D
p(y) – is proportion of the number of elements in class y to the number of elements in data D
If H(D)=0 then the data set D is perfectly classified this happens when the elements of class are all same.
Information Gain
Information gain GA(X, D) is the difference of entropy for set D, after split is performed on the attribute X.
GA(X, D)=H(D)-Z teT P(s)H(s) (4)
Where,
H(D) - entropy of set D,
H(s) - entropy of subset s
S - the subsets obtained from splitting set D by attribute X such that D = U ses' 5
p(s) – is proportion of the number of elements in s to the number of elements in set D.
-
B. Dataset
Table 2. Attributes
|
Sl no. |
Attribute |
Attribute description |
|
1 |
Age |
Age in years |
|
2 |
Weight |
Weight in Kg’s |
|
3 |
Physical activity |
Physical activity in minutes |
|
4 |
Urination |
Number of times urination in a day |
|
5 |
Water consumption |
Water consumption in liters |
|
6 |
Diet |
Number of times food consumed in a day |
|
7 |
Systolic blood pressure |
Enter value of blood pressure in “mmHg” |
|
8 |
Hyper tension |
Person with hyper tension{Y/N} |
|
9 |
Tiredness |
Feel tiredness{Y/N} |
|
10 |
Blurred vision |
Have blurred vision{Y/N} |
|
11 |
Wound healing |
Number of days wound starts to dry{Y/N} |
|
12 |
Sleepy/drowsy |
Always feel sleepy/drowsy{Y/N} |
|
13 |
Sudden weight loss |
Observed sudden weight loss{Y/N} |
|
14 |
Heredity |
Elders found with diabetes{Y/N} |
|
15 |
Class |
Diabetic{Y/N} |
The diabetes dataset is obtained from following laboratories
-
• Srinivas diagnostic laboratory, Gayatripuram 1st stage, Mysuru.
-
• Balaji Diagnostic laboratory, Hospet.
-
• Annapurna multi-speciality hospital, Gangavathi
-
• Rotaract club of NMIT, Bangalore.
The dataset includes 150 records and 14 attributes with one class attribute. The attributes and their description is shown in Table 2.
-
❖ Steps of ID3 algorithm
Step 1: Establish Classification Attribute. //shown in table 5.1
Step 2: Provide training data to the classification algorithm
Step 3: Compute Classification Entropy for all unused attributes in the training data.
Step 4: For each attribute in table, calculate Information Gain using classification attribute.
Step 5: Chooses attribute with the minimum entropy or with maximum information gain finding the splitting factor.
Step 6: Repeat steps 4 until all attributes have been used, or the same classification value remains for all rows in the reduced table.
Step 7: Classification rule is generated after finding the splitting factors for all the attributes of training data.
Step 8: For the test data, based upon the classification rule generated the new data gets classified. The predicted result is classified as Diabetic or Nob- Diabetic.
The attribute ranking evaluates the worth of an attribute by measuring the information gain ratio with respect to the class. The ranked attributes are shown in the below Table 3.
-
B. Correctly classified and In-correctly classified instances
Table 4. Correctly classified and In-correctly classified instances
|
Algorithm |
Correctly classified |
In-correctly classified |
|
ID3 |
94% |
6% |
The above Table 4 shows the correctly classified and incorrectly classified instances for the diabetes dataset of 150 records. The correctly classified instance is 94% and incorrectly classified is 6% for ID3 algorithm.
The below Fig. 2 shows the graph for correctly and incorrectly classified instance percentage obtained for ID3 algorithm.
ID3 Algorithm
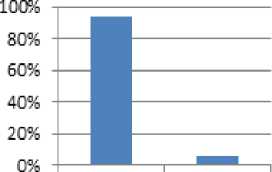
Correctly In-correctly classified classified
Classified instances
-
V. Analysis
A. Ranking of attributes for diabetes dataset
Table 3. Ranking Attributes
|
Attribute rank |
Attribute nominal |
Attributes |
|
0.12461 |
4 |
Frequent urination |
|
0.09377 |
13 |
Sudden weight loss |
|
0.0608 |
9 |
tiredness |
|
0.05298 |
14 |
heredity |
|
0.05175 |
12 |
sleepy |
|
0.03631 |
11 |
Wound healing |
|
0.02311 |
8 |
Hyper tension |
|
0.02252 |
7 |
Blood pressure |
|
0.01999 |
5 |
Excessive thirst |
|
0.01874 |
1 |
Age |
|
0.01264 |
2 |
Weight |
|
0.00559 |
10 |
Blurred vision |
|
0.00511 |
6 |
Diet |
|
0.0025 |
3 |
Physical activity |
Fig.2. Graph for classified instances.
-
C. Confusion matrix
The confusion matrix is also called as contingency table. It helps to visualize the performance of the algorithm. The columns in the matrix represent the instance of predicted class and the row represents the instance of actual class.
Table 5. Confusion Matrix
|
Confusion matrix |
Positive |
Negative |
|
True |
78 |
2 |
|
False |
7 |
63 |
Table 5 is the confusion matrix, which includes the true positive(TP), true negative(TN), false positive(FP) and false negative(FN) values. These values are used for calculation of evaluation measures .
-
D. Evaluation measures
Following are the evaluation measures for ID3 algorithm.
Table 6. Evaluation Measures
|
Measures |
Description |
ID3 algorithm |
|
Sensitivity |
True positive rate, the percentage of people correctly classified as diabetic. TP Sensitivity = TP+FN |
55% |
|
Specificity |
True negative rate, the percentage of people correctly classified as not having diabetes. TN Specificity = FP+TN |
22% |
|
Accuracy |
The fraction of properly predicted cases. TP+FN Accuracy = TP+FP+TN+FN |
94% |
|
Error rate |
The fraction of miss classified cases. FP+FN Error rate = TP+FP+TN+FN |
6% |
The Table 6 shows the list of evaluation measures. These measures help to find the accuracy of the ID3 algorithm for dataset used. The results obtained as sensitivity with 55%, specificity with 22%, accuracy with 94% and error rate with 6%. The Fig.3 shows the graph obtained for the evaluation measures calculated for ID3 algorithm.
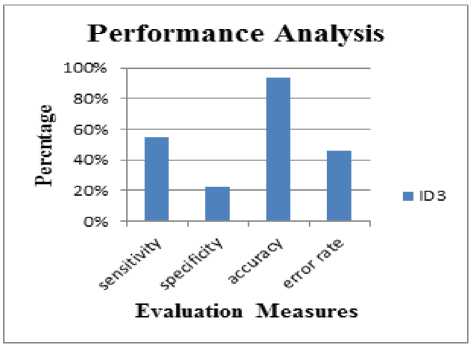
Fig.3. Graph for evaluation measures
-
VI. Results
Fig. 4 shows the admin login page. After valid login the admin can view the user database and can access user database for any modifications required.
Fig 5 shows the user login page, where valid login details must be provided. After login the user can go for a health checkup or can view their own profile and can make modification if necessary. Sign-out is provided to end their session.
In Fig 6, the Diabetes predictor includes the list of symptoms, by which prediction can be performed. The Diabetes monitor include the fasting and post prandial blood sugar level list, by which user can keep track of his health.
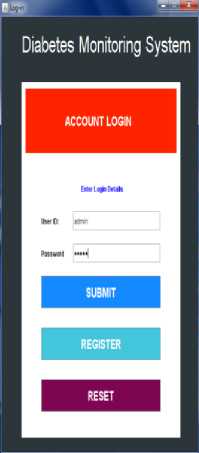
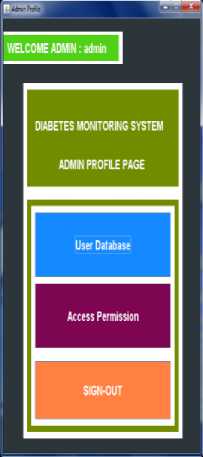
Fig.4. Admin login and permissions to database
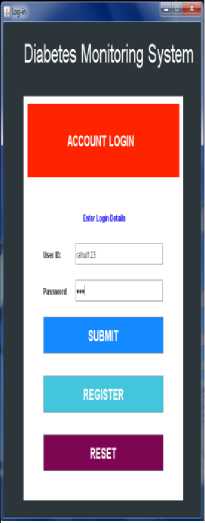
Fig.5. User Login Page and Health Checkup options
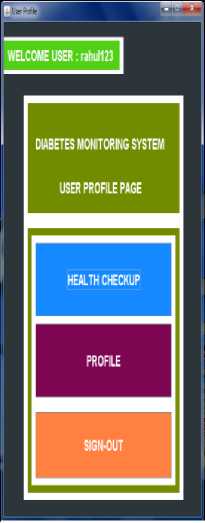
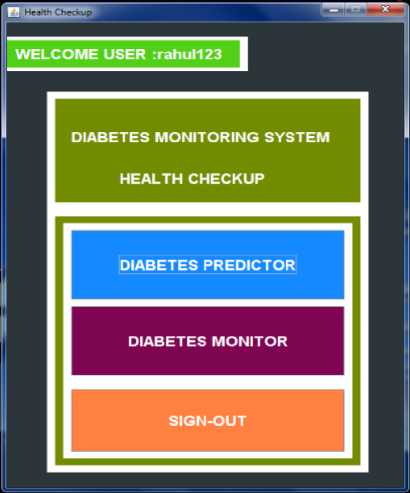
Fig.6. Health Checkup ModuleUHealth Checkup
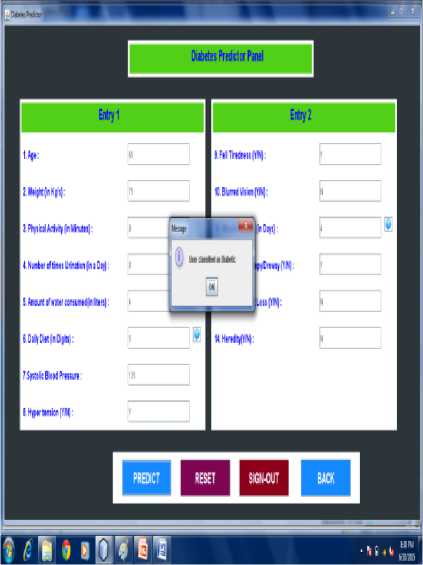
Fig.7. Predicted as diabetic
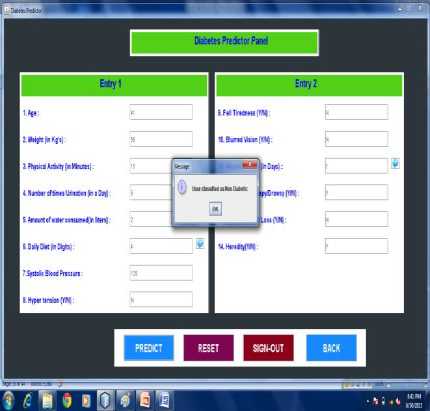
Fig.8. Predicted as non-diabetic
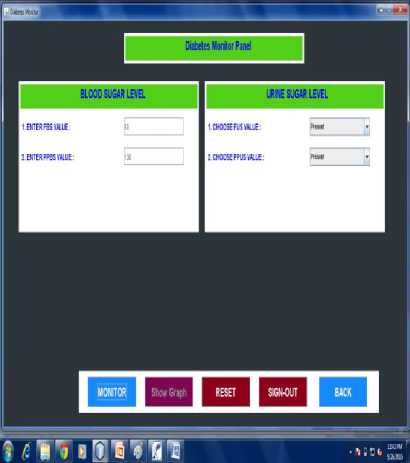
Fig.9. Diabetes Monitor panel
Fig 7 and Fig 8 shows the diabetes predictor panel. The major common symptoms that cause diabetes are listed in a form. The user must enter the details properly and click on predict button for performing the prediction process.
The input given by the user is the test data and input is passed to the classification rule. For the given test data the classified result is provided as diabetic or non diabetic.
Fig 9 shows the diabetes monitor panel. Here the user must provide the details of laboratory test details of FBS, PPBS, FUS and PPUS. These are the fasting and post prandial blood (mg/dl) sugar level and urine sugar level.
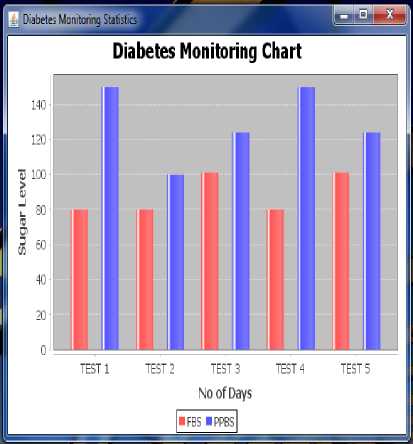
Fig.10. Diabetes monitoring chart
Fig 10 shows the history of blood sugar level for last 5 tests, which will help the user to keep track of the health status and follow the proper diet to maintain his/her blood sugar level.
-
VII. Conclusion
The diabetes prediction and awareness system is developed and implemented using classification based data mining algorithm. It helps the user to know whether they are diabetic or non-diabetic. It also raises awareness among the user and helps to keep track of their health status. The bar chart shows the details of the previous five blood sugar levels, which helps the user to maintain their sugar levels.
References A Tool for Diabetes Prediction and Monitoring Using Data Mining Technique
- M. Durairaj, V. Ranjani, “Data Mining Applications In Healthcare Sector: A Study”, International journal of scientific & technology research volume 2, issue 10, October 2013, ISSN 2277-8616.
- P.Yasodha, M. Kannan, “Analysis of a Population of Diabetic Patients Databases in WEKA Tool”, International Journal of Scientific & Engineering Research Volume 2, Issue 5, May-2011, ISSN 2229-5518.
- Rashedur M. Rahman, Farhana Afroz, “Comparison of Various Classification Techniques Using Different Data Mining Tools for Diabetes Diagnosis”, Journal of Software Engineering and Applications, 2013, 6, 85-97
- D.Lavanya, K.Usha Rani, “Performance Evaluation of Decision Tree Classifiers on Medical Datasets”, International Journal of Computer Applications, July 2011 (0975 – 8887) Volume 26– No.4.
- K. R. Lakshmi, S.Prem Kumar, “Utilization of Data Mining Techniques for Prediction of Diabetes Disease Survivability”, International Journal of Scientific & Engineering Research, Volume 4, Issue 6, June-2013, 933 ISSN 2229-5518.
- Akash Rajak, “A Temporal Reasoning System for Diagnosis and Therapy Planning”, I.J. Information Technology and Computer Science, 2015, 12, 23-29 Published Online November 2015 in MECS (http://www.mecs-press.org/) DOI:10.5815/ijitcs.2015.12.03
- Vaishali Jain , Supriya Raheja “Improving the Prediction Rate of Diabetes using Fuzzy Expert System” I.J. Information Technology and Computer Science, 2015, 10, 84-91 Published Online September 2015 in MECS
- Nida Chammas, Radmila Juric, Nigel Koay, Varadraj Gurupur, Sang C. Suh, “Towards a Software Tool for Raising Awareness of Diabetic Foot in Diabetic Patients”, 46th Hawaii International Conference on System Sciences, 2013, 1530-1605.
- Nouf Almutairi, Riyad Alshammari, “Diabetes Early Warning System”, College of Public of Health and Health Informatics.
- Diabetes Dataset: Srinivasa diagnostic laboratory, Gayatripuram 1st stage, Mysuru, Balaji Diagnostic laboratory, Hospet, Annapurna multi-speciality hospital, Gangavathi, Rotaract club of NMIT, Bangalore.
- Alberti KG, Zimmet PZ. Definition, diagnosis and classification of diabetes mellitus and its complications. Part 1: diagnosis and classification of diabetes mellitus. Provisional report of a WHO consultation. Diabet Med. 1998; 13:539–553.
- http://knowledgetablet.blogspot.in/2011/12/blood-sugarblood-glucose-tests-rbs-fbs.html.
- http://www.merckmanuals.com/home/hormonal-and-metabolic-disorders/diabetes-mellitus-dm/diabetes-mellitus
- Mwangi MW, Githinji GG, Githinji FW. Knowledge and awareness of diabetic retinopathy amongst diabetic patients in kenyatta national hospital, kenya. International Journal of Humanities and Social Science. 2011; 13(21):140–146.
- World Health Organization. Diabetes Programme. Country and Regional Data on Diabetes. WHO African Region; 2012.Available from: http://www.who.int/diabetes/facts/ world_figures/en/ (accessed 13 Feb 2013)
- Mafomekong Ayuk Foma, Yauba Saidu,corresponding, Semeeh Akinwale Omoleke, and James Jafali "Awareness of diabetes mellitus among diabetic patients in the Gambia: a strong case for health education and promotion", BMC Public Health. 2013; 13: 1124. Published online 2013 Dec 5.
- Danquah I, Bedu-Addo G, Terpe K-J, Micah F, Amoako Y, Awuku Y, Dietz E, van der Giet M, Spranger J, Mockenhaupt F. Diabetes mellitus type 2 in urban Ghana: characteristics and associated factors. BMC Public Health. 2012; 13(1):210. doi: 10.1186/1471-2458-12-210.
