A Transfer Learning–Enhanced Hybrid Deep Learning Framework for Bitcoin Price Forecasting Using Market Sentiment and Time Series Data

Author: Rachid Bourday, Issam Aattouchi, Mounir Ait Kerroum
Journal: International Journal of Information Engineering and Electronic Business @ijieeb
Article in issue: 5 vol.17, 2025.
Free access
The extreme volatility of Bitcoin markets makes accurate price prediction notably difficult. This paper proposes a new hybrid deep learning model that incorporates a Gated Recurrent Unit (GRU), a Bidirectional Long Short-Term Memory (Bi LSTM) model, and a Multi Head Attention mechanism to permit the model to utilize both historical price data and sentiment information from Twitter. We constructed the model utilizing a two-stage transfer learning approach: we first pretrained the model on data from 2017−2019 to learn lower-level fluctuation behaviors, then we fine-tuned the model on data from 2021−2023 in order to be sensitive to recent market behaviors. The model performed exceptionally well against multiple state-of-the-art baselines using root mean square error (RMSE) and mean absolute error (MAE) metrics, reporting RMSE values of 679.61 and MAE of 452.95, achieving considerable improvement over the baseline models. Our experimental results show that leveraging Twitter sentiment greatly improved trend prediction. In addition, our benchmarks showed that our method performed better than the existing methods. Furthermore, our ablation studies illustrated how each particular feature performed. Overall, our results demonstrate that multi-scale temporal modeling combined with social media sentiment integration produces a scalable and resilient solution to combat the challenges of volatility to forecast cryptocurrency prices accurately and efficiently.
Bitcoin Price Prediction, Hybrid Deep Learning, Transfer Learning, GRU, Bi-LSTM, Multi-Head Attention, Sentiment Analysis, Time-Series Forecasting
Short address: https://sciup.org/15019944
IDR: 15019944 | DOI: 10.5815/ijieeb.2025.05.01
Text of the scientific article A Transfer Learning–Enhanced Hybrid Deep Learning Framework for Bitcoin Price Forecasting Using Market Sentiment and Time Series Data
Published Online on October 8, 2025 by MECS Press
Bitcoin, an early decentralized alternative currency, does not operate through a central financial authority or individual customization. Bitcoin emerged in 2009 and became complicated after the roller coaster spiking in 2017, signaling either just a novelty item and or a true replacement of the economic system we were accustomed to. Bitcoin has been extremely volatile; volatility draws the attention of economists and investment companies wanting to determine price changes based on movement relative to other traditional asset classes on the market. A good price prediction is useful for existing and future investors as well as state policymakers to gain an understanding and possibly to lead to control of this new market [1]. There is currently an alternative economy, primarily built in a technological environment similar to the American economy and the world, which will continue to offer alternative developments of financial systems with further digitization and cryptographic technologies.
These technologies demonstrated to be deteriorating for economic models and potentially providing promise for an alternative economy. The alternative economy is expected to be worth $23 trillion, or approximately 25% of all economic activity, by 2025. The alternative economy has many forms; we need to understand the importance of market behavior and forecasting [2].
Initially, cryptocurrency fee prediction trusted classical statistical approaches, together with the Generalized Autoregressive Conditional Heteroskedasticity (GARCH) [3] and Autoregressive Integrated Moving Average (ARIMA) [4]. However, those techniques, broadly speaking, become aware of linear styles and count on generally disbursed variables situations that not often preserve authentic in risky, non-Gaussian cryptocurrency markets [5]. Machine studying methodologies cope with those barriers with the aid of taking pictures of nonlinear relationships inside big datasets without strict assumptions approximately underlying statistics distributions. Nevertheless, conventional system studying algorithms like Support Vector Regression (SVR), Regression Tree (RT), and Bayesian Regularization Neural Networks (BRNN) [6,7] frequently be afflicted by drawbacks together with overfitting and trouble leveraging high-degree latent styles found in sequential statistics. To triumph over those challenges, current research has followed deep study primarily based on totally prediction models, always demonstrating advanced overall performance in comparison to conventional system studying techniques [8,9]. Deep learning approaches, which do not have the strong assumptions of stationarity, and have greater generalization ability, have shown their promises when using supervised learning for predicting financial time series. Systems based on Gated Recurrent Units (GRUs) or Long Short-Term Memory (LSTMs) without and with attention frameworks, can learn temporal dependencies in time-series data through GRU and LSTM systems and their ability to learn with gradient based optimization. All of these learning capabilities led to modelling complicated financial sequences, and accurate prediction [10]. In response to the identified limitations, this study proposes a composite deep learning architecture that combines historical price data and sentiment analysis to better predict Bitcoin prices. The framework consists of three neural network components: Gated Recurrent Unit (GRU) to capture short-term patterns, Bidirectional Long Short-Term Memory (Bi-LSTM) network to examine both past and future patterns, and Multi-Head Attention mechanism to detect relevant features in the volatile market.
The major contributions in this paper are described as follows:
• Novel Hybrid Deep Learning Approach: We propose a novel hybrid architecture with Gated Recurrent Units (GRU), Bidirectional Long Short-Term Memory (Bi-LSTM) and Multi-Head Attention functionalities. This approach leverages time series trends along with sentiment-informed effects to enable robust predictions of Bitcoin’s nontraditional price trajectories. By extracting short-term dependencies, bidirectional patterns, and relevant features hierarchically, this model represents a dynamic approach for volatile cryptocurrency markets.
• Dual-Phase Transfer Learning for Temporal Flexibility: This approach is a novel transfer learning approach that integrates initial training on historical data (2017-2020) with a fine-tune on the new datasets (2021 and later). This is relevant so as to minimize overfitting to past trends while supporting the flexibility needed to adapt to incoming updates and continuously improve prediction accuracy in a rapidly shifting economic landscape.
2. Related Work
This paper is structured as follows: Section 2 reviews related work on cryptocurrency price prediction. Section 3 outlines the proposed methodology. Section 4 describes the implementation and testing procedures. Section 5 provides the ablation study. Section 6 discusses the limitations and future work. Finally, Section 7 concludes the paper.
Predictions of the price of Bitcoin has become an increasingly popular research phenomenon in the past several years since bitcoin is volatile and has an impact on global economic markets. Several approaches have been employed by researchers, ranging from traditional statistical models to machine learning and deep learning approaches to analyze and predict the price fluctuations of Bitcoin. This section surveys the literature and identifies gaps and challenges while considering how this research study adds value to the broader literature. Machine learning and deep learning approaches have been used to predict cryptocurrency prices, with a particular emphasis on Bitcoin. In their study on cryptocurrencies, the authors [11] used logistic regression, support vector machines (SVM) and random forest models to predict bitcoin prices. In their work, logistic regression had the highest accuracy (66%). Their findings were illustrative of the independence of bitcoin returns with respect to other cryptocurrency returns and macro factors.
Authors in [12] conducted a thorough comparison of forecasting methods, including ARIMA, k-nearest neighbors. (kNN), SVR, Random Forest, LSTM, GRU, and Temporal Fusion Transformer (TFT). These authors highlighted the superior performance of LSTM models, and they highlighted their ability to capture temporal dependencies and achieve the lowest root mean square error (RMSE). Similarly, authors in [13] examined deep learning models that included LSTM, GRU, and Bi-Directional LSTM (Bi-LSTM), and they found that Bi-LSTM provided the best forecasts, as it effectively used sequential information going forward and using information from the past. On a related note, authors in [14] presented reinforcement learning models that outperformed traditional models (e.g., ARIMA and neural networks), while also showing more flexibility in volatile market environments. Authors in [15] compared random forest regression and LSTM, and here concluded random forest regression produced better predictive performance, especially with decisive signals such as stock market indices and Ethereum prices. Similarly, authors in [16] confirmed the predictive powers of random forests and bagging methods, identifying technical signals as important predictors of Bitcoin price movements.
Authors in [17] examined the role of information articles in Bitcoin price changes using text mining techniques, namely N-Gram, TF-IDF, Doc2vec, and the more experimental SentiGraph technique. They found that more advanced text sentiment analysis greatly improved forecasting accuracy. Authors in [18] conducted a follow-up study which found that multisource economic sentiment analysis significantly improved the forecasting capabilities of deep learning architecture. In high-frequency trading, there is an author [19] who focused on direct feed-forward neural networks (DFFNNs) trained with a variety of optimization algorithms and concluded that the Levenberg-Marquardt method was the most effective. Authors in [20] proposed a recurrent reinforcement learning solution that effectively modeled market dynamics and yielded substantial trading gains.
Hybrid modeling techniques have also gained prominence. Authors in [21] introduced the VMD-AGRU-RESVMD-LSTM hybrid framework, effectively managing market volatility and surpassing traditional models in forecasting accuracy. Authors in [22] integrated technical indicators with Performer neural networks and BiLSTM, significantly improving predictive accuracy and computational efficiency. Similarly, authors in [23] employed LSTM-Attention mechanisms with gradient-specific optimization, demonstrating reliable forecasting results.
Authors in [24] expanded such work by examining high-frequency Bitcoin and Ethereum price data during the COVID-19 period, confirming LSTM’s resilience under crisis conditions. More recent studies by authors in [25] explored advanced architectures such as Transformers and hybrid models, highlighting their superior ability to model intricate temporal and cross-feature interdependencies compared to conventional methodologies.
Social signals have also been shown to influence cryptocurrency forecasts. Authors in [26] incorporated data from GitHub and Reddit, achieving notable improvements in predictive performance. Authors in [27] introduced ChainNet, which relies on blockchain graph features to significantly enhance forecast accuracy. In parallel, authors in [28] applied BERT classifiers and weak supervision, substantially elevating cryptocurrency return forecasts. Meanwhile, authors in [29] analyzed high-frequency markets through deep learning, demonstrating remarkable predictive accuracy.
Lastly, authors in [30] improved Bitcoin price predictions by leveraging social media sentiment through fine-tuned BERT models, reflecting continuing efforts to advance accuracy and robustness. Collectively, these works illustrate notable strides in cryptocurrency price prediction, rooted in advanced machine learning methods, hybrid models, sentiment analysis, and reinforcement learning. Nevertheless, enduring challenges—such as mitigating data noise, strengthening model robustness, and optimizing computational efficiency persist as critical focal points for future research. The summary of reviewed methodologies is displayed in Table 1.
Table 1. Summary of Reviewed Approaches
|
Reference |
Methods |
Objectives |
Limitations |
|
[11] |
Logistic Regression, SVM, Random Forest |
Predict Bitcoin prices using classical ML techniques |
Limited accuracy (max 66%); ignores temporal dependencies |
|
[12] |
ARIMA, kNN, SVR, RF, LSTM, GRU, TFT |
Compare time-series models for Bitcoin prediction |
Traditional models underperform; high computational cost for TFT |
|
[13] |
LSTM, GRU, Bi-LSTM |
Evaluate deep sequential models |
Limited external data integration; lacks realtime adaptability |
|
[14] |
Reinforcement Learning |
Model volatile market conditions |
Complexity in training; sensitive to reward shaping |
|
[15] |
Random Forest, LSTM |
Compare performance with technical/market signals |
Model performance varies by signal quality |
|
[16] |
Random Forest, Bagging |
Analyze technical signals’ predictive power |
Prone to overfitting; limited interpretability |
|
[17] |
TF-IDF, N-Gram, Doc2Vec, SentiGraph |
Use textual sentiment to enhance predictions |
Model performance varies by text source quality |
|
[18] |
Deep Learning + Multi-source Sentiment |
Integrate diverse economic sentiment data |
Sentiment signals may introduce noise if not filtered |
|
[19] |
DFFNN + Optimization Algorithms |
Optimize network training for high-frequency trading |
Scalability issues; lacks temporal feedback modeling |
|
[20] |
Recurrent Reinforcement Learning |
Forecast trends under dynamic market conditions |
Difficult to generalize across markets |
|
[21] |
VMD-AGRU-RESVMD-LSTM Hybrid |
Address volatility and increase forecast accuracy |
High model complexity: parameter tuning is challenging |
|
[22] |
Performer, Bi-LSTM, Technical Indicators |
Improve prediction and efficiency |
Limited validation in live trading environments |
|
[23] |
LSTM + Attention + Gradient Tuning |
Enhance focus on key signals |
Attention mechanisms can be computationally intensive |
|
[24] |
LSTM on High-Frequency COVID-19 Data |
Assess robustness during crisis |
Lacks transferability to post-crisis market conditions |
|
[25] |
Transformers, Hybrid Models |
Capture deep cross-feature dependencies |
Requires large datasets and high computing power |
|
[26] |
LSTM with GitHub and Reddit Sentiment |
Improve forecasts using developer activity and public sentiment |
Social and activity metrics are contextdependent and may not generalize |
|
[27] |
ChainNet (Blockchain Graph Learning) |
Leverage on-chain graph data |
Requires rich blockchain feature engineering |
|
[28] |
BERT, Weak Supervision |
Improve return predictions using NLP |
Fine-tuning BERT models are resourceintensive |
|
[29] |
Deep Learning on High-Frequency Data |
Maximize predictive accuracy in fast markets |
Sensitive to noise and requires continuous retraining |
|
[30] |
Fine-tuned BERT with social media |
Use social media sentiment for prediction |
Data labeling and interpretation remain challenging |
3. Methodology
This section explains the end-to-end architecture for Bitcoin price prediction, covering data collection, preprocessing, sentiment analysis, and model design. To enhance generalization across varying market regimes, our pipeline includes a two-phase transfer-learning strategy. In Phase 1 (Pretraining), the GRU ^ Multi-Head Attention ^ BiLSTM model is trained on the 2017-2019 dataset to learn stable long-term patterns. In Phase 2 (Fine-tuning), the pretrained model is further trained on the 2021–2023 dataset, allowing it to adapt efficiently to recent market dynamics without retraining from scratch. The overall workflow is illustrated in Fig. 1:
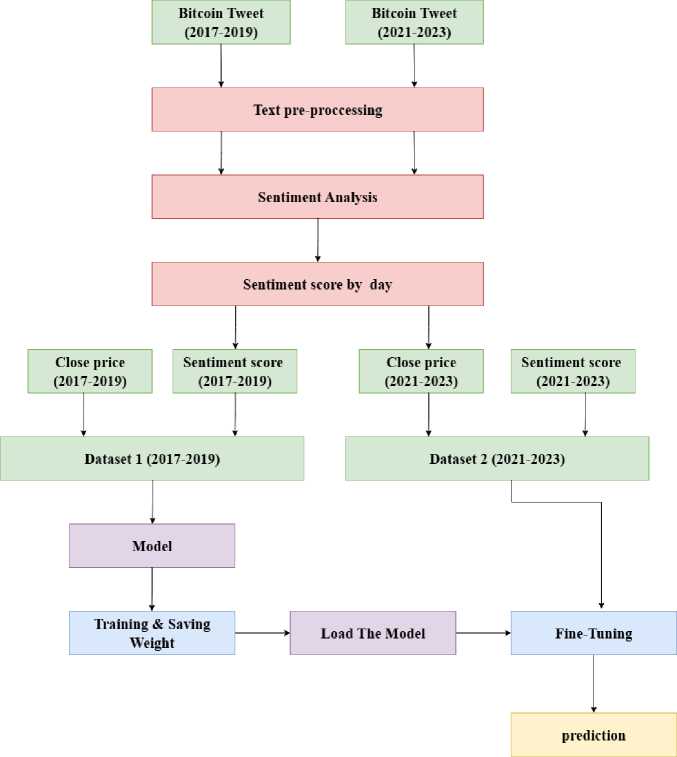
Fig. 1. An overview of the overall workflow of the proposed architecture.
-
3.1 Data Collection
This study used two datasets (spanning 2017–2019 and 2021–2023) to investigate the relationship between Bitcoin price movements and Twitter sentiment. Both datasets were obtained from publicly available Kaggle repositories containing Bitcoin price information and Bitcoin-related tweets. The historical price data set provides daily closing prices, trading volumes, and other key financial metrics, all aligned with the same temporal resolution as the sentiment data. Fig. 2 illustrates daily Bitcoin price trends for the 2021–2023 period.
For sentiment analysis, a pre-collected dataset of Bitcoin-related tweets was retrieved from Kaggle, featuring hashtags such as #Bitcoin, #BTCPrice, #Crypto, and #BitcoinNews. More than 20 million tweets were gathered, yielding valuable insights into public sentiment and enabling an exploration of the correlation between social media sentiment and Bitcoin price dynamics. Fig. 3 provides an example of raw tweets from 2023.
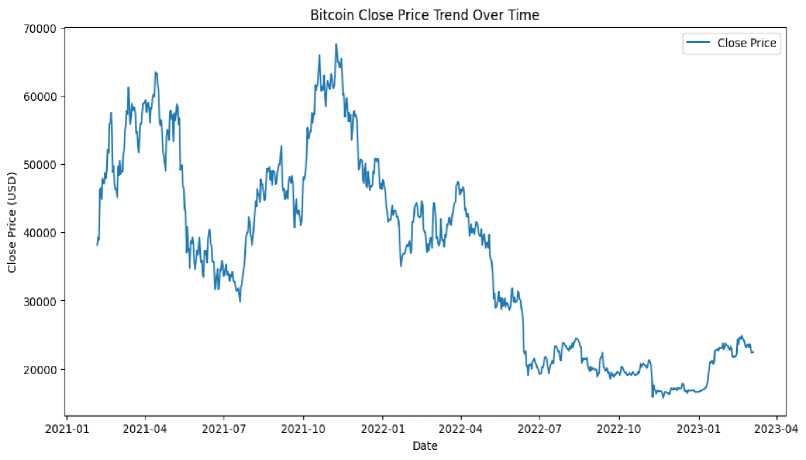
Fig. 2. Bitcoin closing prices recorded over the time period from 5 February2021 to 5 March 2023.
timestamp text
0 2023-03-01 23:59:59
Which #bitcoin books should I think about read...
1 2023-03-01 23:59:47 @ThankGodForBTC I appreciate the message, but...
2 2023-03-01 23:59:42 #Ethereum price update: \n\n#ETH $1664.02 USD\...
3 2023-03-01 23:59:36 CoinDashboard v3.0 is here\nAvailable on ios a...
4 2023-03-01 23:59:32
#Bitcoin Short Term Fractal (4H) ^ \n\nln lower...
Fig. 3. Sample of raw tweets from 2023, illustrating the state of the data before preprocessing.
-
3.2 Feature engineering and data preprocessing
To identify relevant input features for the prediction model, we conducted a Pearson correlation analysis among all available numerical variables in the dataset. The correlation matrix is summarized in Fig. 4. As observed, the Sentiment feature shows a moderate positive correlation with the Close price (0.43), suggesting that public sentiment has a nontrivial relationship with the market’s closing value. While other features such as Open, High, and Low also exhibit very high correlations with Close (above 0.99), these variables are collinear and may introduce redundancy. To minimize overfitting and improve generalizability, we selected Sentiment and Close as the primary features—capturing both external (news sentiment) and internal (price-based) market dynamics. This selection balances predictive strength with unique features. To enhance the quality and usability of the close price and tweet datasets (2017–2019 and 2021–2023), several preprocessing steps were implemented. First, duplicate rows were eliminated using the drop_duplicates method. Next, the datetime function was used to convert the ‘date’ column into a standardized datetime format. The re library was then utilized to remove extraneous hashtags, newline characters, hyperlinks (URLs), alphanumeric text, and mentions from the tweet data. Fig. 5 illustrates examples of cleaned tweets.
Additionally, 20-day and 50-day moving averages for the Bitcoin closing price were calculated to capture short-term fluctuations and illuminate longer-term trends (see Fig. 6 ). This approach provides clearer insights into Bitcoin price movements over time.
|
Correlation Heatmap of Numerical Features |
||||||||||
|
c Ф 1 Ф CD |
1.00 |
0.43 |
0.42 |
0.44 |
0.43 |
0.43 |
-0.21 |
- 1.0 |
||
|
c Ф О |
0.43 |
1.00 |
1.00 |
1.00 |
0.99 |
0.99 |
0.34 |
-0.S |
||
|
if |
0.42 |
1.00 |
1.00 |
1.00 |
1.00 |
1.00 |
0.36 |
-0.6 |
||
|
5 о —1 |
0.44 |
1.00 |
1.00 |
1.00 |
1.00 |
1.00 |
0.31 |
-0.4 |
||
|
ф <0 о О |
0.43 |
0.99 |
1.00 |
1.00 |
1.00 |
1.00 |
0.33 |
-0.2 |
||
|
ф и О О |
0.43 |
099 |
1.00 |
1.00 |
1.00 |
1.00 |
0.33 |
-o.o |
||
|
Ф Е д .о |
-0.21 |
0.34 |
0.36 |
0.31 |
0.33 |
0.33 |
1.00 |
--0.2 |
||
|
Sentiment |
Open |
High |
Low |
Close |
Adj Close |
Volume |
||||
Fig. 4. Correlation matrix displaying the Pearson correlation coefficients between all numerical variables in the dataset from 2021 to 2023.
timestamp
text
CleanTwt
0 2023-03-01 23:59:59
Which #bi1coin books should I think about read...
Which bitcoin books should I think about readi...
1 2023-03-01 23:59:47
@ThankGodForBTC I appreciatethe message, but...
I appreciatethe message, but not afan of the...
2 2023-03-01 23:59:42
#E1hereum price update: \n\n#ETH $1664.02 USD\...
price update: $1664.02 USDbitcoin 0.070428 b...
3 2023-03-01 23:59:36
CoinDashboard v3.0 is here\nAvailable on ios a...
CoinDashboard v3.0 is hereAvailable on ios and...
4 2023-03-01 23:59:32
#Bitcoin Short Term Fractal (4H) $ \n\nln lower...
bitcoin Short Term Fractal (4H) If In lower timef...
Fig. 5. Sample processed and cleaned tweets after applying preprocessing techniques.
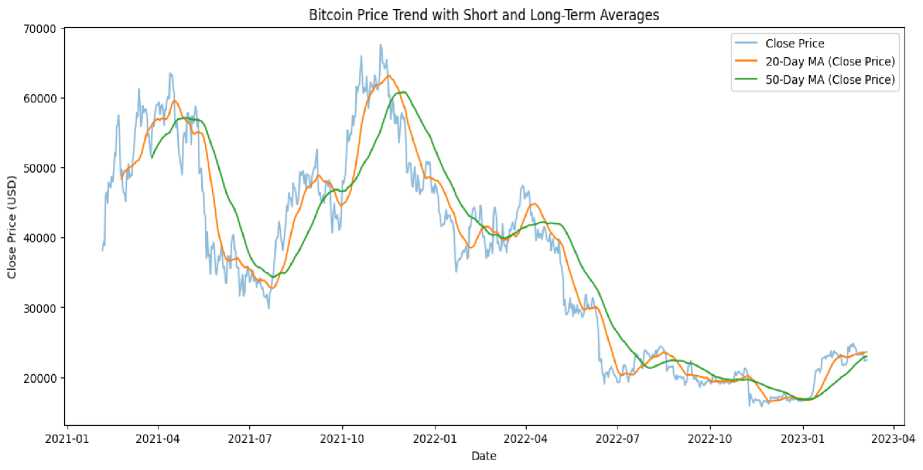
Fig. 6. Visualization of Bitcoin Close Price Trends observed during the period of 2021 to 2023.
-
3.3 Sentiment Analysis for Both Time Durations of Bitcoin Tweets
Sentiment analysis, which identifies the emotions (positive, negative, or neutral) conveyed in text, benefits greatly from the real-time and diverse nature of social media posts such as tweets. Since they are user-generated, tweets provide particularly valuable data for sentiment analysis. In this study, the cleaned tweets from 2017–2019 and 2021–2023 were analyzed using the VADER Sentiment Analysis tool—an approach specifically designed for social media text. VADER calculates a compound score for each tweet, indicating overall sentiment on a scale from -1 (most negative) to +1 (most positive), with scores near zero suggesting no dominant sentiment. By leveraging predefined weights to gauge each word’s contribution, VADER facilitates accurate sentiment detection in short, informal texts like tweets. Once the sentiment score is computed, each tweet is classified as positive, negative, or neutral according to defined thresholds.
-
3.4 Sentiment Score Group-by-Day
-
3.5 Merging Sentiment Scores with Bitcoin Closing Prices Across Two Periods
To investigate sentiment alongside price fluctuations, this study combines daily sentiment scores from tweets with Bitcoin’s closing prices in a single CSV file for two distinct periods: 01/01/2017–23/11/2019 and 05/02/2021– 05/03/2023. The datasets are merged using the timestamp as the common key, producing two integrated datasets— Dataset 1 for 2017–2019 and Dataset 2 for 2021–2023. Each dataset includes columns for both sentiment scores and closing prices, creating a comprehensive resource for subsequent model training. Additionally, Fig. 9 illustrates correlation graphs between sentiment and closing prices.
Although VADER was chosen for sentiment analysis due to its computational efficiency and suitability for realtime analysis, it has certain limitations. As a lexicon and rule-based model, VADER may struggle with capturing sarcasm, contextual ambiguity, and domain-specific jargon commonly found in financial tweets. It can also be sensitive to noisy or non-representative data. However, VADER is specifically optimized for social media language—handling emojis, slang, and punctuation-based emphasis (e.g., capitalization)—which makes it highly effective for Twitter-based sentiment analysis. Its lightweight design and ease of deployment enabled efficient processing of large-scale datasets without requiring labeled data or fine-tuning. While modern transformer-based models like BERT or RoBERTa are capable of capturing deeper contextual meaning, they are computationally intensive and typically require substantial labeled datasets for fine-tuning. In contrast, VADER’s out-of-the-box usability and real-time performance made it a practical and robust choice for this study. The high accuracy achieved by our forecasting model further proves that the sentiment signals extracted by VADER were sufficiently effective for the task.
The daily sentiment scores are initially calculated as a mean value for each day (see Fig. 7), illustrating how Bitcoin-related discussions shift over time. Subsequently, the dataset is augmented with positive and negative ratios, representing the percentages of tweets labeled positive or negative on a given day. To capture both short-term and longterm sentiment patterns, 20-day and 50-day moving averages of the daily sentiment scores are calculated (see Fig. 8). This smooth approach provides deeper insight into overall sentiment trends and their potential impact on Bitcoin price movements.
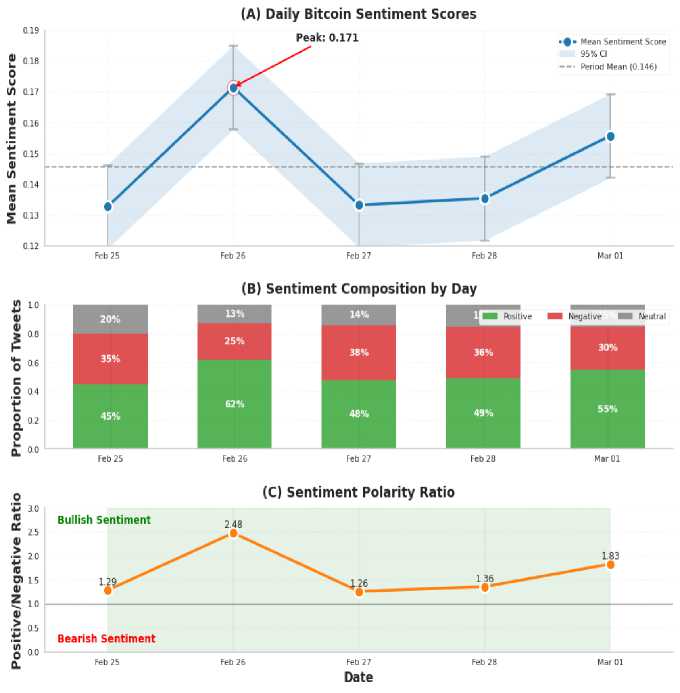
Fig. 7. Sentiment Trends in Bitcoin-Related Tweets: Scores, Composition, and Polarity Ratios (Feb–Mar 2023).
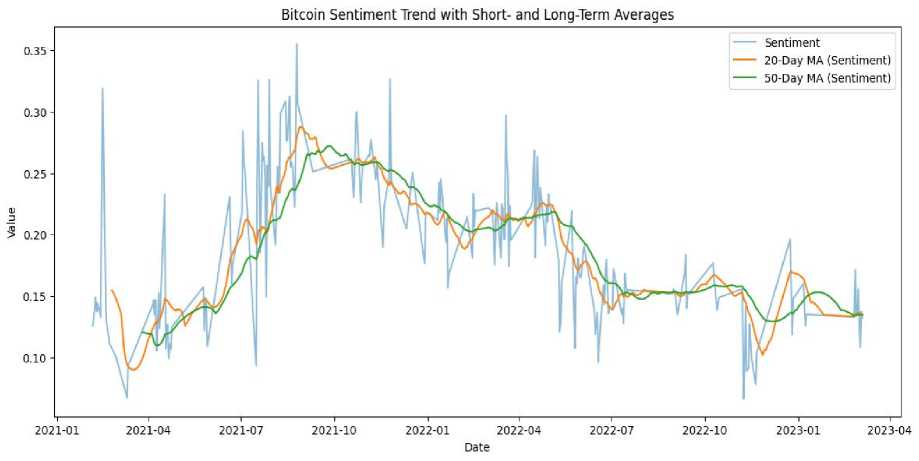
Fig. 8. Visualization of Bitcoin sentiment trends (2021–2023), illustrating sentiment fluctuations over time.
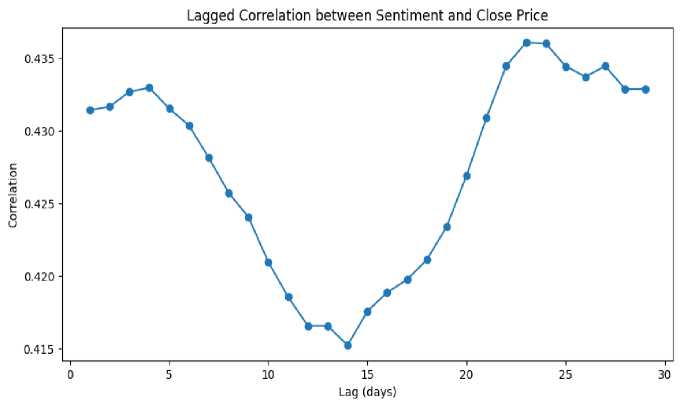
Fig. 9. Correlation analysis between sentiment scores and Bitcoin closing prices from 2021 to 2023.
-
3.6 Model Architecture
A hybrid model was developed to predict Bitcoin price trends by integrating two distinct feature sets: historical Bitcoin closing prices and sentiment scores extracted from relevant tweets. The architecture, illustrated in Fig. 10, operates as follows:
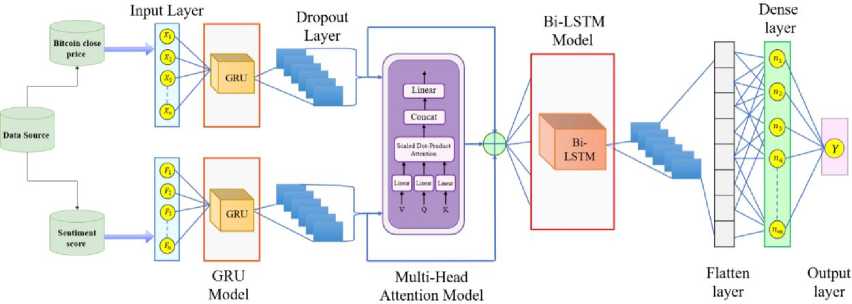
Fig. 10. A comprehensive overview of the proposed model architecture.
-
• Step 1: Load the Datasets
The proposed architecture processes two distinct sets of input features in parallel: historical Bitcoin closing prices and sentiment scores. Handling both feature sets concurrently enables the model to capture the interaction between timeseries price dynamics and sentiment-driven market behavior. Let the two input feature sets be denoted as follows:
D 2 = { X 1 , t 1 }
Where X is the Bitcoin Close price data and t is the corresponding timestamp
D2 ={ X2,12}
Where X is the sentiment data, and t is the corresponding timestamp.
Xj = { xt, x2... xm}
Where x. e R d is a feature vector at time t , for both sets.
i i
-
• Step 2: Extract Temporal Dependencies Using GRU
Each feature set is passed to its corresponding Gated Recurrent Unit (GRU) layer, where temporal dependencies are captured, and sequential representations are inferred. One GRU focuses on the dynamic aspects of Bitcoin closing price movements, while the other extracts sentiment patterns, ensuring that the unique characteristics of each feature set are effectively learned.
G = GRU { X }
