A Type-2 Fuzzy Logic Based Framework for Function Points

Author: Anupama Kaushik, A.K. Soni, Rachna Soni
Journal: International Journal of Intelligent Systems and Applications(IJISA) @ijisa
Article in issue: 3 vol.5, 2013.
Free access
Software effort estimation is very crucial in software project planning. Accurate software estimation is very critical for a project success. There are many software prediction models and all of them utilize software size as a key factor to estimate effort. Function Points size metric is a popular method for estimating and measuring the size of application software based on the functionality of the software from the user’s point of view. While there is a great advancement in software development, the weight values assigned to count standard FP remains the same. In this paper the concepts of calibrating the function point weights using Type-2 fuzzy logic framework is provided whose aim is to estimate a more accurate software size for various software applications and to improve the effort estimation of software projects. Evaluation experiments have shown the framework to be promising.
Project management, Software Effort Estimation, Type-2 Fuzzy Logic System, Function Point Analysis
Short address: https://sciup.org/15010391
IDR: 15010391
Text of the scientific article A Type-2 Fuzzy Logic Based Framework for Function Points
Published Online February 2013 in MECS
Software development has become an important activity for many modern organizations. Software engineers have become more and more concerned about accurately predicting the cost and quality of software product under development. Consequently, many models for estimating software cost have been proposed such as Constructive Cost Model(COCOMO) [1],Constructive Cost Model II (COCOMO II) [2], Software Life Cycle Management (SLIM) [3] etc. These models identify key contributors to effort and use historical organizational projects data to generate a set of mathematical formulae that relates these contributors to effort. Such a set of mathematical formulae are often referred to as parametric model because alternative scenarios can be defined by changing the assumed values of a set of fixed coefficients (parameters) [4]. All these models use the software size as the major determinant of effort. Function Points is an ideal software size metric to estimate cost since it can be used in the early development phase, such as requirement, measures the software functional size from user’s view, and is programming language independent [5].
Today the scenario of software industry has changed from what it has many years ago. Now-a-days the object oriented paradigm has incorporated into the software development which leads to the creation of object oriented function points [6]. All the traditional cost estimation models are limited by their inability to cope with vagueness and imprecision in the early stages of the software life cycle. So, a number of soft computing approaches like fuzzy logic (FL), artificial neural networks (ANN), evolutionary computation (EC) etc. are incorporated to make rational decisions in an environment of uncertainty and vagueness. The first realization of the fuzziness of several aspects of COCOMO was that of Fei and Liu [7] called F-COCOMO. Jack Ryder [8] investigated the application of fuzzy modelling techniques to COCOMO and the Function Points models, respectively. Venkatachalam [9] investigated the application of artificial neural network (ANN) to software cost estimation. Many researchers have applied the evolutionary computation approach towards cost estimation [10, 11].
-
1.1 Background and related work
Osias de Souza Lima Junior et al. [12] have worked on trapezoidal fuzzy numbers to model function point analysis for the development and enhancement project assessment. Ho Leung [13] has presented a case study for evaluation of function points. Finnie et al. [14] provided the combination of machine learning approach with FP. They compared the three approaches i.e. regression analysis, artificial neural networks and case based reasoning using FP as an estimate of software size. The authors observed that both artificial neural networks and case based reasoning performed well on the given dataset in contrast to regression analysis. They concluded that case based reasoning is appealing because of its similarity to the expert judgement approach and for its potential in supporting human judgement. Al-Hajri et al. [15] establish a new FP weight system using artificial neural network. Lima et al. [16] proposed the concepts and properties from fuzzy set theory to extend FP analysis into a fuzzy FP analysis and the calibration was done using a small database comprised of legacy systems developed mainly in Natural 2, Microsoft Access and Microsoft Visual Basic. Yau and Tsoi [17] introduced a fuzzified FP analysis model to help software size estimators to express their judgement and use fuzzy B-spline membership function to derive their assessment values. The weak point of their work is that they use limited in-house software to validate the model. Abran and Robillard’s empirical study [18] demonstrates the clear relationship between FPA’s primary component and work-effort. Kralj et al. [19] identified the function point analysis method deficiency of upper boundaries in the rating complexity process and proposed an improved FPA method. Wei Xia et al. [20] proposed a Neuro-Fuzzy calibration approach for function point complexity weights. Their model provided an equation between Unadjusted Function Points and work effort which is used to train the neural network and estimated the effort. Moataz A. Ahmed and Zeeshan Muzaffar [4] provided an effort prediction framework that is based on type-2 fuzzy logic to allow handling imprecision and uncertainty present in the effort prediction. Mohd. Sadiq et al. [21] developed two different linear regression models using fuzzy function point and non fuzzy function point in order to predict the software project effort.
The above researches have concluded that the combination of soft computing approaches and the traditional cost estimation models yields a more accurate prediction of software costs and effort. All the earlier work on software cost estimation using fuzzy logic incorporated type-1 or type-2 fuzzy framework for effort prediction. This paper proposes an improved FPA method by calibrating the function point’s weight using type-2 fuzzy logic framework.
-
1.2 Function Point Analysis: A short description
Function point analysis is a process used to calculate the software size from the user’s point of view, i.e. on the basis of what the user requests and receives in return from the system. Allan J Albrecht [22] of IBM proposed Function Point Count (FPC) as a size measure in the late 1970s. Albrecht had taken up the task of arriving at size measures of software systems to compute a productivity measure that could be used across programming languages and development technologies. The current promoter of Albrecht’s function point model is the International Function Point User’s Group (IFPUG). IFPUG evolves the FPA method and periodically releases the Counting Practices Manual for consistent counting of function points across different organizations. In FPA, a system is decomposed into five functional units: Internal Logical Files (ILF), External Interface Files (EIF), External Inputs (EI), External Outputs (EO) and External Inquiry (EQ). These functional units are categorized into data functional units and transactional function units. All the functions do not provide the same functionality to the user. Hence, the function points contributed by each function varies depending upon the type of function (ILF, EIF, EI, EO or EQ) and complexity (Simple, Average or Complex) of the function. The data functions complexity is based on the number of Data Element Types (DET) and number of Record Element Types (RET). The transactional functions are classified according to the number of file types referenced (FTRs) and the number of DETs. The complexity matrix for all the five components is given in Table 1, Table 2 and Table 3. Table 4 illustrates how each function component is then assigned a weight according to its complexity.
The actual calculation process of FPA is accomplished in three stages: (i) determine the unadjusted function points (UFP); (ii) calculate the value adjustment factor (VAF); (iii) calculate the final adjusted function points.
The Unadjusted Function Points (UFP) is calculated using “(1)”, where W ij are the complexity weights and Z ij are the counts for each function component.
UFP =∑L∑U^Wy (1)
The second stage, calculating the value adjustment factor (VAF), is derived from the sum of the degree of influence (DI) of the 14 general system characteristics (GSCs). The DI of each one of these characteristics ranges from 0 to 5 as follows: (i) 0 – no influence; (ii) 1 – incidental influence; (iii) 2 – moderate influence; (iv) 3 – average influence; (v) 4 – significant influence; and (vi) 5 – strong influence.
The general characteristics of a system are: (i) data communications; (ii) distributed data processing; (iii) performance; (iv) heavily used configuration; (v) transaction rate; (vi) online data entry; (vii) end-user efficiency; (viii) on-line update; (ix) complex processing; (x) reusability; (xi) installation ease; (xii) operational ease; (xiii) multiple sites; and (xiv) facilitate change. VAF is then computed using “(2)”:
VAF = 0․65 + 0․01∑ 1=1 xi (2)
x i is the Degree of Influence (DI) rating of each GSC.
Finally, the adjusted function points are calculated as given in “(3)”.
FP = × VAF (3)
Table 1: Complexity Matrix of ILF/EIF
|
ILF/EIF |
DET |
||
|
RET |
1-19 |
20-50 |
51+ |
|
1 |
Simple |
Simple |
Average |
|
2-5 |
Simple |
Average |
Complex |
|
6+ |
Average |
Complex |
Complex |
Table 2: Complexity Matrix of EI
|
EI |
DET |
||
|
FTR |
1-4 |
5-15 |
16+ |
|
0-1 |
Simple |
Simple |
Average |
|
2 |
Simple |
Average |
Complex |
|
3+ |
Average |
Complex |
Complex |
Table 3: Complexity Matrix of EO/EQ
|
EO/EQ |
DET |
||
|
FTR |
1-5 |
6-19 |
20+ |
|
0-1 |
Simple |
Simple |
Average |
|
2-3 |
Simple |
Average |
Complex |
|
4+ |
Average |
Complex |
Complex |
Table 4: Functional Units with weighting factors
|
Component |
Simple |
Average |
Complex |
|
External Inputs |
3 |
4 |
6 |
|
External Outputs |
4 |
5 |
7 |
|
External Inquiry |
3 |
4 |
6 |
|
Internal logical files |
7 |
10 |
15 |
|
External Interface files |
5 |
7 |
10 |
-
II. Type 2 Fuzzy Logic Systems
Fuzzy Logic is a methodology to solve problems which are too complex to be understood quantitatively. It is based on fuzzy set theory and introduced in 1965 by Prof. Zadeh in the paper fuzzy sets [23]. It is a theory of classes with unsharp boundaries, and considered as an extension of the classical set theory [24]. The membership µA(x) of an element x of a classical set A, as subset of the universe X, is defined by:
µ (x) = {1 if fx ∈ A µA(x) = { if fx ∉ A
That is, x is a member of set A (µ A (x) = 1) or not (µA (x) = 0). The classical sets where the membership value is either zero or one are referred to as crisp sets.
Fuzzy sets allow partial membership. A fuzzy set A is defined by giving a reference set X, called the universe and a mapping;
µ A : X → [0,1]
called the membership function of the fuzzy set A µ A (x), for x ∈ X is interpreted as the degree of membership of x in the fuzzy set A. A membership function is a curve that defines how each point in the input space is mapped to a membership value between 0 and 1. The higher the membership x has in the fuzzy set A, the more true that x is A. The membership functions (MFs) may be triangular, trapezoidal, Gaussian, parabolic etc.
Fuzzy logic allows variables to take on qualitative values which are words. When qualitative values are used, these degrees may be managed by specific inferential procedures. Just as in fuzzy set theory the set membership values can range (inclusively) between 0 and 1, in fuzzy logic the degree of truth of a statement can range between 0 and 1 and is not constrained to the two truth values {true, false} as in classic predicate logic.
Fuzzy Logic System (FLS) is the name given to any system that has a direct relationship with fuzzy concepts. The most popular fuzzy logic systems in the literature may be classified into three types [25]: pure fuzzy logic systems, Takagi and Sugeno’s fuzzy system and fuzzy logic system with fuzzifier and defuzzifier also known as Mamdani system. As most of the engineering applications use crisp data as input and produce crisp data as output, the Mamdani system [26] is the most widely used one where the fuzzifier maps crisp inputs into fuzzy sets and the defuzzifier maps fuzzy sets into crisp outputs.
Zadeh [27], proposed more sophisticated kinds of fuzzy sets, called type-2 fuzzy sets (T2FSs). A type-2 fuzzy set lets us incorporate uncertainty about the membership function into fuzzy set theory. In order to symbolically distinguish between a type-1 fuzzy set and a type-2 fuzzy set, a tilde symbol is put over the symbol for the fuzzy set; so, A denotes a type-1 fuzzy set, whereas à denotes the comparable type-2 fuzzy set. Mendel and Liang [28, 29] characterized T2FSs using the concept of footprint of uncertainty (FOU), and upper and lower MFs. To depict the concept, let us consider type-1 gauss MF shown in “Fig. 1”.
As can be seen from the figure type-1 gaussian membership function is constrained to be in between 0 and 1 for all x ∈ X, and is a two dimensional function. These types of membership don’t carry any uncertainty. There exists a clear membership value for every input data point.
If the Gaussian function in “Fig.1” is blurred “Fig. 2”
can be obtained. The FOU represents the bounded region obtained by blurring the boundaries of type-1
A general architecture of type-2 fuzzy logic system (T2FL) as proposed by Mendel is depicted in “Fig. 3”.
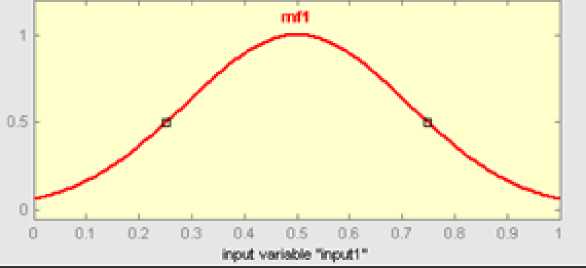
Fig. 1: A Gaussian Type-1 membership function
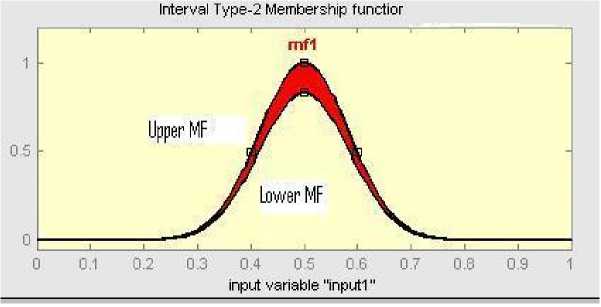
Fig. 2: A Gaussian Type-2 membership function
Type-2 FLS
Output Processing
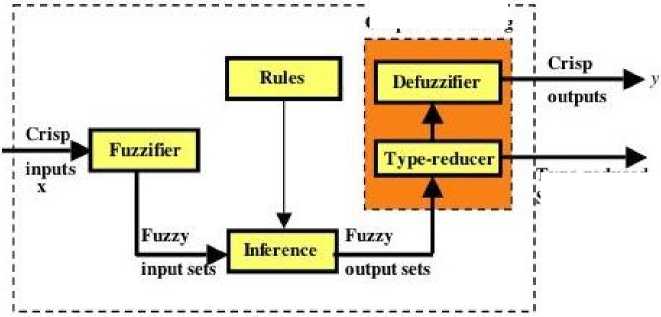
Fig. 3: A typical type-2 fuzzy logic system [29]
Type-reduced Set (Type-1)
Table 5: Example on FP complexity classification
|
EIF A |
EIF B |
EIF C |
|
|
DET |
70 |
51 |
50 |
|
RET |
5 |
5 |
5 |
|
Complexity Classification |
complex |
complex |
average |
|
Weight Value |
10 |
10 |
7 |
T2FL systems contain five components – rules, fuzzifier, inference engine, type reducer, and defuzzifier. Rules are the heart of a T2FL system, and may be provided by experts or can be extracted from numerical data. These rules can be expressed as a collection of IF-THEN statements. The IF part of a rule is its antecedent, and the THEN part of the rule is its consequent. Fuzzy sets are associated with terms that appear in the antecedents or consequents of rules, and with inputs to and output of the T2FL system. The inference engine combines rules and gives mapping from input type-2 fuzzy sets to output type-2 fuzzy set. The fuzzifier converts inputs into their fuzzy representation. The defuzzifier converts the output of the inference engine into crisp output. The type reducer transforms the type-2 fuzzy output set into type-1 fuzzy set to be processed by the defuzzifier. A T2FL system is very similar to a T1FL system; the major difference being that the output processing block of T1FL system is just a defuzzifier while the output processing block of a T2FL system contains the type reducer as well.
-
III. Problem Description and Analysis
In cost estimation process, the primary input is the software size and the secondary inputs are the various cost drivers. There is a significant relationship between the software size and cost. There are mainly two types of software size metrics: lines of code (LOC) and Function Point (FP). Size estimation is best done when there is complete information about the system; but this is not available till the system is actually built. The challenge for the estimator is therefore to arrive at a reasonable estimate of the size of the system with partial information.
LOC is usually not available until the coding phase, so FP has gained popularity because it can be used at an earlier stage of software development.
In our work, we are using type-2 based fuzzy logic approach to calibrate the function point weight values which provides an improvement in the software size estimation process. There are 15 parameters in the FP complexity weight system to calibrate. These parameters are low, average and high values of External Inputs, External Outputs, Internal Logical Files, External Interface Files and External Inquiries respectively. A fuzzy based approach is chosen since it can capture human’s judgement with ease and instead of giving an exact number to all 15 function points parameters we can define fuzzy linguistic terms and assign a fuzzy set within numeric range. This provides an ability to cope up with the vagueness and imprecision present in the earlier stages of software development.
In Function Point Analysis (FPA) method each component is classified to a complexity level determined by the number of its associated files such as DET, RET or FTR as given in Table 4. If we determine the FPA complexity of a particular software application, in some cases it may not correctly reflect the complexity for its components.
Table 5 shows a software project with three EIF’s A, B and C. According to the complexity matrix, A and B are classified as having the same complexity and are assigned the same weight value of 10. However, A has 19 more DET than B and is certainly more complex. But both of them are assigned the same complexity. Also, EIF C is having only one DET less than EIF B and it is classified as average and assigned a weight value of 7. From the above example it is concluded that there is a huge scope of improvement in the FPA complexity classification. Processing the number of FP component associated files such as DET, RET and FTR using fuzzy logic can provide an exact complexity degree.
-
IV. Fuzzy Logic calibration to improve FPA
Type-2 fuzzy inference system is developed for all the five FPA components (ILF, EIF, EI, EO, EQ) using the Mamdani approach. We define three new linguistic terms: small, medium and large, to express the inputs qualitatively. Also we use linguistic terms: simple, average and complex for the output. To fuzzify the inputs and outputs, we define fuzzy sets to represent the linguistic terms [30]. The fuzzy membership grade is captured through the membership functions of each fuzzy set. The inputs and outputs are represented using gaussian igaussstype2 membership which is represented in “Fig. 4”. It has certain mean m, and an uncertain standard deviation that takes on values in [σ1, σ2]. The shaded area represents the FOU. Using interval type-2 Gaussian MF’s makes it easier to build T2FL systems since the mathematics behind the corresponding inferential procedures and training algorithms are less complicated [29]. “Fig.5 (a)” and “Fig.5 (b)” shows how the inputs of EIF are assigned the membership functions and represented using linguistic variables of fuzzy sets. “Fig. 6” depicts the output of EIF using membership functions. After representing the inputs and output of EIF using membership functions nine fuzzy rules are defined using rule editor based on the original complexity matrices and illustrated in Table 6. Each rule has two parts in its antecedent linked with an ‘AND’ operator and one part in its consequence. These fuzzy rules define the connection between the input and output fuzzy variables. A fuzzy rule has the form: IF
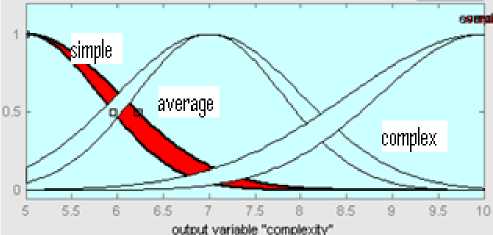
Fig. 6: Output fuzzy set Complexity for EIF
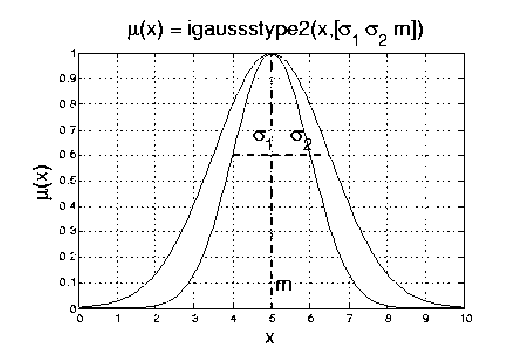
Fig. 4: FOU for Gaussian MF
Table 6: Truth table of fuzzy logic rule set
|
Rule # |
Input 1 |
Input 2 |
Output |
|
1. |
Small |
Small |
Simple |
|
2. |
Medium |
Small |
Simple |
|
3. |
Large |
Small |
Average |
|
4. |
Small |
Medium |
Simple |
|
5. |
Medium |
Medium |
Average |
|
6. |
Large |
Medium |
Complex |
|
7. |
Small |
Large |
Average |
|
8. |
Medium |
Large |
Complex |
|
9. |
Large |
Large |
Complex |
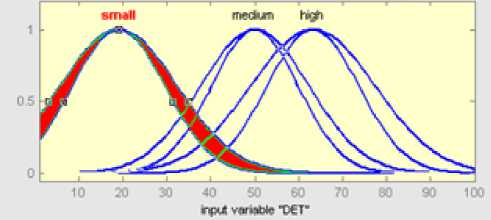
Fig. 5 (a): Input fuzzy set DET for EIF
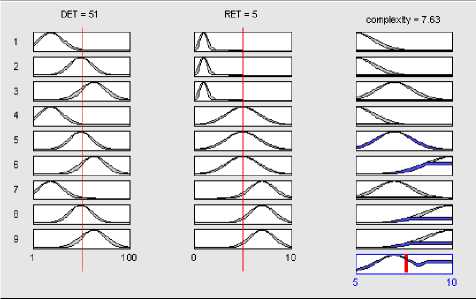
Fig. 7: Type-2 Fuzzy Inference process of Function Points Model
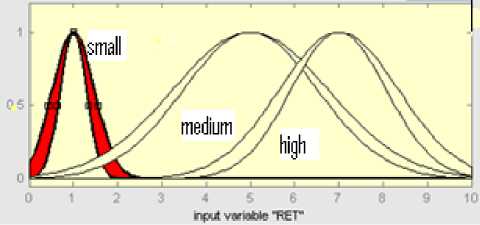
Table 7: Calibration using type-2 fuzzy logic
|
EIF A |
EIF B |
EIF C |
|
|
DET |
70 |
51 |
50 |
|
RET |
5 |
5 |
5 |
|
Original weight value |
10 |
10 |
7 |
|
Calibrated weight value |
8.39 |
7.63 |
7.60 |
Fig. 5 (b): Input fuzzy set RET for EIF
An example of the complete fuzzy inference process is shown in “Fig. 7”. Input values are set to DET 51 and RET 5. These are represented using the antecedent part of the fuzzy rules. Finally, the consequent part is defuzzified and the output is achieved as a single value of 7.63.A fuzzy logic system for each FPA element (ILF, EIF, EI, EO, EQ) is constructed. A fuzzy complexity measurement system that takes into account all five Unadjusted Function Points function components is built after the fuzzy logic system for each function component is established as shown in “Fig. 8”. The calibrated values for EIF A, EIF B and EIF C is listed in Table 7 and it is found that these calibrated weight values are more convincing than the original weight values.
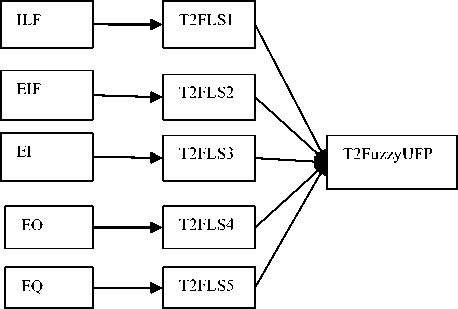
Fig. 8: Fuzzy complexity measurement system for Type-2 Fuzzy function points model
Using “(1)” total unadjusted function points from the type-2 technique and the conventional technique is calculated and listed in Table 13. It is found that the type-2 technique is at par than the conventional technique.
Table 9: Calculation of t2UFFP and UFP for EIF
|
DET |
RET |
Count |
t2UFFP |
UFP |
|
80 |
3 |
2 |
17.14 |
20 |
|
42 |
5 |
2 |
14.6 |
14 |
|
24 |
3 |
2 |
12.5 |
14 |
|
30 |
4 |
2 |
13 |
14 |
|
Total |
57.24 |
62 |
||
Table 10: Calculation of t2UFFP and UFP for EI
|
FTR |
DET |
Count |
t2UFFP |
UFP |
|
3 |
16 |
2 |
10.2 |
12 |
|
2 |
8 |
1 |
4.2 |
4 |
|
2 |
16 |
1 |
4.46 |
6 |
|
3 |
5 |
2 |
8.38 |
12 |
|
Total |
27.24 |
34 |
||
Table 8: Calculation of t2UFFP and UFP for ILF
|
DET |
RET |
Count |
t2UFFP |
UFP |
|
55 |
3 |
2 |
21.4 |
30 |
|
29 |
2 |
2 |
19.86 |
20 |
|
75 |
3 |
1 |
11.3 |
15 |
|
26 |
2 |
1 |
9.69 |
10 |
|
Total |
62.25 |
75 |
||
-
V. Experimental Methodology and Results
We have conducted some experiments to develop a type-2 fuzzy system for function points analysis using our framework as depicted in “Fig. 8”. Our model has been implemented in Matlab(R2008a). As it is the case with validating any prediction model, real industrial data necessary to use our framework to develop and tune the parameters of prediction models were not available. To get around this data scarcity problem for the sake of showing the validity of our framework for the industry where organizations have their own data available, we generated artificial datasets consisting of 20 projects. A complexity calculation for all the five components for each project is done using the type-2 fuzzy framework. The Tables (8, 9, 10, 11, 12) lists the complexity values for all the five components for the first project using type-2 fuzzy framework (t2UFFP) and conventional method i.e.UFP.
Table 11: Calculation of t2UFFP and UFP for EO
|
FTR |
DET |
count |
t2UFFP |
UFP |
|
3 |
20 |
2 |
12.76 |
14 |
|
4 |
15 |
2 |
12.68 |
14 |
|
1 |
20 |
3 |
14.31 |
15 |
|
2 |
15 |
1 |
4.67 |
5 |
|
Total |
44.42 |
48 |
||
Table 12: Calculation of t2UFFP and UFP for EQ
|
FTR |
DET |
Count |
t2UFFP |
UFP |
|
3 |
20 |
2 |
9.96 |
12 |
|
2 |
15 |
1 |
4.21 |
4 |
|
4 |
19 |
1 |
4.86 |
6 |
|
Total |
19.03 |
22 |
||
Table 13: Comparison of t2UFFP and UFP
|
t2UFFP |
UFP |
|
|
ILF |
62.25 |
75 |
|
EIF |
57.24 |
62 |
|
EI |
27.24 |
34 |
|
EO |
44.42 |
48 |
|
EQ |
19.03 |
22 |
|
Total |
210.18 |
241 |
Table 14: Comparison of type-2 fuzzy FP and conventional FP
|
VAF |
UFP |
FP |
|
|
Conventional FP |
1.07 |
241 |
257.87 |
|
Type-2 fuzzy FP |
1.07 |
210.18 |
224.89 |
In order to compute the value of the conventional function point and type-2 fuzzy function point, we have treated all the 14 general system characteristics as average. Using “(2)” and “(3)” VAF and FPA is calculated and listed in Table 14.
From the above results it is concluded that the calibrated function points using type-2 fuzzy yields better results than conventional function points.
-
VI. Conclusions
FP as a software size metric is an important topic in the software engineering domain. The use of type2 fuzzy logic to calibrate FP weight values further improves the estimation of FP. This in turn will improve the cost estimation process of software projects. Empirical evaluation has shown that T2FL is promising. But there are potentials for improvements when the framework is deployed in practice. As all the experiments were conducted using artificial datasets, a need to evaluate the prediction performance of the framework on real data still persists. Some future work can be directed towards developing inferential procedures using various other membership functions present in type-2 fuzzy systems. This work can also be extended using Neuro Fuzzy approach.
Acknowledgement
The authors would like to thank the anonymous reviewers for their careful reading of this paper and for their helpful comments.
References A Type-2 Fuzzy Logic Based Framework for Function Points
- B.W. Boehm. Software Engineering Economics. Prentice Hall, Englewood Cliffs, NJ, 1981.
- B. Boehm, B. Clark, E. Horowitz, R. Madachy, R. Shelby, C. Westland. Cost models for future software life cycle processes: COCOMO 2.0. Annals of Software Engineering, 1995.
- L.H. Putnam. A general empirical solution to the macro software sizing and estimation problem. IEEE Transactions on Software Engineering, vol.4, 1978, pp 345-361.
- Moataz A. Ahmed, Zeeshan Muzaffar. Handling imprecision and uncertainty in software development effort prediction: A type-2 fuzzy logic based framework. Information and Software Technology Journal. vol. 51, 2009, pp. 640-654.
- Function Point Counting Practices Manual, fourth edition, International Function Point Users Group, 2004.
- G. Antoniol, C. Lokan, G. Caldiera, R. Fiutem. A function point like measure for object oriented software. Empirical Software Engineering. vol. 4, 1999, pp. 263-287.
- Fei. Z, X. Liu. f-COCOMO-Fuzzy Constructive Cost Model in Software Engineering. Proceedings of IEEE International Conference on Fuzzy System. IEEE Press, New York, 1992, pp. 331-337.
- J. Ryder. Fuzzy Modeling of Software Effort Prediction. Proceedings of IEEE Information Technology Conference. Syracuse, NY, 1998.
- A.R. Venkatachalam. Software Cost Estimation using artificial neural networks. Proceedings of the International Joint Conference on Neural Networks, 1993, pp. 987-990.
- K.K. Shukla. Neuro-genetic Prediction of Software Development Effort. Journal of Information and Software Technology, Elsevier. vol. 42, 2000, pp. 701-713.
- Alaa.F.Sheta. An Estimation of the COCOMO model parameters using the genetic algorithms for the NASA project parameters. Journal of Computer Science, vol. 2, 2006, pp.118 -123.
- Osias de Souza Lima Junior, Pedro Porfirio Muniaz Parias, Arnaldo Dias Belchior. A fuzzy model for function point analysis to development and enhancement project assessement. CLEI Electronic Journal, vol. 5, 1999, pp. 1-14.
- Ho Leung, TSOI. To evaluate the function point analysis: A case study. International Journal of computer, Internet and management vol. 13, 2005, pp. 31-40.
- G.R. Finnie, G.E. Wittig, J.M. Desharnais. A comparison of software effort estimation techniques: using function points with neural networks, case-based reasoning and regression models. Journal of Systems Software, Elsevier. vol. 39, 1977, pp. 281-289.
- M.A. Al-Hajri, A.A.A Ghani, M.S. Sulaiman, M.H. Selamat. Modification of standard function point complexity weights system. Journal of Systems and Software, Elsevier,vol. 74, 2005, pp. 195-206.
- O.S. Lima, P.F.M. Farias, A.D. Belchior. Fuzzy modeling for function point analysis. Software Quality Journal, vol. 11, 2003, pp. 149-166.
- C. Yau, H. L. Tsoi. Modelling the probabilistic behavior of function point analysis. Journal of
- Information and Software Technology, Elsevier. vol. 40, 1998, pp. 59-68.
- A. Abran, P. Robillard. Function Points Analysis: An empirical study of its measurement processes. IEEE Transactions on Software Engineering, vol. 22, 1996, pp.895-910.
- T. Kralj, I. Rozman, M. Hericko, A. Zivkovic. Improved standard FPA method- resolving problems with upper boundaries in the rating complexity process. Journal of Systems and Software, Elsevier, vol. 77, 2005, pp. 81-90.
- Wei Xia, Luiz Fernando Capretz, Danny Ho, Faheem Ahmed. A new calibration for function point complexity weights. Journal of Information and Software Technology, Elsevier. vol. 50, 2008 pp.670-683.
- Mohd. Sadiq, Farhana Mariyam, Aleem Ali, Shadab Khan, Pradeep Tripathi. Prediction of Software Project Effort using Fuzzy Logic. Proceedings of IEEE International Conference on Fuzzy System, 2011, pp. 353-358.
- A. Albrecht. Measuring application development productivity. Proceedings of the Joint SHARE/GUIDE/IBM Application Development Symposium, 1979, pp. 83-92.
- L. A. Zadeh. Fuzzy Sets. Information and Control, vol. 8, 1965, pp. 338-353.
- M. Wasif Nisar, Yong-Ji Wang, Manzoor Elahi. Software Development Effort Estimation using Fuzzy Logic – A Survey. Fifth International Conference on Fuzzy Systems and Knowledge Discovery, 2008, pp 421-427.
- L. Wang. Adaptive Fuzzy System and Control: Design and Stability Analysis. Prentice Hall, Inc., Englewood Cliffs, NJ 07632, 1994.
- E.H. Mamdani. Applications of fuzzy algorithms for simple dynamic plant. Proceedings of IEEE, vol. 121, 1974, pp. 1585-1588.
- L. A. Zadeh. The Concept of a Linguistic Variable and Its Application to Approximate Reasoning–1. Information Sciences, vol. 8, 1975, pp. 199-249.
- J.M. Mendel, Q. Liang. Pictorial comparison of Type-1 and Type-2 fuzzy logic systems. Proceedings of IASTED International Conference on Intelligent Systems and Control, Santa Barbara, CA, October 1999.
- J.M. Mendel. Uncertain Rule-Based Fuzzy Logic Systems, Prentice Hall, Upper Saddle River, NJ 07458, 2001.
- E.H. Mamdani. Application of fuzzy logic to approximate reasoning using linguistic synthesis. IEEE transactions on computers, vol. 26, 1977, pp. 1182-1191.
