A Unified Model of Clustering and Classification to Improve Students’ Employability Prediction

Author: Pooja Thakar, Anil Mehta, Manisha
Journal: International Journal of Intelligent Systems and Applications(IJISA) @ijisa
Article in issue: 9 vol.9, 2017.
Free access
Data Mining is gaining immense popularity in the field of education due to its predictive capabilities. But, most of the prior effort in this area is only directed towards prediction of performance in academic results only. Nowadays, education has become employment oriented. Very little attempt is made to predict students’ employability. Precise prediction of students’ performance in campus placements at an early stage can identify students, who are at the risk of unemployment and proactive actions can be taken to improve their performance. Existing researches on students’ employability prediction are either based upon only one type of course or on single University/Institute; thus is not scalable from one context to another. With this necessity, the conception of a unified model of clustering and classification is proposed in this paper. With the notion of unification, data of professional courses namely Engineering and Masters in Computer Applications students are collected from various universities and institutions pan India. Data is large, multivariate, incomplete, heterogeneous and unbalanced in nature. To deal with such a data, a unified predictive model is built by integrating clustering and classification techniques. Two- Level clustering (k-means kernel) with chi-square analysis is applied at the pre-processing stage for the automated selection of relevant attributes and then ensemble vote classification technique with a combination of four classifiers namely k-star, random tree, simple cart and the random forest is applied to predict students’ employability. Proposed framework provides a generalized solution for student employability prediction. Comparative results clearly depict model performance over various classification techniques. Also, when the proposed model is applied up to the level of the state, classification accuracy touches 96.78% and 0.937 kappa value.
Clustering, Classification, Data Mining, Employability, Prediction, Education
Short address: https://sciup.org/15010962
IDR: 15010962
Text of the scientific article A Unified Model of Clustering and Classification to Improve Students’ Employability Prediction
Published Online September 2017 in MECS
-
I. Introduction
The latest report published by India Today on March 20, 2017, revealed that out of eight lakh engineering graduates in the country, 60% remain unemployed [1]. In a similar report last year on July 13, 2016, it published that only 7% of engineers are suitable for core domain jobs [2]. The need of the hour is to accurately predict graduates employability in the very first year of their course enrollment so that more effectual actions and policies can be implemented on time.
Institutes maintain details of students from their enrollment till they pass out, which includes academic records, personal details, and various skill based test records such as aptitude test and psychometric test. This data can be of immense use if utilized for analysis. Studies reflect the potential of such data to guide students for better employability. But, such data suffers from two major inherent problems i.e. unbalanced and multivariate [3]. Moreover, most of the existing researches either consider a data set of only one type of course or one University/Institute for predictive analysis of students’ employability [4][5]. Educational Decision Systems are thus extremely customized to fulfill the needs of the specific Institute. There is no unified approach that can be used across institutes with any type of dataset.
This paper presents a unified model that serves two major objectives.
-
A. To automate the selection of relevant attributes from the set of the multivariate data set (151 attributes in the present study) at preprocessing stage. Proposed model uses two-level clustering to reduce the data set automatically based upon
classification results. Finally, finding the relevant set of attributes with chi-square analysis.
-
B. To construct the unified prediction model based upon most suitable classification algorithm(s). Proposed Model integrates four best classifiers with vote ensemble method to predict student’s employability (i. e. placed or unplaced in on-campus placement drives).
Researchers suggest that initial multidimensional data set should be put into self-learning mode to generate homogeneous groups [6]. It is also proved that clustering applied on attributes set at pre-processing stage helps in parsimonious selection of variables and improves the performance of predictive algorithms [3]. Ensemble Model enhances the classification accuracy by integrating the prediction accuracy of base classifiers. Multiple classifier based systems increase the performance of individual classifiers [7].
Thus, proposed model not only outperforms the prediction performance of various classifiers but also help in finding the relevant number of attributes automatically.
Rest of the paper describes the proposed model and its results in details. Section II provides a detailed review of existing literature in the domain of students’ employability prediction. Section III describes the experimental setting of tools and techniques used. Section IV presents the proposed model in detail. Section V describes comparative results. Section VI concludes and section VII showcase the future scope of the study.
-
II. Related Work
-
71.3 % maximum accuracy while excluding parameters like reasoning, aptitude and communication skills [4]. To predict the employability of IT students, Piad, Dumlao, Ballera and Ambat collected data based on five-year profiles of 515 students, which were randomly picked at the placement office tracer study [21]. Bangsuk, and Tsai, designed a model for employability prediction in a single University of Thailand, Maejo University and emphasized on the need of large, multidimensional data set with automated pre processing [5]. In 2015, Rashid indicated the direction of future work and emphasized upon increasing the size and type of educational data set with alternate feature selection techniques that could enhance the performance of classification techniques [22].
Data Mining is widely applied in the field of education especially in online learning systems [8] evaluating teachers’ performance [9]. But, the majority of researchers in the field of educational data mining is focused on predicting core academic performance of students’ based on their past academic results [10-15].
Many other types of research have been carried out to find the students’ employability factors. Communication skills, critical thinking, and problem-solving skills are considered as important employability factors [16]. Researches reflect the importance of secondary attributes for better prediction accuracy [17]. Primary importance is given to soft skills by employers as illustrated by Mark, David, Hamilton and Riley [18]. Across industries, graduates lack in interpersonal skills, communication skills, creative and critical thinking, problem-solving, analytical skills and team work as described by Noor Aieda, Abu Bakar, Aida Mustapha and Kamariah Md. Nasir [19]. Industry demands skilled workforce to handle the projects as compared to only academic achievement as depicted by Jamaludin, Nor Azliana, and Shamsul Sahibuddin [20].
In recent times, little work is done in the direction of students’ employability prediction. Tripti Mishra, Kumar and Gupta collected the details of MCA students (1400 instances) and predicted students’ employability with
In this paper proposed model work with a unified, large and multivariate data set of the education system. Automated preprocessing for feature selection is performed with ensemble classification to enhance the performance of predictive techniques.
-
III. Experimental Setting
RapidMiner Studio Educational Version 7.4.000 is used to implement machine learning algorithms. This version also includes and implements algorithms designed for Weka Mining Tool.
-
A. Data Collection
Data is collected from diverse universities and institutes pan India, offering Engineering (Bachelor in Engineering – B.E. or Bachelor in Technology -B.Tech.) four-year degree course or MCA (Master in Computer Applications) three-year degree course. To ensure the authenticity of data, TPO (Training and Placement Officers) of these Institutes were contacted. It is generally observed that students provide genuine information to their TPOs rather than filling their details in an online questionnaire. Some TPOs provided their institutes’ past records in the specified worksheet. Mostly, provided data in the same format they keep at Institute. Data collected is then compiled in one worksheet with 9459 instances and 160 attributes.
-
B. Data Selection and Transformation
Data is purposely collected for professional courses, as most of these students opt for placements at the end of their course; thus to ensure seriousness during campus placements. The raw dataset comprises of around 9459 instances with 160 attributes. Preliminary data cleaning is done by removing non pertinent parameters such as student name, institute name, batch, and phone number. Derived variables were obtained like age obtained from the date of birth. Most of the attributes were categorized, like occupation, qualification, marks. Instances with incomplete basic information were removed. Final data set used for the study is composed of 7143 instances of 151 attributes. Table 1 provides the categories in which attributes belong. Table 2 displays the partial view of attributes.
Table 1. Categories of Attributes
|
Categories of Attributes |
|||
|
1 |
Personal Details |
8 |
Leadership Skills |
|
2 |
Demographic |
9 |
Core Technical Skills |
|
3 |
Academic Records |
10 |
Finance Aptitude |
|
4 |
Family Details |
11 |
English Aptitude |
|
5 |
Social Parameters |
12 |
Quantitative Aptitude |
|
6 |
Marketing Aptitude |
13 |
Logical Aptitude |
|
7 |
Cognitive Aptitude |
14 |
Mathematical Aptitude |
|
15 |
Personality /Psychometric Aptitude |
||
Table 2. Sample Attributes
|
S.No. |
Category |
Attributes Sample |
|||||
|
1 |
Personal Details |
Gender |
Age |
||||
|
2 |
Demographic |
State |
Graduation Univ |
School State 10 |
School State 12 |
Graduation State |
|
|
3 |
Academic Records |
10th |
12th |
Ug/Pg sem1 |
Ug/Pg sem2 |
Graduation Per |
Stream12 |
|
4 |
Family Details |
Mother Occupation |
Father Occupation |
Mother Qualificatio n |
Father Qualificatio n |
Type of Family |
Number of Siblings |
|
5 |
Social Parameters |
Type of School 10 |
Type of School 12 |
Regular or Distant |
|||
|
6 |
Marketing Aptitude |
Sales Result Oriented |
Sales Multitask |
Sales Inquisitive |
Sales Flexible |
Sales Charismatic |
Sales People |
|
7 |
Cognitive Aptitude |
Cognitive Skills Articulate |
Cognitive Skills Proficient |
Cognitive Skills Logical |
|||
|
8 |
Leadership Skills |
HrScore |
HrPer |
||||
|
9 |
Core Technical Skills |
Automata Score |
Automata Per |
Computer Prog Score |
CS Score |
Excel Score |
Computer Prog Per |
|
10 |
Finance Aptitude |
Fascore |
faper |
||||
|
11 |
English Aptitude |
EnglishSco re |
EnglishPer |
Vocabulary |
Grammar |
Comprehen sion |
Communica tion |
|
12 |
Quantitative Aptitude |
QuantScore |
QAper |
||||
|
13 |
Logical Aptitude |
LogicalSco re |
LAper |
InductiveR easoning |
DeductiveR easoning |
AbductiveR easoning |
|
|
14 |
Mathematical Aptitude |
Basic Mathematic s |
Engineerin g Mathematic s |
Applied Mathematic s |
|||
|
15 |
Personality /Psycometric Aptitude |
Personality Score |
Personality Per |
Agreeablen ess |
Extraversio n |
Nueroticis m |
Conscientio usness |
-
C. Clustering and Classification Algorithms used for Model
For the purpose of clustering, the k-means kernel is used. It uses kernels to approximate the distance between objects and clusters. This algorithm is quadratic. It is necessary to sum over all elements of a cluster to calculate one distance [23].
A number of classification techniques are available, each having its own advantages and disadvantages. Attributes of data set are a mix of polynomial and numerical data types; hence algorithms which could handle such data are considered.
Major classification techniques used for the proposed model are as follows:
Simple CART: It is a binary decision tree constructed by splitting a node into two child nodes repeatedly, beginning with the root node that contains the whole learning sample. The growth of the tree is done by choosing a split among all the possible splits at each node so that the resulting nodes are “purest” [24].
k-Star: k-Star is an instance-based classifier. It uses an entropy-based distance function. A test instance is based upon the class of those training instances, which are similar to it and as determined by similarity function [25].
Random Tree: The classifier is resistant to over fitting. It is a collection of individual decision trees, where each tree is generated from different samples and subsets of the training data [26].
Random Forest: Random Forests grow many classification trees. It does not over fit. It runs efficiently on large data bases. It can handle multiple input variables without variable deletion [27].
Aforesaid classifiers, when implemented with proposed model performed better than other classifiers as shown in Table 3 and were thus used for final implementation.
Table 3. Classification Accuracy of Classifiers with Proposed Model
|
S.No. |
Classifier |
Accuracy % (Model) |
|
1 |
Simple Cart |
81.11 |
|
2 |
kNN |
80.04 |
|
3 |
VFI |
66.57 |
|
4 |
VotedPeceptron |
56.33 |
|
5 |
REP Tree |
75.43 |
|
6 |
LMT |
80.57 |
|
7 |
J48 Graft |
74.19 |
|
8 |
J48 |
73.86 |
|
9 |
ADT Tree |
68.24 |
|
10 |
Random Forest |
85.96 |
|
11 |
Random Tree |
82.9 |
|
12 |
IB1 |
75.41 |
|
13 |
Kstar |
82.11 |
|
14 |
Ibk |
75.43 |
|
15 |
DTNB |
77.09 |
-
D. Performance Measures
10-fold cross-validation is chosen as an estimation approach to obtain a reasonable idea of model performance since there is no separate test data set. This technique divide training set into 10 equal parts, 9 is applied as a training set for making machine algorithm learn and 1 part is used as test set. This approach is enforced 10 times on the same dataset, where every training set act as test set once. The performance of the model is measured by classification accuracy, kappa, and F1 Score.
An algorithm x depends on the number of samples correctly classified (true positives + true negatives), thus defines the classification accuracy Ax as shown in Equation 1.
t
Ax = (1) n *100
Where, t is the number of instances correctly classified, and n is the total number of instances [28]. Classification accuracy is typically not enough information to make a decision on effectiveness of the model. Thus other parameters are also taken into consideration [29].
F1 Score is the harmonic mean of Precision and Recall. Therefore, this score takes both false positives and false negatives into consideration [30]. The formula for F1 Score is shown in Equation 2.
Re call * Pr ecision
2* (2)
Re call + Pr ecision
Kappa is yet another measuring method, which can be used as a performance indicator.
Kappa Statistics is a normalized value of agreement for chance. It can be described as K as shown in Equation 3.
P (A ) - P (E )
1 — P ( E )
where P (A) is percentage agreement and P (E) is chance agreement. If K =1 than agreement is ideal between the classifier and ground truth If K=0, it indicates there’s a chance of agreement. [28]. Fuzzy approaches are also gaining popularity in many areas [31].
-
IV. Proposed Model: Three- Level Model Construction
RapidMiner Studio Educational Version 7.4.000 is used to implement machine learning algorithms. Pictorial representation of the three-level model is depicted in Fig. 1 and the detail of each level is further depicted in Fig. 2 and Fig. 3.
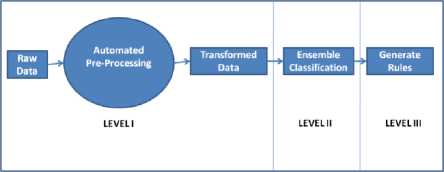
Fig.1. Proposed Model
Proposed Model works at three levels. 1st Level implements the concept of automated pre-processing, where raw data is converted to refined data. Then it is taken further at 2nd Level for classification. Last 3rd Level generates rules to facilitate decision making.
Level I: Automated Pre-Processing with Two- Level Clustering
An innovative approach is used for preprocessing the raw data to the transformed data set. Proposed automated pre-processing reduces dimensionality, find a relevant set of attributes and provide a refined, transformed dataset, which can further be readily used for better classification results. Fig. 2 represents pictorial representation of two-level clustering for automated pre-processing.
As shown in Fig. 2, at level I-A, the raw data set is first balanced by Sample Bootstrapping and equal instances of each class are taken into consideration. K- means (kernel) clustering is applied on the balanced data set (7000 instances with 151 attributes) by transposing attributes to instances and vice versa. This produces two sets of clusters with a related set of attributes put together. Filtered both the clusters and re-transposed for classification. Simple Cart classification is then applied on both the clusters. Cluster with better classification accuracy is selected and taken further to the second level.
At level I-B, chosen cluster is transposed again for second level clustering. K- means (kernel) clustering is re-applied on chosen cluster. After second level clustering, two clusters are obtained by filtration. Transpose both the clusters and apply Chi-Square to select top attributes with maximum relevance from each cluster. Finally, join both sets to obtain final refined and transformed dataset with 12 attributes and 7000 instances.
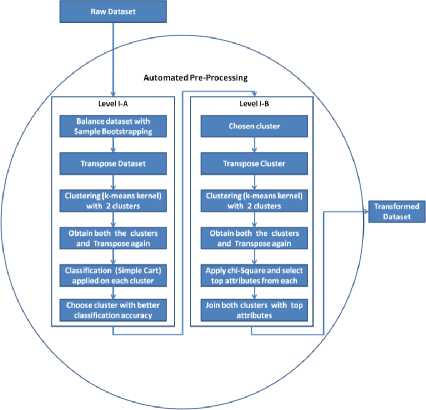
Fig.2. Level I of Proposed Model
This automated approach helps in fast and easy selection of relevant attributes from a large pool of attributes and also enhance the quality of dataset for classification. Thus, result in improved classification accuracy.
Level II: Ensemble Classification by Voting
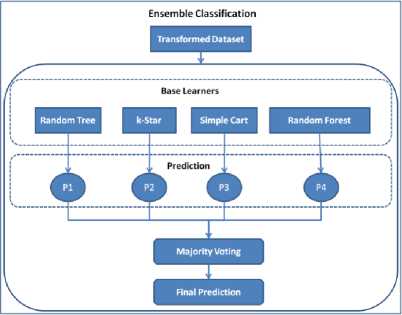
Fig.3. Level II of Proposed Model
At second level transformed data set derived from level I is taken further for classification. Instead of choosing one method for classification, voting ensemble method is used for improved classification accuracy. Random Tree, K-Star, Simple Cart, Random Forest are selected as base learners due to better classification accuracy than other classifiers when applied alone as shown in Table 3 earlier.
Vote method uses the vote of each learner for classification of an instance; the prediction with maximum votes is taken into consideration. It uses predictions of four base learners to make a combined prediction (using simple majority voting method). Fig. 3 depicts the working of ensemble classification in pictorial form.
Level III: Generate Rules
Rules are generated by the simple method of converting trees to rules. Trees formed during the process indicated the significant role of Graduation State as shown in partial Cart Decision tree and partial Random Tree in Fig. 4 and Fig. 5 respectively.
CART Decision Tree graduationState=(Assam)|(Goa)|(Jharkhand)|(Jammu and Kashmir)|(R
| Graduationuniv=(State)|(Private)|(1)|(Deemed)
| | Englishper < 42.43888888888889
| | | quantscore < 517.5
| | | | Englishper < 29.625
| | | | | quantscore < 329.5
| | | | | | graduationState=(Gujarat)|(Madhya Pradesh)
| | | | | | | Computerprogscore < 317.5: Placed(4.34/0.18)
| | | | | | | Computerprogscore >= 317.5
| | | | | | | | quantscore < 150.0: Placed(1.08/0.04)
| | | | | | | | quantscore >= 150.0
| | | | | | | | | Logicalscore < 325.0: Placed(1.17/1.09)
| | | | | | | | | Logicalscore >= 325.0
| | | | | | | | | | graduationState=(Gujarat): Placed(0.34/0.18)
| | | | | | | | | | graduationState!=(Gujarat): Unplaced(4.0/0.0)
| | | | | | graduationState!=(Gujarat)|(Madhya Pradesh)
-
Fig.4. Partial Cart Tree
RandomTree graduationState = West Bengal
| 12th = A
| | Graduationuniv = Private
| | | Computerprogscore < 595 : Unplaced (7/0)
| | | Computerprogscore >= 595
| | | | Logicalscore < 575 : Unplaced (2/0)
| | | | Logicalscore >= 575 : Placed (1/0)
| | Graduationuniv = State : Unplaced (0/0)
| | Graduationuniv = Deemed : Unplaced (0/0)
-
Fig.5. Partial Random Tree
Thus, the aforesaid model is further applied to 3 different datasets (State-wise). All the states with more than 500 set of instances such as Maharashtra with 958 instances, Uttar Pradesh (UP) with 1192 instances and Andhra Pradesh (AP) with 576 instances were chosen and experimented upon. The results are shown in Table 4.
Table 4. State wise results with Proposed Model
|
State |
Accuracy (%) |
F1 Score |
Kappa |
|
Maharashtra |
96.78 |
96.8 |
0.936 |
|
AP |
90.6 |
90.5 |
0.812 |
|
UP |
83.82 |
83.6 |
0.676 |
All the above results are quite noteworthy to predict the employability factor of any student in a particular state. Thus, is quite reasonable to be used further for decision support system. Sample Rules generated for Maharashtra State, where example set has 858 correct rules out of 900 training examples are shown below.
Rules Generated
-
1. if quantscore > 462.500 and Englishscore > 352.500 and Logicalscore > 380 and Englishscore > 457.500 then Placed (27 / 345)
-
2. if quantscore > 462.500 and Englishscore > 352.500 and Logicalscore > 380 and Englishscore ≤ 457.500 and Logicalscore > 505 and quantscore > 492.500 then Placed (10 / 40)
-
3. if quantscore > 462.500 and Englishscore > 352.500 and Logicalscore > 380 and Englishscore ≤ 457.500 and Logicalscore > 505 and quantscore ≤ 492.500 and Englishscore > 365 then Unplaced (9 / 0)
-
4. if quantscore > 462.500 and Englishscore > 352.500 and Logicalscore > 380 and Englishscore ≤ 457.500 and Logicalscore > 505 and quantscore ≤ 492.500 and Englishscore ≤ 365 then Placed (0 / 5)
-
5. if quantscore > 462.500 and Englishscore > 352.500 and Logicalscore > 380 and Englishscore ≤ 457.500 and Logicalscore ≤ 505 then Unplaced (34 / 0)
-
6. if quantscore > 462.500 and Englishscore > 352.500 and Logicalscore ≤ 380 then Unplaced (3 / 0)
-
7. if quantscore > 462.500 and Englishscore ≤ 352.500 then Unplaced (26 / 0)
-
8. if quantscore ≤ 462.500 and Englishscore > 655 then Placed (0 / 26)
-
9. if quantscore ≤ 462.500 and Englishscore ≤ 655 and Logicalscore > 652.500 then Placed (0 / 4)
-
10. if quantscore ≤ 462.500 and Englishscore ≤ 655 and Logicalscore ≤ 652.500 and Englishscore > 445 and quantscore > 450 and Englishscore > 475 then Placed (1 / 6)
-
11. if quantscore ≤ 462.500 and Englishscore ≤ 655 and Logicalscore ≤ 652.500 and Englishscore > 445 and quantscore > 450 and Englishscore ≤ 475 then Unplaced (2 / 0)
-
12. if quantscore ≤ 462.500 and Englishscore ≤ 655 and Logicalscore ≤ 652.500 and Englishscore > 445 and quantscore ≤ 450 and Logicalscore > 430 and Logicalscore > 437.500 and Logicalscore > 490 and Englishscore > 550 and Englishscore > 562.500 then Unplaced (3 / 0)
-
13. if quantscore ≤ 462.500 and Englishscore ≤ 655 and Logicalscore ≤ 652.500 and Englishscore > 445 and quantscore ≤ 450 and Logicalscore > 430 and Logicalscore > 437.500 and Logicalscore > 490 and
-
14. if quantscore ≤ 462.500 and Englishscore ≤ 655 and Logicalscore ≤ 652.500 and Englishscore > 445 and quantscore ≤ 450 and Logicalscore > 430 and Logicalscore > 437.500 and Logicalscore > 490 and Englishscore ≤ 550 and Englishscore > 457.500 then Unplaced (21 / 0)
-
15. if quantscore ≤ 462.500 and Englishscore ≤ 655 and Logicalscore ≤ 652.500 and Englishscore > 445 and quantscore ≤ 450 and Logicalscore > 430 and Logicalscore > 437.500 and Logicalscore > 490 and Englishscore ≤ 550 and Englishscore ≤ 457.500 then Placed (2 / 3)
-
16. if quantscore ≤ 462.500 and Englishscore ≤ 655 and Logicalscore ≤ 652.500 and Englishscore > 445 and quantscore ≤ 450 and Logicalscore > 430 and Logicalscore > 437.500 and Logicalscore ≤ 490 then Unplaced (36 / 0)
-
17. if quantscore ≤ 462.500 and Englishscore ≤ 655 and Logicalscore ≤ 652.500 and Englishscore > 445 and quantscore ≤ 450 and Logicalscore > 430 and Logicalscore ≤ 437.500 and quantscore > 362.500 then Unplaced (4 / 0)
-
18. if quantscore ≤ 462.500 and Englishscore ≤ 655 and Logicalscore ≤ 652.500 and Englishscore > 445 and quantscore ≤ 450 and Logicalscore > 430 and Logicalscore ≤ 437.500 and quantscore ≤ 362.500 then Placed (1 / 11)
-
19. if quantscore ≤ 462.500 and Englishscore ≤ 655 and Logicalscore ≤ 652.500 and Englishscore > 445 and quantscore ≤ 450 and Logicalscore ≤ 430 then Unplaced (59 / 0)
-
20. if quantscore ≤ 462.500 and Englishscore ≤ 655 and Logicalscore ≤ 652.500 and Englishscore ≤ 445 then Unplaced (201 / 0)
Englishscore > 550 and Englishscore ≤ 562.500 then Placed (1 / 10)
correct: 858 out of 900 training examples.
Henceforth, this three-level model first selects a relevant set of attributes automatically, secondly classify and thirdly generate rules to assist in decision making. Next Section compares the results of classifiers with proposed model.
-
V. Results
The performances of 10 predictive algorithms on the aforesaid dataset (7143 attributes with 151 attributes) to predict students’ employability (i.e. Placed / Unplaced in On-Campus Placements) were experimented upon. Because of inherent tribulations of unbalanced, multidimensional, large data set, classifiers alone could not perform well. Proposed model is then applied and automated preprocessing is done to convert raw data set to transformed data set. Further transformed data set was applied on individual classifiers.
The results show significant improvement in terms of F1 Score as shown in Table 5. Results clearly depict model performance over classification techniques.
Table 5. Comparative F1 Score of Proposed Model with Classifiers
|
F1 Score |
||
|
Classification Only |
Proposed Model |
|
|
Simple Cart |
62.9 |
82.06 |
|
kNN |
33.1 |
78.4 |
|
Voted Peceptron |
45.2 |
61.6 |
|
J48 Graft |
51.7 |
74.8 |
|
J48 |
51.7 |
74.5 |
|
IB1 |
32.9 |
76.2 |
|
Kstar |
22.1 |
83.7 |
|
Ibk |
32.8 |
76.3 |
|
ADT Tree |
63.5 |
68.4 |
|
VFI |
57.8 |
64.3 |
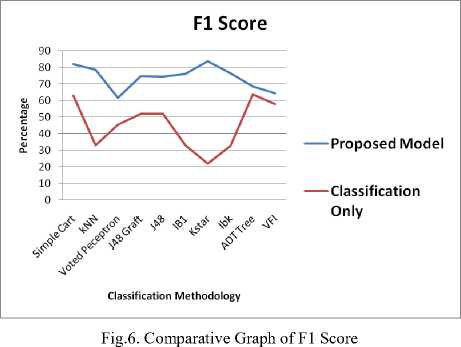
Fig. 6 illustrates a comparative graph of F1 Score. Proposed Model outperforms individual classifiers.
Model performance can be proved further with the Statistical method of the t-test.
Hypothesis defined:
Ho: There is no significant difference in F1 score of
Classifiers as compared to Proposed Model
Ha: There is significant difference in F1 score of
Classifiers as compared to Proposed Model t-Test: Paired Two Sample for Means was conducted between the results of F1 Score of Classification only and when the same algorithms were applied with Proposed Model. Results in Table 6 reflect that the improvement is significant.
Results demonstrate that t Stat > t Critical two-tail. At 5% level of significance Ho is rejected; thus proved that there is a significant difference between mean F1 Score (45.37) of classifiers when applied alone as compared to same classifiers when applied using Proposed Model (74.026). Further, the Proposed Model is having less variability (52.07) as compared to variability in Classification Only (208.46). Hence the proposed Model excels.
Table 6.-test Results proves the efficiency of proposed model.
t-Test: Paired Two
Sample for Means
|
Proposed Model |
Classification Only |
|
|
Mean |
74.026 |
45.37 |
|
Variance |
52.07076 |
208.469 |
|
Observations Pearson |
10 |
10 |
|
Correlation |
-0.433534894 |
|
|
Hypothesized Mean Difference |
0 |
|
|
df |
9 |
|
|
t Stat |
4.837683844 |
|
|
P(T<=t) one-tail |
0.000461995 |
|
|
t Critical one-tail |
1.833112923 |
|
|
P(T<=t) two-tail |
0.00092399 |
|
|
t Critical two-tail |
2.262157158 |
At Level 1, Two-Level automated pre-processing is done as proposed in the model. It reduces and refines large attribute set, balance classes and make it ready for classifiers. Thus outperforms better than individual classifier. The graph clearly showcases model performance over individual classifiers with maximum F1 Score of 83.7% and 82.06% given by kStar and Simple Cart respectively.
Now, at Level II, Best performing classifiers were further ensemble together to integrate the prediction accuracy of individual classifiers. The vote is used to ensemble top 4 classifiers namely, Simple Cart, kStar, Random Forest and Random Tree. Vote ensemble applies all four classifiers from its sub-process and assigns the predicted class with maximum votes to the example. This combines and integrates the results of all base classifiers to enhance the classification performance. Table 7 displays the result obtained after applying complete model with Level I and Level II on raw data.
Table 7. Model Performance with Complete Raw Data
|
Model Performance with complete Raw Data (Instances 7143, Attributes 151) |
||||
|
Accuracy (%) |
F1 Score (%) |
Kappa |
Weighted Mean Recall (%) |
Weighted Mean Precision (%) |
|
87.51 |
87.7 |
0.750 |
87.51 |
87.57 |
As shown in Table 7, combined result improved the performance from prior 83.7% F1 Score (maximum with kStar) to 87.7% when combined with Vote ensemble.
Moreover, when Model was applied further to the level of individual States, as described earlier in Table 4 enhances the performance of Model radically with 96.8% F1 Score in the case of Maharashtra. Table 8 displays the results obtained for Maharashtra State, which clearly
Table 8. Model Performance with State (Maharashtra)
|
Model Performance with State (Maharashtra) Raw Data (Instances 958, Attributes 151) |
||||
|
Accuracy (%) |
F1 Score (%) |
Kappa |
Weighted Mean Recall (%) |
Weighted Mean Precision (%) |
|
96.78 |
96.8 |
0.936 |
96.78 |
96.88 |
-
VI. Conclusions
Results evidently provide facts that students’ employability prediction can be enhanced by applying proposed model. The model provides a generalized solution to Students’ Employability prediction and is scalable, thus can act as a base for developing unified decision support system in education domain.
Once the Model was applied State-wise on three different datasets, eight attributes were found common, which plays a significant role in predicting Students’ Employability in terms of Placed/Unplaced in the very first year of their enrollment. They are Age, Percentage in Secondary Exam, English Score, English Percentage, Logical Score, Logical Percentage, Quantitative Score, Quantitative Percentage, Logical Score and Logical Percentage. Scores represent the individual score of the student after conducting aptitude test and percentage reflects his/her performance in batch among peer students, who all attempted the test.
Further, rules derived from the model emphasize on Scores and Percentage of aptitude test. Thus, the performance of the student in final placements can be improved by taking proactive actions in the beginning of 1st Semester. As soon as the student is enrolled in the course, Institute must conduct aptitude test taking into account English, Quantitative and Logical Ability into consideration. As per the score obtained in the test, students must be trained in further semesters in their respective weak areas (English, Quantitative or Logical). In between also these tests must be conducted to monitor students’ progress. This will ensure the customized individual approach to improve every student performance in final placements.
-
VII. Future Scope
The model works effectively on large, multivariate, unbalanced and heterogeneous data set. This model can be used in aiding decision support system of education domain. Basic capability of the model is to handle complicated data set and can further be applied in different domains such as marketing and banking. Fuzzy data mining approaches can also be tested in future.
References A Unified Model of Clustering and Classification to Improve Students’ Employability Prediction
- http://indiatoday.intoday.in/education/story/60-of-engineering-graduates-unemployed/1/908241. html
- http://indiatoday.intoday.in/education/story/engineering-employment-problems/1/713827.html
- Thakar, Pooja, and Anil Mehta. "Cluster Model for parsimonious selection of variables and enhancing Students' Employability Prediction." International Journal of Computer Science and Information Security 14.12 (2016): 611.
- Mishra, Tripti, Dharminder Kumar, and Sangeeta Gupta. "Students’ Employability Prediction Model through Data Mining." International Journal of Applied Engineering Research 11.4 (2016): 2275-2282.
- Jantawan, Bangsuk, and Cheng-Fa Tsai. "The Application of Data Mining to Build Classification Model for Predicting Graduate Employment." International Journal Of Computer Science And Information Security (2013).
- Hu, Zhengbing, et al. "Possibilistic Fuzzy Clustering for Categorical Data Arrays Based on Frequency Prototypes and Dissimilarity Measures." International Journal of Intelligent Systems and Applications (IJISA) 9.5 (2017): 55-61.
- Catal, Cagatay, and Mehmet Nangir. "A sentiment classification model based on multiple classifiers." Applied Soft Computing 50 (2017): 135-141.
- Maina, Elizaphan M., Robert O. Oboko, and Peter W. Waiganjo. "Using Machine Learning Techniques to Support Group Formation in an Online Collaborative Learning Environment." International Journal of Intelligent Systems & Applications 9.3 (2017).
- Bhanuprakash, C., Y. S. Nijagunarya, and M. A. Jayaram. "Clustering of Faculty by Evaluating their Appraisal Performance by using Feed Forward Neural Network Approach." International Journal of Intelligent Systems and Applications 9.3 (2017): 34.
- Chaudhury, Pamela, et al. "Enhancing the capabilities of Student Result Prediction System." Proceedings of the Second International Conference on Information and Communication Technology for Competitive Strategies. ACM, 2016.
- Elbadrawy, Asmaa, R. Scott Studham, and George Karypis. "Collaborative multi-regression models for predicting students' performance in course activities." Proceedings of the Fifth International Conference on Learning Analytics And Knowledge. ACM, 2015.
- Rogers, Tim, Cassandra Colvin, and Belinda Chiera. "Modest analytics: using the index method to identify students at risk of failure." Proceedings of the Fourth International Conference on Learning Analytics And Knowledge. ACM, 2014.
- Sanchez-Santillan, Miguel, et al. "Predicting Students' Performance: Incremental Interaction Classifiers." Proceedings of the Third (2016) ACM Conference on Learning@ Scale. ACM, 2016.
- Pandey, Mrinal, and S. Taruna. "Towards the integration of multiple classifier pertaining to the Student's performance prediction." Perspectives in Science8 (2016): 364-366.
- Alfiani, Ardita Permata, and Febriana Ayu Wulandari. "Mapping Student's Performance Based on Data Mining Approach (A Case Study)." Agriculture and Agricultural Science Procedia 3 (2015): 173-177.
- Rahmat, Normala, Yahya Buntat, and Abdul Rahman Ayub. "Determination of Constructs and Dimensions of Employability Skills Based Work Performance Prediction: A Triangular Approach." International Journal of Economics and Financial Issues 5.1S (2015).
- Thakar, Pooja, and Anil Mehta. "Role of Secondary Attributes to Boost the Prediction Accuracy of Students’ Employability Via Data Mining." International Journal of Advanced Computer Science & Applications 11.6 (2015): 84-90.
- Finch, David J., Leah K. Hamilton, Riley Baldwin, and Mark Zehner. "An exploratory study of factors affecting undergraduate employability." Education+ Training 55, no. 7 (2013): 681-704.
- Bakar, Noor Aieda Abu, Aida Mustapha, and Kamariah Md Nasir. "Clustering Analysis for Empowering Skills in Graduate Employability Model." Australian Journal of Basic and Applied Sciences 7.14 (2013): 21-28.
- Jamaludin, Nor Azliana Akmal, and Shamsul Sahibuddin. "Pilot Study of Industry Perspective on Requirement Engineering Education: Measurement of Rasch Analysis." Editorial Preface 4.8 (2013).
- Piad, Keno C., et al. "Predicting IT employability using data mining techniques." Digital Information Processing, Data Mining, and Wireless Communications (DIPDMWC), 2016 Third International Conference on. IEEE, 2016.
- Rashid, Tarik A. "Improvement on Classification Models of Multiple Classes through Effectual Processes." International Journal of Advanced Computer Science and Applications (IJACSA) 6.7 (2015).
- Kim, Dae-Won, et al. "Evaluation of the performance of clustering algorithms in kernel-induced feature space." Pattern Recognition 38.4 (2005): 607-611.
- Denison, David GT, Bani K. Mallick, and Adrian FM Smith. "A bayesian CART algorithm." Biometrika 85.2 (1998): 363-377.
- Tejera Hernández, Dayana C. "An Experimental Study of K* Algorithm." International Journal of Information Engineering & Electronic Business 7.2 (2015).
- Aldous, David. "The continuum random tree II: an overview." Stochastic analysis 167 (1991): 23-70.
- Breiman, Leo. "Random forests." Machine learning 45.1 (2001): 5-32.
- Witten, Ian H., et al. Data Mining: Practical machine learning tools and techniques. Morgan Kaufmann, 2016.
- Chawla, Nitesh V. "Data mining for imbalanced datasets: An overview." Data mining and knowledge discovery handbook. Springer US, 2009. 875-886.
- Sokolova, Marina, and Guy Lapalme. "A systematic analysis of performance measures for classification tasks." Information Processing & Management 45.4 (2009): 427-437.
- Whig P, Ahmad SN (2017) Controlling the Output Error for Photo Catalytic Sensor (PCS) Using Fuzzy Logic. J Earth Sci Clim Change 8: 394. doi:10.4172/2157-7617.1000394
