Accelerated K-means Clustering Algorithm

Author: Preeti Jain, Bala Buksh
Journal: International Journal of Information Technology and Computer Science(IJITCS) @ijitcs
Article in issue: 10 Vol. 8, 2016.
Free access
Optimizing K-means is still an active area of research for purpose of clustering. Recent developments in Cloud Computing have resulted in emergence of Big Data Analytics. There is a fresh need of simple, fast yet accurate algorithm for clustering huge amount of data. This paper proposes optimization of K-means through reduction of the points which are considered for re-clustering in each iteration. The work is generalization of earlier work by Poteras et al who proposed this idea. The suggested scheme has an improved average runtime. The cost per iteration reduces as number of iterations grow which makes the proposal very scalable.
Clustering, k-means, Optimization of k-means, Distance metrics, Poteras et al's Scheme
Short address: https://sciup.org/15012564
IDR: 15012564
Text of the scientific article Accelerated K-means Clustering Algorithm
Published Online October 2016 in MECS
Clustering is a data analysis technique aiming at dividing the dataset into small groups such that data objects in a group are similar to each other on a common ground and dissimilar to objects in other groups. These small groups produced are called clusters. A requirement from any clustering algorithm is that it should produce clusters which exhibit high homogeneity (similarity) within a cluster and high heterogeneity (dissimilarity) between any two clusters. Though several clustering algorithms have been proposed till date, the K-means [1] has not lost its popularity. The simple non-hierarchical approach is only an outline and many details depend on the application and implementation. This flexibility of K-means makes it a honey pot for the researchers.
Apart from the fact that it has been more than 50 years since the algorithm was proposed, even recently, k-means as an unsupervised learning method is used for clustering in several applications, like image processing [2], pattern recognition[3] and partitioning in sensor networks [4] etc. The ease of implementation and robustness of the kmeans approach make it enough popular for supervised learning approaches too. Chittineni and Bhogapathi [5] have used k-means in conjunction with neural networks. Costa [6] have used kmeans for Sleep Spindles Classification.
The major issues related to use of k-means are how to decide initial position of cluster centers and what should be the convergence criteria. Initialization of K-means is a well-studied problem. Due to heuristic in nature, research is still on as to how to select the initial centroids as close as the ideal centers of the desired clusters. An initialization method or a method to compute distance of points from centroids is an optimization towards accuracy rather than speed because k-means is generally considered fast and scalable. Yet, there is much scope for optimizing k-means in terms of runtime.
When optimization to K-means is to be done for speed then the focus is on either reducing the number of iterations or reducing the effort required for each iteration. This paper proposes an optimization to reduce the effort spent in each iteration by decreasing the number of data points to be re-clustered. Thereafter, different distance metrics are used to observe the effect on computational effort required per iteration.
Rest of the paper is organized as follows: Section 2 outlines the related work in the direction of reducing effort per iteration of k-means and the Poteras et al’s scheme. Section 3 contains the description of the proposed clustering algorithm which is an improvement of Poteras et al’s work. Section 4 provides an in-depth analysis of the proposal through the results of the experiments done on real-life datasets. Comparison of the proposal with prior related works is also provided.
-
II. R ELATED W ORK
The K-means algorithm is a very popular method for summarizing data in both clustering and non-clustering applications. Though simple and flexible, the thought that it is scalable enough is now being revisited. Increasing size of data needs faster version of this simple algorithm. This section outlines the k-means approach and briefly mentions the research works done to reduce time-cost through reduction in effort-per-iteration. A subsection is dedicated to a recent contribution by Poteras et al which is extended in our proposal.
-
A. K-Means
The popular K-means algorithm aims to group a given dataset into k clusters. K-Means is based on minimizing the average squared distance between the data items in the dataset and the cluster’s centre called its centroid. The main steps involved in K-means are:
-
1) Take an initial guess of k centroids which
represent the clusters.
-
2) Assign each data point to the cluster of nearest centroid.
-
3) Update values of centroids.
-
4) Repeat steps 2 and 3 until convergence.
Though k-means is a scalable, simple and very flexible algorithm; this very feature that many steps have not been precisely mentioned in the original proposal lead to certain drawbacks. Firstly, the performance of the algorithm depends heavily on the initial values of centroids. Secondly, the mathematical formulation used to compute nearness of any two points also has an effect on the final cluster structure. Thirdly, the criterion for convergence needs to be decided according to the application. Last, it needs to be adapted according to the dataset being clustered because the original k-means is intended only for numerical data.
With passing years, a number of extensions to the standard k-means algorithm have been proposed, the majority of which are focused on improving the initialization problem of k-means. Among the first works were the CICA [7] and the K-Means++ algorithm [8] proposed by Khan-Ahmad and Arthur-Vassilvitskii respectively. Khan and Ahmad, in 2004 proposed a CICA (Centre Initialization Centre Algorithm) [7] considering that an individual attribute may provide some information about initial cluster centre. CICA first computes the cluster centers for individual normally distributed attributes by using K-Mean over this attribute and instead of providing random cluster centres, centres that are far apart are reached for excluding outliers. At the end, each attribute value of this attribute is associated with some clusters. Repeating the same process over the entire data set, we obtain a pattern string of m clusters. Arthur and Vassilvitskii [8] proposed a randomized seeding technique to initialize the cluster centers. After the initialization, the algorithm continues using the standard K-Means. The proposed initialization assures O(log k) competitiveness to the optimal K-Means solution. Su and Dy [9] then proposed two linear, deterministic and order variant hierarchical initialization methods for k-means: Var-Part and PCA-Part (Principal Component Analysis Part). Celebi and Kingravi [10] further modified the two initialization methods of Su and Dy and proposed a discriminant analysis based initialization approach. These algorithms aimed to improve the quality of the clustering. Another considerable area for improvement is the runtime of the standard k-means. Runtime improvements are discussed in the next section. In [11], Elhabbash proposes methods for finding initial clusters based on some rough set theory concepts and reverse nearest neighbor search and for determining the number of clusters with detailed analysis.
-
B. Approaches to reduce cost per iteration in K-means
It can be observed in K-means [1] that at each iteration, all the data points are checked and assigned to clusters. But very few points change their cluster. The number of points that change their cluster decreases as the algorithm proceeds towards convergence. If the points which will not change their cluster further can be identified at each iteration, they can be removed from consideration from next iteration. There have been proposed various approaches for recognizing such points and thereby reducing cost per iteration in K-means. These can be further classified as Memory-Intensive approaches and Distance based approaches.
The Memory-Intensive approaches as in [12, 13]
involve storing some information in each iteration to be used in the future iterations. These approaches start with keeping track of as to for how many iterations a point has not changed its cluster and removes the point when stability is detected. Authors in [12] proposed that instead of calculating distance of a data point from all centers, more effective step would be to limit these iterations to consider only the distance from the nearest center keeping in memory the results from the previous iterations. The first iteration would include calculating the distance from the nearest cluster and the successive iteration will compute the distance from the previous nearest cluster. The data point stays in the cluster if the new computed distance was equal to or less than the previous distance thereby eliminating the need of computing distances from the other remaining centers and hence saves time and computation cost. Their proposed algorithm requires a single data structure to keep track of previous information. The authors in [13] then proposed the same idea using two data structures, one for storing a cluster’s label and the other for the other for storing distance of a data point from its corresponding cluster center. Both incur a time complexity of О (и к) where Л is the number of points and £ is the number of clusters.
Second method is to take advantage of Euclidean Geometry principles. K-means works towards partitioning the data space (Euclidean space of m dimensions) into spheres of varying sizes. The centers of the spheres are centroids and each sphere is a separate cluster. The points which lie nearer to centers are less likely to change the cluster. So each temporary cluster sphere has a core sphere which does not change. In fact the radius of core sphere grows and stabilizes towards convergence. The method to detect the points lying on the periphery of cluster (that are more likely to change cluster) uses generally triangle inequality. Triangle inequality is used to compute the distance of a data point from its closest center which is undoubtedly less than its distance from the other centers for the purpose of clustering. The triangle inequality could be used for the following
-
i. Calculating distance from a center to its closest other center. [14,15,16], Compare-means algorithm in [17] and Annular and Heap algorithms in [18] used this approach for effective clustering.
-
ii. Calculating distance of a center from all the other centers. This approach was used by [14] and Sortmeans algorithm in [17].
-
iii. Putting upper bound on point-center distances. Ref [14,15,16] and Annular and Heap algorithms [18]
are the proposals based on this approach.
-
iv. Putting lower bounds on point-center distances. A lower bound к suggested in[14] was reduced to 1 by authors in [5]. Similarly, constant bound of 1 is used in Annular algorithm [18], and 0 by Heap algorithm [18]. A trade-off between k and 1 is set as a number by authors in [16].
-
v. Sorting all centers by distance from a center and repeating the same for all centers. Sort-means in [17] uses this approach.
-
vi. Sorting all centers by their vector norm as done by authors in Annular algorithm [18].
Concepts i and ii have been used by Poteras et al [19] and consequently in this proposed variant of K-means.
-
C. Poteras et al’s K-means
This method suggested by Poteras, Mihaescu and Mocanu [19] uses the concept of distances. Specifically, if the difference of distances of a point from its own centroid and other centroids is below a threshold, it is a border point and very likely to change the cluster in next iteration. This threshold in turn is again a numerical value. Instead of having a single such value, intervals of values are computed. The difference of distance of a point from its center and the distance of a point from other closest center is referred as Sy . The standard deviation of Sy is used as a decision criteria. At each iteration, points belonging to certain (smallest) interval are ignored, and rest others are re-clustered. Number of points considered in each iteration decreases continuously as the algorithm converges. The algorithm is referred to as P-Kmeans in the entire paper and can be summarized as:
Algorithm 1: P-Kmeans
Step 1: Define constant WIDTH
Step 2: Define intervals
/; = [i • WIDTH. (t +1) - 1И0ГЯ] and tag them with value t * WIDTH '
Step 3: Mark the entire dataset to be visited.
Step 4: For each point to be visited
Step 5: Compute e = min(dpC[ — d^^J where cw is the center of the winner (closest) cluster and C;A = 1..кД = w stands for all other centroids.
Step 8: Update ^i ’s tag by subtracting 2*D (points owned by this interval got closer to the edge by 2*D)
Step 9: Pick up all points inside intervals whose tag is less or equal to 0, and go to 4 to revisit them.
-
III. P ROPOSED C LUSETRING A LGORITHM
P-Kmeans limited the range of data set from 0 to 1 and therefore, proposed a fixed value of WIDTH. Our proposed scheme further generalizes the P-Kmeans by computing WIDTH in accordance with the dataset used. The idea is to derive the value of WIDTH based on characteristics of the dataset so that the algorithm can be used without any preprocessing of the data involved. This is done by first computing expa nse which is the range of the space covered by all the data points along every dimension. Out of all the attributes of the dataset, we pick the attribute with minimum expanse so as to not overlook the data points covering small range. WIDTH should be derived from the smallest expanse. So, we compute WIDTH as 10% of the minimum expanse which is in conformity to the P-Kmeans and this WIDTH can be adapted according to the dataset used. Formally the steps to compute width are given below.
Algorithm 2:COMPUTE_ WIDTH
Step 1: For all attributesЛр ^2> ••• > Лд| compute expanse.; = max(.4,) — min(-4;)
Step 2: Pick attribute with smallest expanse, p = argmin (erpa ns e)
Step 3: Compute WIDTH as
WIDTH = 0.1 * expa ns eg
After computing width of the dataset using Algorithm 2, we propose the generalized version of the P-Kmeans for clustering which works as follows
Algorithm 3: ACCELERATED K-MEANS
Step 1: Compute WIDTH using Algorithm 2.
Step 2: Compute number of intervals, njmterval as an integer with value
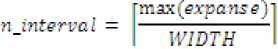
Step 3: Define intervals
I; = [i • WIDTH, (t + /) * IWDTH]. and tag them with value t * WIDTH , where 1 < i < n_:nt₽rvaf .
Step 4: Mark the entire dataset to be visited.
Step 5: For each point to be visited, perform Steps 6 to 8.
Step 6: Pick cw as centroid ofи winner cluster, based on nearest centroid to the data point; that is
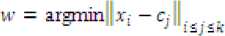
Where ^ is the number of clusters.
Step 7: Store the minimum difference of distances of a point from other centroids to its own centroid as
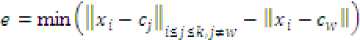
Step 8: Assign to interval г * WIDTH according to the criteria i * WIDTH < e < (t + 1) • WIDTH , 1 < i < n_:nf₽rvaJ .
Step 9: Store old centroids as c ; update centroid as means of data points in the centroid
Another real life dataset is that of Ionosphere data which indicates the condition as either good or bad. The values in dataset are measurements from 34 sensors. Since the clusters are distinct there is no much difference in cluster quality of P-Kmeans and proposed variant. Time consumed by the proposed variant is less than P-Kmeans in every dataset.
Cj = mean6q)j€l
Table 1. Comparison Of P-Kmeans With The Proposal On Real Life Datasets
Step 10: Compute deviation of centroids
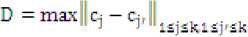
Where Cjr are old centroids
Step 11: Update ^i s tag by subtracting 2 * D (points owned by this interval got closer to the edge 2 * D)
Step 12: Pick up all points inside intervals whose tag is less or equal to 0, and go to Step 5 to revisit them.
-
IV. E XPERIMENTAL R ESULTS
-
A. Results on Real Life datasets
The proposed algorithm and P-Kmeans was implemented as MATLAB program and several runs of the algorithms were performed over both real life and synthetic datasets. The accuracy of the output clusters is measured through squared sum of errors (SSE). A lesser value of SSE indicates compact and dense clusters. The runtime is measured directly.
Popular real life datasets taken from UCI Repository [90] have been considered for experiments. The classic Iris dataset of three species of the iris flower, having 150 instances and 4 attributes is a dataset with one distinct cluster and two overlapping clusters. This classic problem is well solved by the proposed variant of K-means. Fig. 1 shows the cluster output for Iris data. Table 1 compares the proposal with P-Kmeans over runtime and cluster quality (SSE). Wine dataset having instances and attributes pertains to three possible clusters. All are overlapping. The proposed algorithm shows a great improvement in SSE as shown in Table 1.
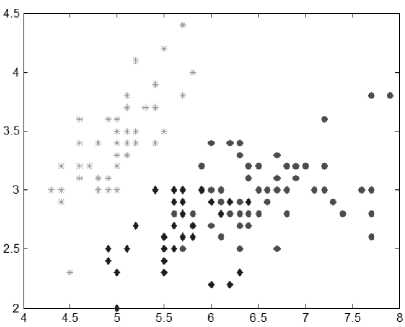
Fig.1. Cluster formation by Proposed algorithm for Iris dataset
|
Dataset |
Algorithm |
Squared Sum Error(SSE) |
Total Elapsed time(in seconds) |
|
Iris |
P-Kmeans |
106.6730 |
0.004225 |
|
Proposed |
79.4454 |
0.003644 |
|
|
Wine |
P-Kmeans |
4896800 |
0.018526 |
|
Proposed |
2700700 |
0.016908 |
|
|
Ionosphere |
P-Kmeans |
2923.80 |
0.008776 |
|
Proposed |
2435.10 |
0.007463 |
To check whether the proposed optimization preserves capability of original K-means, the experiments on synthetic datasets are conducted. Instead of comparing the runtime directly, the number of points that change cluster after initial situations and the total number of iterations performed before algorithm stops are observed. This gives real indication of time cost. Table 2 shows the recorded values for synthetic two-dimensional data for Standard K-means, P-Kmeans and proposed K-means. The number of instances is increased to observe the growth. The number of clusters, k, is fixed at 4. Consistent growth in the number of points that change their cluster in all algorithms proves that scalability is retained. Also, for every individual dataset the number of points changing cluster is lowest for the proposed K-means. Increase in the number of iterations is also same.
Table 2. Comparison Of Algorithms For Synthetic Dataset, K=4
|
n |
Algorithms |
Number of points that change cluster |
Iterations |
|
100000 |
Standard K-means [1] |
133748 |
4 |
|
P-Kmeans |
9905 |
2 |
|
|
Proposed |
8894 |
2 |
|
|
250000 |
Standard K-means |
280887 |
4 |
|
P-Kmeans |
20940 |
2 |
|
|
Proposed |
20940 |
2 |
|
|
500000 |
Standard K-means |
638204 |
4 |
|
P-Kmeans |
42254 |
2 |
|
|
Proposed |
28772 |
2 |
|
|
750000 |
Standard K-means |
830802 |
5 |
|
P-Kmeans |
81875 |
3 |
|
|
Proposed |
64420 |
3 |
-
B. Effect of Distance metrics
Proposed clustering algorithm uses a distance measure to check the similarity among two objects. The algorithm treats data objects as points in geometrical space, with attributes as dimensions. The distance between two points in one data space can then be measured through any geometrical distance. Effect of distance measure being used can be studied for the proposed algorithm, keeping other parameters fixed. Following distances are considered.
-
• Euclidean Distance Metric : Measured by
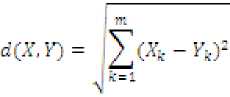
Where G is a distance with positive real values, defined between two points Xand ^ with л: dimensions each, that is А^ is value of kth dimension of point X.
-
• Squared Euclidean Distance Metric : Measured through

Where G is the square of distance with positive real values, defined between two points and У with n dimensions each.
• Manhattan Distance Metric : Measured through
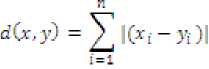
Where c is a distance with positive real values, defined between two points X and У with л dimensions each, that is is value of Zl^ dimension of point
-
• Chebychev Distance Metric : Measured through
d(X, У) = maxl^. - FJ
Where c is the maximum distance with positive real values, defined between two points X and ^ with к dimensions each, that is A^ is value of kck dimension of point X.
• Canberra Distance Metric : Measured through
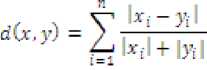
Where, is the distance between and ; points such thatX — (x1,X2,...,Xn)and У = <У1'У2.....Уп)
Results of the study of the proposed algorithm on different distance metrics is tabulated in Tables 3 for Iris, Wine and Ionosphere datasets and the corresponding SSE is noted. Square Euclidean distance metric outperforms all the others on all the three datasets.
Table 3. Study of Distance metrics for the real life datasets
|
Distance metric used |
Iris Dataset |
Wine Dataset |
Ionosphere Dataset |
|
Chebychev |
81.9262 |
3069700 |
2637.40 |
|
Manhattan |
102.2185 |
2862400 |
2558.30 |
|
Square Euclidean |
91.7853 |
2524100 |
2453.00 |
|
Canberra |
585.4163 |
16982000 |
3243.10 |
-
C. Scalability of Proposed Work
In Algorithm 1 of the proposal, all n data points are visited once and it involves every attribute m, so it will mount to complexity O(nm) . But, finding min and max functions have various implementations, so complexity can be lower than O(n?r?) . For Algorithm 2, Steps 2 and 8 will take 0(^0 where, ni is the number of intervals. Both Steps 6 and 7 take 0(k). Let t be the total number of iterations executed before converging and ^4- be the number of points to be visited. Then, the cost of one iteration will be 0(74- (nf + k) . л, is of 0(n)
theoretically, while it can be safely taken as
П; = 0(k) .Therefore, one iteration will take 0(n,k) . For t iterations, complexity will be 0 (ftp kt) . Worst case will be nL, = Л which makes total complexity O(nkt) , same as the standard k-means [3]. Therefore, K-means [3] is considered to be scalable because runtime is linear in terms of n (number of data points), m (number of attributes) and k (number of clusters). Now we need to empirically prove that the proposed optimizations do not adversely affect the scalability of k-means. Table 4 shows the growth of runtime for fixed m=2, k=2 and values of n varying from 1000 till 10000. Linear growth is observed as expected theoretically.
Table 4. Runtime of the proposed algorithm for varying n
|
Number of data points (n) |
Runtime (in seconds) |
|
1000 |
0.025395 |
|
2500 |
0.051532 |
|
5000 |
0.100180 |
|
7500 |
0.154173 |
|
10000 |
0.212810 |
Table 5 shows the runtime recorded for the proposed algorithm for values of m varying from 2 to 50 and fixed values of n =1000 and k=2. Generally, values of m in real life data are usually around 20. We extend the values till 50 to calculate growth effectively. The growth of runtime is observed practically constant because ‘m’ is not used much for computation of time complexity and used only for inner operations.
Table 5. Runtime of the proposed algorithm for varying m
|
Number of attributes (m) |
Runtime (in seconds) |
|
2 |
0.020153 |
|
4 |
0.020955 |
|
6 |
0.020000 |
|
10 |
0.019731 |
|
14 |
0.019841 |
|
18 |
0.020192 |
|
22 |
0.020943 |
|
26 |
0.022490 |
|
30 |
0.020500 |
|
34 |
0.020580 |
|
38 |
0.021483 |
|
42 |
0.021790 |
|
46 |
0.022889 |
|
50 |
0.025111 |
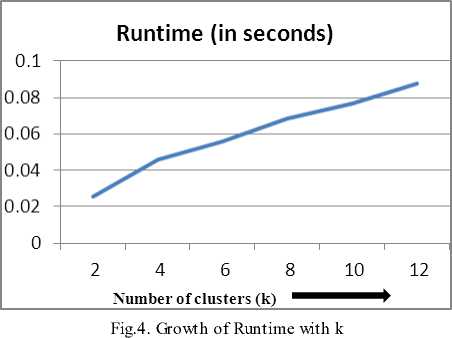
Table 6 shows runtime growth with fixed values of n=1000 and m=2 and varying values of k. Average number of clusters in almost all real life datasets are limited to 5 or 6 but we further increase the values of k till 12. The runtime is observed linearly increasing against values of k.
Table 6. Runtime of the proposed algorithm for varying k
|
Number of clusters (k) |
Runtime (in seconds) |
|
2 |
0.025395 |
|
4 |
0.045561 |
|
6 |
0.055833 |
|
8 |
0.068413 |
|
10 |
0.076718 |
|
12 |
0.087900 |
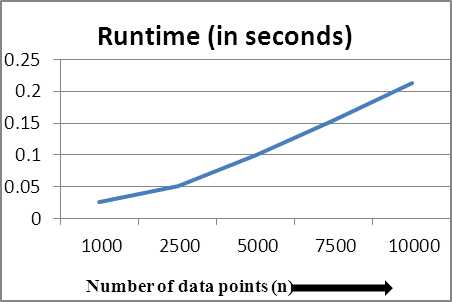
Fig.2. Growth of Runtime with n
To see the runtime growth pictorially, we plot graphs showing growth versus varying parameters. Fig 2 shows plot of runtime against varying n and is observed to be linearly increasing. Fig 3 shows the runtime growth versus changing values of m and is nearly constant. Fig 4 shows the linearly increasing runtime growth against increasing values of k.
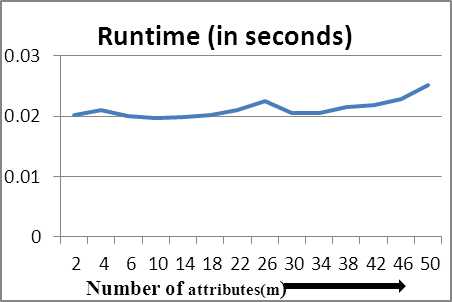
Fig.3. Growth of Runtime with m
-
D. Clustering Accuracy
Many clustering algorithms are not only judged through the cluster formation and shape but through accuracy of clusters obtained, that is how well the output resembles the desired clusters. K-means is equally popular in supervised learning. In order to observe how an improvement/optimization of k-means will perform when used in supervised learning, it should be checked for accuracy obtained over real life datasets. The actual cluster distribution of these datasets is already known. The accuracy can be measured as per any one of the following indices.
. number of correctly ciusterei aoints
-
1) Accuracy =------------—------------
- where 71 = number of data points
-
2) Fl Score - F1 score is the measure of accuracy considering Precision (Positive predictive value) and Recall (Sensitivity) to compute the score. Traditionally, it is the harmonic mean of Precision and Recall.
For Fl Score , we need to calculate Precision and Recall .
For any cluster t, Precis! on, or р; = —^7-
And Recalli orr,= ---7 ,
,
Where, ^Pl =True positive points,
/5- = False positive points and
^L = False negative points
Now, average precision, P = av- (pj and average Recall, Я = avg (r?) which makes
Я1 Score = т-7
Cluster accuracy recorded for the three real life datasets using the proposed algorithm are tabulated in Table 7.
Table 7. Calculation of accuracy of proposed algorithm over real life datasets
|
Dataset |
Accuracy |
F1 Score |
|
Iris |
0.906 |
0.915 |
|
Wine |
0.955 |
0.950 |
|
Ionosphere |
0.934 |
0.933 |
The results recorded in Table 7 do not carry much independent significance until they are compared with other similar proposals. Such proposals using same datasets for implementation and testing their works can be compared to with our proposal using their results over the datasets.
We compared our results with available results of Khan and Ahmad’s work [7], Enhanced k-means [11] and P-Kmeans [19]. Tables8 and 9 show the tabulated results of the comparison for accuracy and F1 score respectively. These results compare the accuracy and F1 score of the proposed algorithm from the related works.
Table 8. Comparison of Accuracy of the proposal with other works based on k-means
|
Datasets |
Khan and Ahmad [7] |
Enhanced k-means [11] |
P-K Means [19] |
Proposed Work |
|
Iris |
0.92 |
0.893 |
0.95 |
0.92 |
|
Wine |
0.95 |
0.759 |
0.76 |
0.95 |
|
Ionosphere |
NA |
NA |
NA |
0.93 |
Table 9. Comparison of F1 Score of the proposal with other works based on k-means
|
Datasets |
Khan and Ahmad [7] |
Enhanced k-means [11] |
P-K Means [19] |
Proposed Work |
|
Iris |
0.92 |
NA |
0.95 |
0.91 |
|
Wine |
0.95 |
NA |
0.78 |
0.95 |
|
Ionosphere |
NA |
NA |
NA |
0.93 |
The accuracy of the proposed work is at par with the accuracy of the related works tested in case of Wine dataset. When considering Iris dataset, the accuracy measures obtained are similar for Khan and Ahmad’s work [7], more than Enhanced K-means algorithm [11] and slightly less than the P-Kmeans [19]. We could not find accuracy results for ionosphere dataset in any optimized versions of the k-means clustering, so the related portion is mentioned NA (Not available). In terms of the F1 score, the proposed algorithm is found working better for the Wine dataset than the other related works compared. None of the other related works had tested their proposals on Ionosphere dataset. So the values are not available.
V. C ONCLUSION
Out of the numerous clustering algorithms proposed till date, the K-means has not lost its value and still continues to be a popular research area due to its simplicity, flexibility and scalability. However, it involves many iterations for distance computations between points and cluster centers and due to increased cost per iteration, the scalability of the algorithm gets hampered. Improving the algorithm in this aspect is a focus of many optimization researches. In this paper, an accelerated K-means is proposed in which the cost of every successive iteration reduces continuously. Longer the algorithm needs to work, lesser the efforts. Our contribution not only accelerates the conventional K-means but also enhances its scalability. Being a generalized version of the Poteras et al’s work in this direction, the results of the proposal when compared with those of Poteras et al’s work are significantly improved.
References Accelerated K-means Clustering Algorithm
- E.W.Forgy, “Cluster analysis of multivariate data: efficiency v/s interpretability of classifications”, Biometrics, 21, pp.768–769, 1965
- Nameirakpam Dhanachandra, Khumanthem Manglem and Yambem Jina Chanu, “Image Segmentation using K -means Clustering Algorithm and Subtractive Clustering Algorithm”, Proceedings of the Eleventh International Multi-Conference on Information Processing-2015 (IMCIP-2015), Procedia Computer Science 54, pp. 764 – 771, 2015.
- Ramzi A. Haraty, Mohamad Dimishkieh and Mehedi Masud, “An Enhanced k-Means Clustering Algorithm for Pattern Discovery in Healthcare Data”, International Journal of Distributed Sensor Networks, Volume 2015, pp. 1-11, 2015.
- M. Bala Krishna and M. N. Doja, “Deterministic K-means secure coverage clustering with periodic authentication for wireless sensor networks”, International Journal of Communication Systems, 2015. DOI: 10.1002/dac.3024.
- Suneetha Chittineni, Raveendra Babu Bhogapathi, “Determining Contribution of Features in Clustering Multidimensional Data Using Neural Network”, International Journal of Information Technology and Computer Science(IJITCS), Vol. 4, No. 10, pp.29-36, 2012.
- Joao Caldas da Costa, “K-means Clustering for Sleep Spindles Classification”, International Journal of Information Technology & Computer Science ( IJITCS ), Volume 10 : Issue No : 3, Proceedings of the 2nd International Conference on Computer Science, Information System & Communication Technologies ( ICCSISCT 2013 )- Sydney , Australia, pp. 77-85, 2013.
- Shehroz. S. Khan and Amir Ahmad “Cluster center initialization algorithm for kmeans clustering” Pattern Recognition Letters. 25 (11), Pages 1293–1302, 2004.
- D. Arthur and S. Vassilvitskii, “k-means++: The Advantages of Careful Seeding”, Society for Industrial and Applied Mathematics , Philadelphia, 2007.
- T. Su and J. G. Dy, “In Search of Deterministic Methods for Initializing K-Means and Gaussian Mixture Clustering,” Intelligent Data Analysis, vol. 11, no. 4, pp. 319–338,2007
- M. Emre Celebi and Hassan A. Kingravi, “Deterministic Initialization of the K-Means Algorithm using Hierarchical Clustering” International Journal of Pattern Recognition and Artificial Intelligence, 26(7):1250018, 2012.
- Abdessalam H. Elhabbash, “Enhanced k-means Clustering Algorithm”, Masters Diss., The Islamic University of Gaza, 2010.
- A. M. Fahim, A. M. Salem, F. A. Torkey and M. A. Ramadan, “An Efficient Enhanced K-means Clustering Algorithm”, Journal of Zhejiang University, Science A , 7(10), pages 1626 - 1633, 2006.
- S. Tiwari and T. Solanki, “An Optimized Approach for k-means Clustering” IJCA Proc.9th International ICST Conf on Heterogeneous Networking for Quality, Reliability, Security and Robustness (QShine-2013), pp:5-7, December 2013.
- C. Elkan, “Using the triangle inequality to accelerate k-means”, Proc. Twentieth International Conference On Machine Learning (ICML), pp 147–153, 2003.
- G. Hamerly, “Making k-means even faster”, Proc. SIAM Int. Conf. on Data Mining, 2010
- J. Drake, G. Hamerly, “Accelerated k-means with adaptive distance bounds”, 5th NIPS Workshop on Optimization for Machine Learning, 2012.
- S. J. Phillips, “Acceleration of k-means and related clustering algorithms”, Mount D, Stein C (eds), Algorithm engineering and experiments. Lecture notes in computer science, vol 2409. Springer, Berlin, Heidelberg, pp 61–62, 2002.
- G. Hamerly and J. Drake, “Accelerating Lloyd’s Algorithm for k-Means Clustering”, Partitional Clustering Algorithms, Springer, pp 41-78, 2014.
- C. M. Poteras , M. C. Mihaescu and M. Mocanu, “An Optimized Version of the K-Means Clustering Algorithm” Proc. 2014 Federated Conf. on Computer Science and Information Systems, pp. 695–699 , DOI: 10.15439/2014F258, 2014.
- UCI Machine Learning Repository, http://ics.uci.edu/ mlearn/MLRepository.html
