Acoustic Signal Classification from Monaural Recordings

Author: Rupali Shete
Journal: International Journal of Intelligent Systems and Applications(IJISA) @ijisa
Article in issue: 3 vol.6, 2014.
Free access
Acoustic domain contains signals related to sound. Speech and music though are included in this domain, both the signals differ with various features. Features used for speech separation does not provide sufficient cue for music separation. This paper covers musical sound separation for monaural recordings. A system is proposed to classify singing voice and music from monaural recordings. For classification, time and frequency domain features along with Mel Frequency Cepstral Coefficients (MFCC) applied to input signal. Information carried by these signals permit to establish results Quantitative experimental results shows that the system performs the separation task successfully in monaural environment.
Speech/Music Signals, Speech/Music Classification Model, Segmentation
Short address: https://sciup.org/15010538
IDR: 15010538
Text of the scientific article Acoustic Signal Classification from Monaural Recordings
Published Online February 2014 in MECS
Human auditory system has a remarkable capability in separating sounds originating from different sources. One important aspect of this capability is hearing out singing voice (also called vocal line) accompanied by musical instruments. Although this task seems effortless to humans, it turns out to be difficult for machines. Compared to speech, musical sounds have a wider range of spectral and temporal variations due to different production mechanisms of instruments. This requires a separation system to be more robust. A musical sound is almost always accompanied by some other sounds. Concurrent musical sounds also tend to have harmonic relationships in pitch. This tendency increases the likelihood of sound sources overlapping in the time-frequency domain and creates some unique problems for musical sound separation. One such problem is overlapping harmonics. In co-channel speech, harmonics from different speakers rarely have similar frequencies. However, in music, the collision of harmonics from different instruments in the frequency domain is common. As a result, separating musical sounds could be more difficult.
In the present contribution, we propose a model for speech/music classification from monaural recordings based on Hu, Wang system [1]. The paper is organized as: Section II covers related work with emerging approaches towards the problem definition and related terms such as speech and music generation, their properties, representations etc. The proposed system and most commonly used set of features for speech/music discrimination are presented in Section III. Section IV contains an analysis of the feature’s discrimination ability with evaluation and results. Conclusions and findings are stated in Section V.
-
II. Related Work
-
2.1 Speech/Music Properties
-
2.2 Voiced, Unvoiced Sounds
Among numerous separation systems that have been developed, a few of them [2, 3] utilize source-specific prior knowledge for separation. Although all sound separation systems require some level of prior knowledge to make the separation problem solvable when the number of mixtures is less than the number of sources [4], these systems rely on prior knowledge that completely characterize sources to be separated. For example, [2] uses Gaussian scaled mixtures to capture all possible variations of each audio source. However, since instrument sounds can vary to a great extent, it is highly unlikely that these can be fully characterized, either in a parametric or non-parametric form. As a result, most musical sound separation systems try to avoid the use of source-specific prior knowledge. Such systems are either based on traditional signal processing techniques (mainly sinusoidal modeling), statistical techniques (such as independent subspace analysis, sparse coding, and non negative matrix factorization), or psychoacoustic studies (computational auditory scene analysis). Sinusoidal modeling treats sound as a linear combination of sinusoids with time-varying frequencies, amplitudes, and phases [5]. Consequently, the task of sound separation advances by estimating these parameters for each sound source [6, 7, 8]. Sinusoidal models provide a particularly compact representation for harmonic sources. As a result, sinusoidal modeling has often been used for separating harmonic sounds, especially when the pitch contours of each sound source are known priorior can be estimated accurately. Statistical techniques to musical sound separation generally assume certain statistical properties of sound sources. Independent subspace analysis (ISA) [9, 10] extends independent component analysis, which assumes statistical independence among sources, to single-channel source separation. Sparse coding assumes that a source is a weighted sum of bases from an over complete set. The weights are assumed to be zero with high probability, i.e., most of the bases are inactive most of the time [11]. Non negative matrix factorization (NMF) [12] attempts to find a mixing matrix and a source matrix with non-negative elements, such that the reconstruction error is minimized. It implicitly requires the mixing weights to be sparse. These techniques have a common mathematical foundation but different constraints [7]. They all aim at recovering components, the linear combination of which approximates the observation. However, it is not trivial to determine which components are from the same source. As a result, an additional spectral clustering step is usually required for these techniques.
Speech is produced by the airflows from the lungs through the vocal folds and moves the larynx tube and vocal cords. Everyone have unique sound according to organelle physical dimensions. Using our human ear, we can distinguish between two speakers talking simultaneously and may recognize them. Speech signals can be characterized by rapid rate of change of speech sounds. In other way, it can be considered as a noise like signal containing consonants [6, 13, 14-18]. As per [19], the speech signal can be filter as a continuous random signal. Usually, 95% of the speech power is concentrated in frequencies below 4 kHz, and then it falls very fast through low-frequency values, and any components higher than 8 kHz. Music is an art whose medium is sound, which comprises of different tones. An important class of music is singing. Acoustically speech and music are similar. Both use sound and are analyzed by the same organs. Music spectrum has twice the bandwidth of speech spectrum. In general, most of the signal power in audio waveform (speech or music) is concentrated at lower frequencies Music specifications depend on the kind of played musical instruments and its physical dimensions.
Overlap in speech and music signals are, in general, very strong such that there is no ordinary filter that can separate them from each other. Speech covers the spectrum from near zero to 3.5 kHz with an average dominant frequency of 1.8747 kHz. However, from the classical theorem of music, the lowest fundamental frequency (A1) is about 27.5 Hz and the highest tone C8 is around the frequency of 4186 Hz. Therefore, a musical instrument manufacture tries to bound music frequency to the human’s sound limits to achieve strong consonant and also strong frequency overlap. Moreover, music propagates over all the audible spectrum and covers more than audible band (20 kHz), with an average dominant frequency of 1.9271 kHz. Speech signals are slowly time varying and short time spectrum signals. Based on signal excitation, human speech signals are of two types of signal; Voiced and Unvoiced.
The difference between the two signals is the use of the vocal cords and vocal tract (mouth and lips). When voiced sounds are pronounced from the vocal cords and the vocal tract. Because of the vocal cords, it is possible to find the fundamental frequency of the speech. In contrast to this, the vocal cords are not used when pronouncing unvoiced sounds. Because the vocal cords are not used, is it not possible to find a fundamental frequency in unvoiced speech. In general, all vowels are voiced sounds. Examples of unvoiced sounds are /sh/ /s/ and /p/.
-
III. Speech/Music Classification Model
-
3.1 Audio Segmentation Flowchart
-
3.2 Feature Calculation
The block scheme of the defined speech/music separation is shown in Fig. 1.The input audio signal is mixture of singing voice and instrument voice. This signal is sampled at 16 KHz with a 16 bit resolution. Hamming window is used for windowing, with a length of 512 samples. Window shift is 10 milliseconds (160 samples). Over each window 512-order discrete Fourier transformation is applied followed by feature calculation. The main idea for the feature construction is that energy in a narrow frequency sub-band varies more rapidly, and to a greater extent for speech than for music. The energy variance in such a sub-band is, therefore, greater for speech than for music.
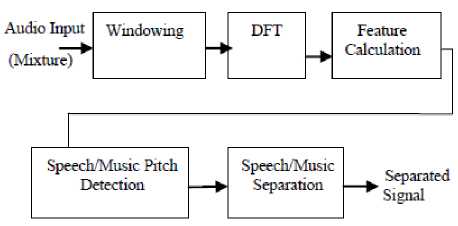
Fig. 1: Block Diagram of Speech/Music Classification System
Fig.2 depicts the flowchart for classification stage of input signal. Input signal once recorded in monaural environment will be provided further for feature calculation.
To partition the input into vocal and non vocal links this stage plays main role. Different features have been explored for singing voice detection. These features include Mel-Frequency Cepstrum Coefficients (MFCC), Linear Prediction Coefficients (LPC) [21, 22], Perceptual Linear Prediction Coefficients (PLP) [23], and the 4-Hz harmonic coefficient. MFCC, LPC and PLP are also widely used for general sound classification tasks and they are the so-called short-term features because they are calculated in short-time windows.
As our system contains voice and instrumental signals, we have used the MFCC feature which gives the best results for speech detection. As only MFCC does not suffice for the music or instrument signal we have calculated six more features for each sampled signal. These features include ZCR, energy entropy, spectral energy, spectral roll off, spectral centroid and spectral flux. Following section describes these features.
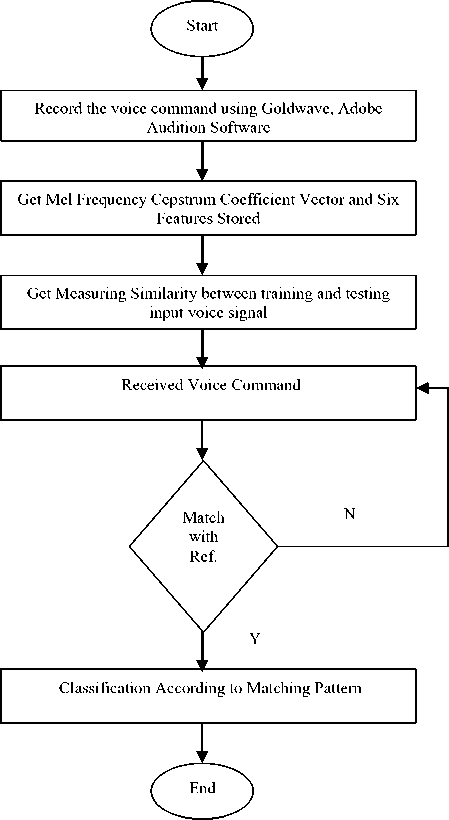
Fig. 2: Audio Segmentation Flowchart
Where, N is the number of samples in one window, x(n) represents the samples of the input window, and sgn[x(n)] is ±1 as x(n) is positive or negative, respectively. ZCR is a strong measure for discerning fricatives from voiced speech. The sampling rate of a signal should be high enough to detect any crossing through zero. It is also very important that the signal is normalized, so that the amplitude average of the signal is equal to zero [25]. The ZCR of music is usually higher than that of speech; because ZCR is proportional to the dominant frequency (music has higher average dominant frequency) [26].
-
(ii) Energy Entropy provides good results for discrimination of speech and music signals. Spectral representations of speech and music can be different despite the fact that there is a human voice present in both cases. If we divide the signal’s spectrum into several sub-bands, narrow enough to catch the variation of pitch and higher harmonics, we can expect the energy of an individual sub-band to go through more drastic and rapid changes during speech than music.
-
(iii) Spectral roll-off (SR) is the measure of skewness of the signal’s frequency spectrum. It is the value of the frequency under which usually 95% of the signal’s power resides. It is a good measure for distinguishing between voiced and unvoiced speech. It is expected that speech has a lower value of spectral roll-off, because it has most of the energy in the lower part of the frequency spectrum. The mathematical expression is as per equation [2].
RM
∑ X ( k ) = 0.95 ∑ X ( k ) [2] k - 1 k - 1
Where, k is the frequency bin index, M is the total number of frequency bins, X(k) is the amplitude of the corresponding frequency bin, and R is the spectral rolloff number.
-
(iv) Spectral Centroid (SC) is defined as the centre of a signal’s spectrum power distribution. Like spectral roll off, spectral centroid is also a measure of spectral shape.
Music signals have high spectral centroid values because of the high frequency noise and percussive sounds. On the other hand, speech signals have a narrower range, where pitch stays at fairly low values. It has different values for voiced and unvoiced speech, and can be calculated as per equation [3]
∑ k M - 1 k . X ( k ) ∑ kM - 1 X ( k )
N - 1
ZCR = 21 N ∑ |sgn[ x ( n - 1)]| [1]
n = 1
Higher values mean “brighter” sound with higher frequencies.
-
(v) Spectral Energy captures the sub band energy distribution which is indicative for specific types of sound signals. The sum of subband energy distribution is the total energy of signal.
-
(vi) Spectral Flux is a measure which characterizes the change in the shape of the signal’s spectrum [27]. The rate of change in spectral shape is higher for music, and therefore, this value is higher for music than for speech. Spectral flux can be calculated as the ordinary Euclidean norm of the delta spectrum magnitude as per equation [4].
-
3.3 Speech/Music Segmentation
M
SF = T7A Z(Xi(k)-Xi —1(k)) M\7=1
After the feature calculation step, feature classification i.e. pitch detection algorithm which is extended from the one by Wu et al. [20], and speech/music separation procedures are performed. Pitch detection algorithm performs pitch tracking by Euclidian distance, which finds most likely sequence of pitch hypotheses. If a pitch hypothesis in the optimal sequence contains two pitches, the first pitch is considered as the pitch of singing voice. This is because; the first pitch is the dominant one in our formulation. After the classification procedure, frames are grouped into segments according to the classification tag (whether a frame was classified as a speech frame or as a music frame). The classification result is smoothed out using mean filter, which filters out any glitches during the classification step. The segments are created according to the minimum speech and music segments’ duration rules. After the feature calculation step, feature classifications i.e. pitch detection and speech/music separation procedures are performed. The result of separation and classification is written into the output file (wav). The output separation file is used later during the evaluation process.
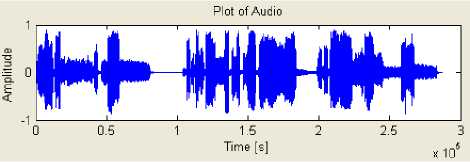
frame level accuracy is defined as a percentage of high low mixture of dominant instrument and speech signals. An example of .wav file is shown in Fig.3.
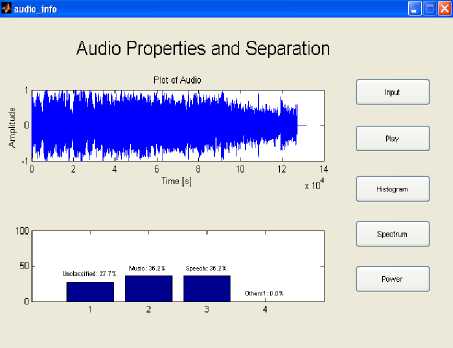
Fig. 3: Audio spectrum and classification of frame
-
4.2 Results
IV. Evaluation and Results4.1 Evaluation
In this work, the percentage of frame-level accuracy is a measure for the evaluation metric. For this the six features afore mentioned along with MFCC are used and the values are decided on the basis of mean, median, max and standard deviation of these features. With this reference, four different frame-level accuracies are calculated as: speech, music, unclassified and others. Speech frame-level accuracy is defined as a percentage of the true speech frames classified as speech, the music frame-level accuracy is defined as a percentage of the true music frames classified as music, unclassified frame level defined as the mixture of speech and music with no dominant frequency to recognize and the other
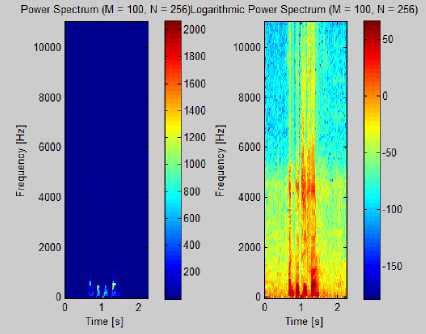
Fig: 5: Power Spectrum of music signal
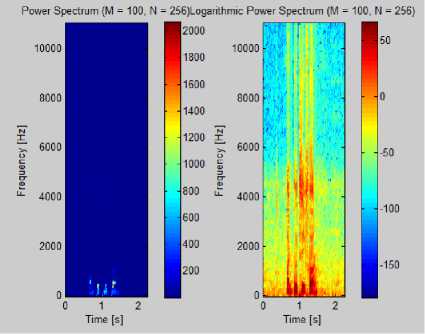
Fig: 4: Power Spectrum of Speech Signal
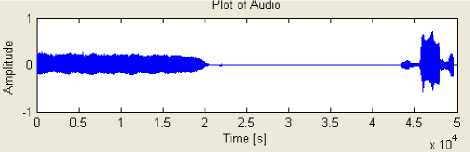
Fig.6. depicts results of wav file before and after classification. Fig. [6-a] shows a waveform of the input wav file which is chosen from database. The file contains not only speech but music and noisy data also. From this original wav file the only speech signals are identified and the wav file after classification is as shown in Fig. [6-b]. Similarly the classified part as a music and mixture which could not be classified further is mentioned as unclassified is shown in Fig. [6-c] and Fig[6-d] respectively.
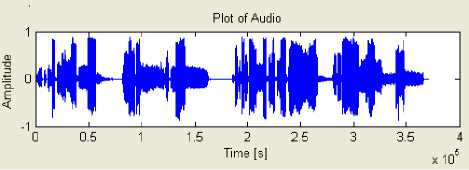
(a) Original wav file
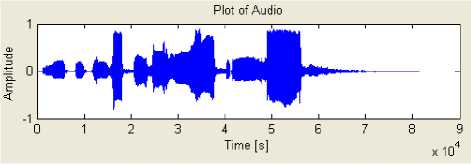
(b) Speech Signal
(c) Music Signal
(d) Unclassified
Fig. 6: Results of Audio wav file [a-d]
(a) Original input wav file before separation
(b) wav file after classification as speech
(c) wav file after classification as music
(d) wav file after classification as unclassified
-
4.3 Test Analysis and Graphical representation
A singing voice database of total 250 files has been prepared. To test the experiment performance three different databases are used i.e. speech, music and mixed signals of 8 K, 16 K, 24 K and 44 K respectively. The algorithm is capable of differentiating the speech music and mixed signals. Table 1 represents few of the sample file features and comparison graph shows the performance of various features for sample test database.
Table 1: Observed Features of Input Signal
|
File Name |
Energy Entropy |
ZCR |
Spectral Energy |
Spectral Roll off |
Spectral Centroid |
Spectral Flux |
|
Neeti Speech |
0.597 |
0.1198 |
0.0062 |
0.0648 |
21.1565 |
0.5011 |
|
Pr Song |
1.0557 |
0.1097 |
0.0023 |
0.0192 |
14.4074 |
1.4628 |
|
Audio |
0.4078 |
0.035 |
0.0029 |
0.0099 |
9.5496 |
0.2936 |
|
Song |
0.4163 |
0.1658 |
0.0015 |
0.0556 |
18.6105 |
1.3228 |
|
So Hello |
1.0155 |
0.0559 |
0.0024 |
0.0341 |
11.8848 |
8.3267 |
|
Are Song |
0.0614 |
0.0912 |
0.0014 |
0.0289 |
28.3186 |
0.1732 |
|
Dil Mix |
0.0293 |
0.3163 |
0.0012 |
0.0148 |
11.0084 |
0.3746 |
|
Sathiya |
0.0293 |
0.3163 |
0.0016 |
0.0222 |
12.987 |
0.4104 |
Fig 7. shows the observation of features Energy Entropy and ZCR. Fig.7 indicates energy of the few samples files more as compared to ZCR. Whereas in Fig 8 all the feature values are included and it shows significant change for spectral flux and energy entropy feature wherein ZCR feature is almost lying to the horizontal axis.
sampling frequencies. From the training database each file’s average time is calculated .Files are sampled with various sampling rate parameters such as 8, 16, 24, and 48K respectively, and the time required right from input of the wav file till the output classification is calculated which is again reflected in Fig 9. As the sampling rate goes on increasing the time taken to get output will be more.
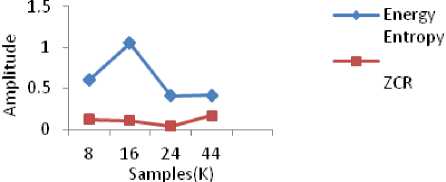
Fig. 7: Energy Entropy and ZCR observation
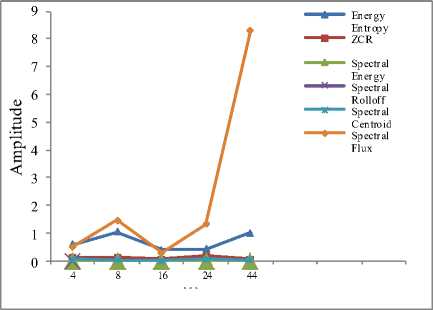
Fig. 8: Input Signal analysis for six features
-
V. Conclusion
As mentioned in section II, few systems have been proposed for singing voice separation from music. This paper represents the general framework for singing voice separation and the system implemented is also extensible. Currently, we used pitch and another six features (Energy entropy, ZCR, Spectral energy, Spectral rolloff, Spectral centroid) as the organizational cue. Other ASA cues, such as onset/offset and common frequency modulation, can also be incorporated into our system, which would be able to separate not only voiced singing but also unvoiced singing. Our classification stage is based on MFCC features and pitch detection system uses an auditory front-end for frequency decomposition and an autocorrelation function for pitch detection. As a result, the observed accuracy of the system is 93%. Most types of singing, such as in pop, country music, have a smaller pitch range and therefore this system can potentially be applied to a wide range of problems. The principle can be further applied for applications such as automatic lyrics recognition and alignment, singer identification, and music information retrieval.
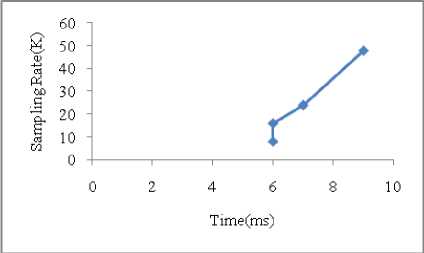
Fig. 9: Time vs. Sampling Rate
Table 2: Average Time Complexity
|
Sampling Rate (K) |
Time(ms) |
|
8 |
6 |
|
16 |
6 |
|
24 |
7 |
|
48 |
9 |
Table [2] shows the average time required for input wav signals to produce the result according to different
Acknowledgments
The authors would like to thank the anonymous reviewers for their careful reading of this paper and for their helpful comments. Also the authors are thankful to Dr.S.H.Gawande as without his guidance this work would have not been published.
References Acoustic Signal Classification from Monaural Recordings
- Yipeng Li, DeLiang Wang. Separation of Singing Voice from Music Accompaniment for Monaural recordings. IEEE Transactions on Audio, Speech, and Language Processing. v15, n4, May, 2007, pp.1475- 1487.
- Benaroya, L. Bimbot F., and Gribonval R. Audio source separation with a single sensor. IEEE Transactions on Audio, Speech, and Language Processing.v14, n1, January, 2006, pp.191-199.
- Ozerov A, Philippe P., Bimbot, F., Gribonval, R. Adaptation of Bayesian models for single-channel source separation and its application to voice/music separation in popular songs. IEEE Transactions on Audio, Speech, and Language Processing.v15, n5, July, 2007, pp.1066-1074.
- Ellis,D.P.W.2006. Model-based scene analysis. In: Wang, D. L., Brown, G. J.(Eds.),Computational Auditory Scene Analysis: Principles, Algorithms, and Applications Wiley/IEEE Press, Hoboken, NJ, pp. 115-146.
- McAulay,R.,Quatieri,T. Speech analysis/synthesis based on a sinusoidal representation. IEEE Transactions on Acoustics, Speech, and Signal Processing.v.34,n4, 1986. pp.744-754.
- Davy, M., Godsill, S.Bayesian harmonic models for musical signal analysis. Seventh Valencia International meeting Bayesian Statistics 2002.
- Virtanen,T. Sound source separation in monaural music signals. Ph.D. thesis, Tampere University of Technology. 2006.
- Every,M. R., Szymanski, J. E. Separation of synchronous pitched notes by spectral filtering of harmonics. IEEE Transactions on Audio, Speech, and Language Processing v14, n1, 2006, pp.91-98.
- Casey,M. A., Westner, W.,Separation of mixed audio sources by independent subspace analysis. International Computer Music Conference, 2000.
- Brown,G. J., Cooke, M. P. Computational auditory scene analysis, Computer Speech and Language. IEEE Transactions on Neural Networks v8, n2, 1994, pp.297-336.
- Abdallah,S. A. Towards music perception by redundancy reduction and un-supervised learning in probabilistic models. Ph.D. thesis, King's College London, Department of Electronic Engineering 2002.
- Brown,J. C., Smaragdis, P.Independent component analysis for automatic note extraction from musical trills. Journal of the Acoustical Society of America 115, 2004, pp.2295-2306.
- Rabiner,L.and Juang,B.H. Fundamentals of Speech Recognition.Englewood. Cliffs, NJ:Prentice-Hall,1993.
- Ainsworth,W. A. Speech Recognition by Machine London : Peter Peregrinus Ltd., 1988.
- Muthusamy, Y.K., Barnard, E. and Cole, R.A. Reviewing Automatic Language identification. IEEE Signal Processing Magazine,v11, n4, October, 1994, pp 33-41.
- Ladefoged, P. Elements of Acoustic Phonetics. Chicago IL, USA: University of Chicago Press, 1st ed, 1962.
- Fry, D. B. The Physics of Speech, Chicago, IL, USA: Cambridge University Press, 1979.
- Simon, J.C. Spoken Language Generation and Understanding. Proceedings of the NATO Advanced Study Institutes Hingham, MA, USA: D. Reidel Publi.Co., 1980.
- Backus, J. The Acoustical Foundations of Music. W.W.Scranton, Pennsylvania, U.S.A.: Norton& Company, 2nded. 1977.
- Wu M., Wang D. L, and Brown G. J, A multipitch tracking algorithm for noisy speech. IEEE Transactions on Speech Audio Process v11, n3, May, 2003, pp. 229–241.
- Berenzweig A. L. and Ellis D. P. W. Locating singing voice segments within music signals. In IEEE Proceedings of the WASPAA,2001, pp.119-122.
- Maddage N. C., Xu C., and Wang Y. A SVM-based classification approach to musical audio. In Proceedings of the ISMIR, 2003.
- Berenzweig A. L., Ellis D. P. W., and Lawrence S. Using voice segments to improve artist classification of music. In Proceedings of AES 22nd International Conference on Virtual, Synthetic and Entertainment Audio, 2002.
- Kotnik B., Vlaj D.,and Horvat B. Efficient noise robust feature extraction algorithms for distributed speech recognition (DSR) systems. International Journal of Speech Technology, v6, n3, 2003, pp.205–219.
- Kedem B. Spectral analysis and discrimination by zero crossings. Proceedings of the IEEE. v74, n11, 1986, pp.1477–1493.
- Bakus J. The Acoustical Foundations of Music. W. W.Norton & Company,Pennsylvania, Pa, USA, 2nd ed.1997.
- Rongqing H. and Hansen J. H. L. Advances in unsupervised audio classification and segmentation for the broadcast news and NGSW corpora, IEEE Transactions on Audio, Speech and Language Processing, v14, n3, 2006, pp. 907–919.
