Adaptation of the healthism attitude scale to turkey: a validity and reliability study

Author: Ura S., Zen G., Aykora E., Yurdakul H.
Journal: Человек. Спорт. Медицина @hsm-susu
Section: Спортивная тренировка
Article in issue: 1 т.21, 2021.
Free access
Aim. The aim of this study is to adapt the Attitude Towards Healthism Scale developed by Alfrey et al. (2019) to Turkish culture. Materials and methods. In order to adapt the Attitude Towards Healthism Scale, 173 male and 124 female university students participated in the study. In the research, after the translation of the scale into Turkish, exploratory factor analysis and confirmatory factor analysis were performed. Results. According to the results of the exploratory factor analysis, it was determined that the total explained variance was 40.462 % and factor loads varied between 0.38 and 0.69. It has been recorded χ2/sd (2.018), GFI (0.932), CFI (0.96), AGFI (0.906), NFI (0.897), IFI (0.941), RMSEA (0.059), according to the results of the confirmatory factor analysis. Conclusion. According to the results of this research, the Attitude Towards Healthism Scale is concluded to be a valid and reliable measurement tool for Turkish culture.
Attitude, healthism, reliability, scale, validity
Short address: https://sciup.org/147233661
IDR: 147233661 | UDC: 796.012.45(560) | DOI: 10.14529/hsm210115
Турецкая адаптация шкалы отношения к здоровью: исследование надежности
Цель. Целью данного исследования является адаптация шкалы отношения к здоровью, разработанной Л. Альфреем и соавторами, к турецкой культуре. Материалы и методы. Для адаптации шкалы отношения к здоровью в исследовании приняли участие 173 студента и 124 студентки университета. После перевода шкалы на турецкий язык был проведен первичный и вторичный факторный анализ полученных данных. Результаты. По результатам первичного факторного анализа было определено, что общая объясненная дисперсия составила 40,462 %, а факторные нагрузки варьировались от 0,38 до 0,69. По результатам вторичного анализа были зарегистрированы следующие статистические значения: χ2 / sd (2,018), GFI (0,932), CFI (0,96), AGFI (0,906), NFI (0,897), IFI (0,941), RMSEA (0,059). Заключение. Согласно результатам исследования, шкала отношения к здоровью признана действенным и надежным инструментом применительно к турецкой культуре.
Text of the scientific article Adaptation of the healthism attitude scale to turkey: a validity and reliability study
Health is the main factor that determines the life span of people and the quality of life within this period. Health is defined not only physically, cognitively and psychologically as a person's well-being. Genetic, environmental and individual factors affect human health. It is very difficult to keep all these factors under control for a healthy life (WHO, 2010). Today, many diseases threatening our health can be treated and the average life expectancy has increased significantly thanks to the developments in technology and medicine compared to the past centuries. The treatment methods and drugs developed in the field of health are very important, but the basic philosophy in health is primarily to protect people from possible health problems and diseases. The first target for healthy generations and a healthy society on the international and national scale has always been to prevent people from developing diseases within the scope of preventive medicine [1, 10].
One of the most practical and effective practices that can be done for a healthy life under the current conditions is to gain healthy living habits to the people in that society. In this context, it is very important to adopt healthy habits as an individual responsibility for people. Social and culturally important activities have been carried out in developed countries for many years in order to create an environment where people will live a healthy life. It is aimed to create awareness in the society about healthy living by organizing activities and campaigns in this direction by public institutions and non-governmental organizations [8]. In this context, the concept of “heal-thism”, namely the culture of being healthy, entered the literature in the early 80s and the media started to take place [9]. The concept of heal-thism, which has entered our language as a culture of being healthy, refers to the individual efforts of people to protect their health in order to live a healthy life as a product of individualization that started with the influence of capitalism. Healthism is basically based on individual measures and responsibilities to protect health based on the idea that many diseases are caused by the behaviors and habits that affect people's health negatively [3, 9].
In recent years, with the political support of the idea of healthism around the world, the frequency of taking part in both scientific studies and media has increased [12, 21]. Although researchers focus on health and fitness, popular culture is focused on healthism [16]. Healthism discourses cause people to practice wrong practices [11, 22]. Accordingly, in the scientific studies conducted in the literature, measurement tools have been developed in order to examine the effects of political and social activities on healthism, people's awareness and attitudes. However, in the local literature, no reliable and valid measurement tool development or adapta tion studies have been performed on healthism.
In this context, the purpose of our research was adapt the Attitude Towards Healthism Scale (ATHS) developed by Alfrey et al. (2019) to Turkish and Turkish culture.
Materials and Methods
In this research, the Turkish adaptation of “The Attitude Towards Healthism Scale (ATHS)” developed by Alfrey, et al. [4]. was performed. Within the scope of the research, it was aimed to ensure the language equivalence of the Attitude Towards Healthism Scale and to test the sub-dimensions. For this purpose, the following steps have been followed in scale adaptation.
Research Group
A total of 297 university students (173 male and 127 female) who are studying at the department of physical education and sport teacher education, coaching education training and sports management in Çanakkale Onsekiz Mart University Faculty of Sport Sciences participated in the study. This study was conducted in the 2019– 2020 academic year. Sports management students constitute the 42.8 % (n = 127) of the study group, whereas physical education students constitute 36.7 % (n = 109) and training education students constitute 20.5 % (n = 61) of the study group. It has been stated in the literature that the number of items can be between 5 and 10 times in determining the number of samples in scale development and adaptation studies [6, 19]. In this respect, it can be said that the number of samples is sufficient to adapt the scale of “The Attitude Towards Healthism”.
Data Collection Tools
The original scale developed by Alfrey, O'Connor, Phillipson, Penney, Jeanes and Phil-lipson, with the aim of determining attitudes towards healthism in 2019, consists of 9 items in “Crisis with individual action” dimension and 6 items in “Judgement” dimension. Alfrey et al [4]. 211 candidates for physical education teachers participated in the study. 17 items were applied to the participants, and 2 items were removed from the scale draft as a result of AFA and CFA. The original language of the scale was developed in English and quadruple likert. Permission was obtained from the responsible author before switching to the Turkish version of the scale. The Attitude Towards Healthism Scale was translated again by 3 independent translators into Turkish and then back to English. It was applied to 30 students of sports sciences to test the semantic suitability. The final form of the scale form was given by taking the feedback from the students and the opinions of the Turkish expert.
Analysis of the Data
Exploratory factor analysis (AFA) and confirmatory factor analysis (CFA) were performed to test the construct validity of the Turkish adaptation study of “The Attitude Towards Healthism Scale (ATHS)”. Factor analysis suitability was checked by Kasier – Meyer – Olkin (KMO) and Bartlett Sphericity tests in AFA. For testing the model, χ2 / sd, GFI, CFI, AGFI, NFI, IFI and RMSEA values were examined. For the reliability of the scale, t test and cronbach alpha value were examined.
Results
In this section of the study, the main components of the study are considered as validity and reliability studies.
Basic Components Analysis
In order to determine the suitability of the data set adapted to Turkish to factor analysis, normality, determination of lost data, discarding extreme values, multiple linearity and Bartlett's sphericity tests were examined. When examining for lost data, it was determined that there was no lost data. For calculating the extreme values, z-scores were examined and for the data sets obtained from the application for normality, the multivariate outliers and univariate outliers numbers were determined. Data, other than +3 to –3 were excluded from the dataset. After 16 questionnaires removed from the data set, the process was continued with 297 data. Variance Inflation Factors (VIF) value was examined to determine whether there is a multicollinearity in the dataset. It has been determined that the VIF value is below 10 and with this result, there is no multiple linearity problem [2].
According to the exploratory factor analysis results, The Attitude Towards Healthism Scale's KMO value was found to be .891, while Bartlett's Sphericity Test result was found to be 1443.379 (p = 0.00). It was determined that the total variance explained was 39.60% and it had a two-factor structure as in the original form of the scale. In factor analysis, if there is a difference of less than 0.1 between the item load value less than 0.3 and the load values given by the items to other factors, those items should be removed [7, 20]. Since the factor load of 1 item was below 0.3 in the study, it was removed from the scale form and the process was continued with 14 items. After Varimax vertical axis rotation, KMO value was found to be significant .897 Bartlett’s Sphericity test was suitable for factor analysis [7]. X² = 1369.110, df = 91, p < .001). According to the results of the analysis, it was determined that
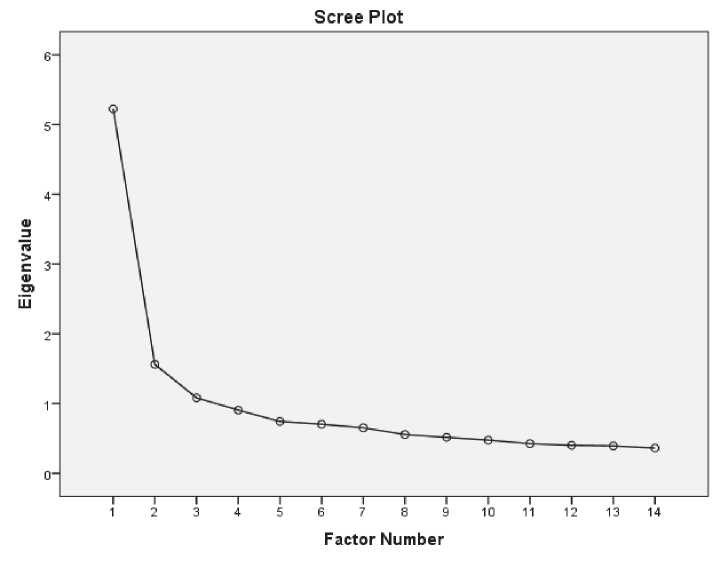
Fig. 1. Scree Pilot Graph
the total explained variance is 40.462%. Factor loads were found to vary between .38 and .69. Adjusted factor loads were found to be between .37 and .73. The Cronbach alpha value of the first dimension, “Crisis with individual action”, was determined as .74, while the value of the “Judgement” dimension was found to be .95. The total cronbach alpha value of the scale was found to be .75. It is stated that the cronbach alpha value above .70 is sufficient. When Fig. 1 is examined, a two-dimensional structure can be seen according to the scree pilot.
When Table 1 is analyzed, it is seen that the dimension of “Crisis with individual action” consists of 8 items and the item factor loads vary between .313 and .661. It was determined that the variance rate explained by this dimension was 33.341 %. The “Judgement” dimension consists of 6 items and the distribution of factor loads in this dimension varies between .488 and .733. While the variance rate announced by “Crisis with individual action” was 7.121 %, the variance rate explained by the “Judgement” dimension was found to be 33.341 %.
Confirmatory Factor Analysis (CFA) was applied to the available data set after the AFA procedure. With this process, the construct validity of the Turkish form of the data set was tested. Path diagram according to DFA results is shown in Fig. 2.
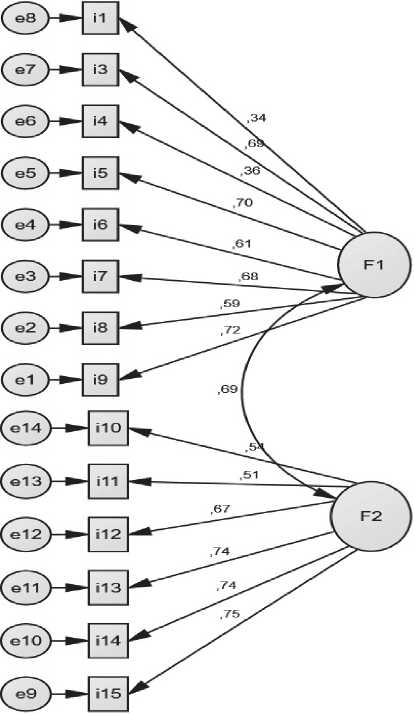
Fig. 2. The Attitude Towards Healthism Scale Path Diagram
(F1: Crisis with individual action F2: Judgement)
Table 1
Exploratory Factor Analysis Results
|
Items |
Dimensions and Factor Loads |
Factor Common Variance |
|
|
Crisis with individual action |
“Judgement” |
||
|
1 |
.370 |
.331 |
|
|
2 |
.608 |
.648 |
|
|
3 |
.313 |
.351 |
|
|
4 |
.661 |
.635 |
|
|
5 |
.612 |
.539 |
|
|
6 |
.612 |
.635 |
|
|
7 |
.572 |
.526 |
|
|
8 |
.632 |
.669 |
|
|
9 |
.494 |
.500 |
|
|
10 |
.488 |
.461 |
|
|
11 |
.733 |
.582 |
|
|
12 |
.628 |
.696 |
|
|
13 |
.691 |
.666 |
|
|
14 |
.678 |
.708 |
|
|
Eigenvalue |
4.661 |
1.004 |
|
|
Explained Variance |
33.341 |
7.121 |
40.462 |
Table 2 shows the values resulting from the confirmatory factor analysis. When Table 2 is examined, it was determined that according to the results of DFA analysis, χ2 / sd (2.018), GFI (0.932), CFI (.96), AGFI (0.906), NFI (0.897), IFI (0.941), RMSEA (0.059). The resulting values show that The Attitude Towards Healthism Scale is compatible with the predicted theoretical structure without the need for modification [5, 13, 15, 17].
Table 2
Confirmatory Factor Analysis Compliance Values
|
Parameters |
Acceptable compliance values |
|
Sd 76 |
|
|
χ2 153.333 |
|
|
χ2 / sd 2.018 |
0 ≤ χ2 / sd ≤ 3 |
|
RMSEA 0.059 |
0 ≤RMSEA≤ 0.08 |
|
GFI 0.932 |
0.90 ≤GFI≤ 1.0 |
|
AGFI 0.906 |
0.85 ≤AGFI≤ 1.0 |
|
CFI 0.941 |
0.95 ≤CFI≤ 1.0 |
|
NFI 0.897 |
0.90 ≤NFI≤ 1.0 |
|
IFI 0.941 |
0.90 ≤IFI≤ 1.0 |
Criterion validity studies
Based on the difference of the averages in the lower-upper group of the items in the scale, the discrimination of the scale was examined. The scores of the students of the sports science faculty that entered the upper 27 % group and the lower 27 % group of the research group were analyzed by t test. When Table 3 is analyzed, it was determined that the difference in points between the upper and lower groups of 27 % is significant. When T values are analyzed, it is seen that it varies between 12.237 and 23.263. According to Kline [15], the values above 2.58 for t value are significant at the level of .01.
Discussion and Conclusions
Today, it is emphasized that women and men appear beautiful and fit in magazines, television and fashion magazines and it is stated that there is a relationship between consumer culture and well-being [18]. Surgical interventions to look better can be shown as an example of how effective healthism is [14]. In this sense, it is important to determine the attitudes of individuals to be healthy and to determine how much they affect human life. In this study, it was aimed to adapt the “Health Culture Attitude Scale” to Turkish culture. For this purpose, after the translation of the original language of the scale from English to Turkish, exploratory and confirmatory factor analyzes were performed on 297 students studying in the faculty of sports sciences.
In order to determine the suitability of the data set for factor analysis, normality, determination of lost data, discarding extreme values, multiple linearity and Bartlett sphericity tests were examined. In addition, Variance Inflation Factors (VIF) value was examined to determine whether there is a multicollinearity in the dataset. Then, exploratory factor analysis was done and it was found that the scale explaining 39.60% of the total variance has a two-factor structure as well as the original form. Since the factor load of 1 item was below 0.3 in the study, it was removed from the scale form and the process was
Table 3
The Comparison of Item’s Means of Upper 27% and Lower 27 % group
Confirmatory Factor Analysis (CFA) was applied to the available data set after the AFA procedure. According to the results of the analysis, it was determined that χ2 / sd (2.018), GFI (0.932), CFI (.96), AGFI (0.906), NFI (0.897), IFI (0.941), RMSEA (0.059). The resulting values show that The Attitude Towards Healthism Scale is compatible with the predicted theoretical structure without the need for modification.
The Aim should not repeat the title of the manuscript. Description of methods should be concise and illustrative of approaches and research methodology. The Results section should also be concise and clear. Please reduce it to essential theoretical and experimental results of the research, newly discovered scientific facts, correlations, and dependencies. Avoid repeating the information from the title in the Abstract. It is not recommended to use excessive parenthetical phrases such as “the paper covers…” The word limit for the Abstract is strictly 190 to 250 words. The Abstract section should be followed by several key words or phrases relevant to the paper subject to help databases create the most accu- rate search results. Keywords should be separated by commas; there is a final period at the end of the list.
As a result of this research, it was concluded that it is a valid and reliable measurement tool that can be used in Turkish culture in determining the attitudes of individuals to be healthy. With this measurement tool, it can be suggested to examine the relationship between individuals' health culture attitudes and many situations such as nutritional habits, nutritional attitudes, physical activity levels and psychological well-being.
References Adaptation of the healthism attitude scale to turkey: a validity and reliability study
- Ali A., Katz D.L. Disease Prevention and Health Promotion: How Integrative Medicine Fits. American Journal of Preventive Medicine, 2015, vol. 49, no. 5, pp. 230-240.
- Alpar R. Spor, Saglik ve Egitim Bilimle-rinden Orneklerle Uygulamali istatistik ve Gegerlik-Guvenirlik. Detay Yayincilik, 2014.
- Atilla G., Buyuker I§ler D.A. Qualitative Pre-Study on Healthism as a Consumer Object. Dumlupinar University Journal of Social Science, 2012, no. 34, pp. 221-230.
- Alfrey L., O'Connor J., Phillipson S. et al. Attitudes of Pre-Service Physical Education Teachers to Healthism: Development and Validation of the Attitude Towards Healthism Scale (ATHS). European Physical Education Review, 2019, vol. 25, no. 2, pp. 424-437. DOI: 10.1177/1356336X17742665
- Brown T.A. Confirmatory Factor Analysis for Applied Research. New Jersey: Guilford Publications, 2006
- Bryman A., Cramer D. Quantitative Data Analysis with SPSS Release 1o for Windows. London: Routledge, 2001. DOI: 10.4324/9780203459621
- Buyukozturk §. Veri Analizi El Kitabi. Ankara: Pegem Akademi, 2016.
- Clarke E.A. What is Preventive Medicine? Canadian Family Physician, 1974, vol. 20, no. 11, pp. 65-68.
- Crawford R. Healthism and the Medicali-zation of Everyday Life. International Journal of Health Services, 1980, vol. 10, no. 3, pp. 365-388. DOI: 10.2190/3H2H-3XJN-3KAY-G9NY
- Eggert R.W., Parkinson M.D. Preventive Medicine and Health System Reform: Improving Physician Education, Training, and Practice. JAMA, 1994, vol. 272, no. 9, pp. 688-693.
- Evans B. 'Be Fit Not Fat': Broadening the Childhood Obesity Debate Beyond Dualisms'. Children's Geographies, 2004, no. 2.2, pp.288-291.
- Greenhalgh T., Wessely S. Health for Me: a Sociocultural Analysis of Healthism in the Middle Classes. British Medical Bulletin, 2004, vol. 69, no. 1, pp. 197-213. DOI: 10.1093/bmb/ldh013
- Hooper D., Coughlan J., Mullen M. Structural Equation Modelling: Guidelines for Determining Model Fit. Electronic Journal of Business Research Methods, 2008, vol. 6, no. 1, pp.53-60.
- Jones M. Makeover Culture's Dark Side: Breasts, Death and Lolo Ferrari. Body & Society, 2008, no. 14, pp. 89-104. DOI: 10.1177/ 1357034X07087532
- Kline R.B. Principle and Practice of Structural Equation Modelling (4 ed.). New York: The Guilford Press, 2016.
- Lee J., Macdonald D. 'Are They Just Checking our Obesity or what?'The Healthism Discourse and Rural Young Women. Sport, Education and Society, 2010, no. 15.2, pp. 203-219. DOI: 10.1080/13573321003683851
- MacCallum R.C., Browne M.W., Suga-wara H.M. Power Analysis and Determination of Sample Size for Covariance Structure Modeling. Psychological Methods, 1996, vol. 1 (2), pp. 130-149. DOI: 10.1037/1082-989X.1.2.130
- Rysst M. "Healthism" and Looking Good: Body Ideals and Body Practices in Norway. Scandinavian Journal of Public Health, 2010, vol. 38 (5 suppl.), pp. 71-80.
- Wolf E.J., Harrington K.M., Clark S.L., Miller M.W. Sample Size Requirements for Structural Equation Models: An Evaluation of Power, Bias, and Solution Propriety. National Institutes of Health, 2013, vol. 76, no. 6, pp. 913-934. DOI: 10.1177/0013164413495237
- Stevens J.P. Applied Multivariate Statistics for The Social Sciences (Fourth Edition). New Jersey: Lawrance Erlbaum Association, 2002.
- Turrini M. A Genealogy of "Healthism". Ea - Journal of Medical Humanities & Social Studies of Science and Technology, 2015, vol. 7, no. 1, pp. 11-27.
- Wright J., Burrows L. "Being Healthy": the Discursive Construction of Health in New Zealand Children's Responses to the National Education Monitoring Project. Discourse: Studies in the Cultural Politics of Education, 2004, no. 25.2, pp. 211-230. DOI: 10.1080/ 01596300410001692157
