Adaptive Modeling of Urban Dynamics during Armada Event using CDRs

Author: Suhad Faisal Behadili, Cyrille Bertelle, Loay E. George
Journal: International Journal of Information Technology and Computer Science(IJITCS) @ijitcs
Article in issue: 1 Vol. 9, 2017.
Free access
This study investigates the mobile phone data during ephemeral event (Armada). The statistical techniques have been used for modeling human mobility collectively and individually. The undertaken substantial parameters are: inter-event times, travel distances (displacements), and radius of gyration. They have been analyzed and simulated using computing platform by integrating various applications for huge database management, visualization, analysis, and simulation. Accordingly, the general population pattern law has been extracted. This study has revealed the individuals mobility in dynamic perspective for 615,712 mobile users, also the simulated observed data are classified according to general, work, and off days.
Modeling, urban mobility, radius of gyration, travel distance, CDRs
Short address: https://sciup.org/15012605
IDR: 15012605
Text of the scientific article Adaptive Modeling of Urban Dynamics during Armada Event using CDRs
Published Online January 2017 in MECS DOI: 10.5815/ijitcs.2017.01.01
The Communication devices (mobile networks, social media platforms) have produced digital traces for their users either voluntarily or not. This type of collective data can give powerful indications that are affecting the urban systems design and development [1]. For understanding the collective human behavior of urban city, hence the geo-visualization techniques could be used.
Understanding, modeling, simulating the pedestrian behavior and movements (individuals mobility) among urban points/regions is very challenging effort, since it is very important in rescue situations for many kinds of events, either in the indoor events like evacuation of buildings, stadiums, theaters, ships, aircraft or outdoor ones like public assemblies, open concerts, religious gatherings, community evacuation ...etc., in exigency situations, there are several incidents could be happening, where the overcrowding causes injuries and death cases, which could be emerged during emergency situations. The advantages of studying people mobility are to put the plans for emergency events prior to their existence, verify and estimate the evacuation strategies by simulating the event and evaluating its rescue efficiency, control and manage the crowd movements to avoid the potential problems, to support and interconnect multi scientific fields (traffic engineering, architecture, socio-psychology, safety science... etc.), as well as to understand how individuals are evolving inside the city, how they are using city services. Since the city planners have to face to the development of cities and to be sure that the services like transportation are efficient and are able to reply to the citizen necessity [2].
Additionally, this kind of studies has to be highlighted to find more modeling improvements, in order to have more realistic simulation results with flexible skills, hence this will give precise and accurate vision to each studied system [3].
The simulation models of human mobility are classified according to their space representation, which could be continuous, grid based or network structure. Also, could be verified according to their intent like specific or general, or the level of abstraction as macroscopic, mesoscopic, and microscopic [3]. Ref. [4] focused on the individuals supporting during emergency conditions, they used macroscopic level models. Thereafter, the computer improvements give strong push to this field, so the level of research is developed to be more efficient via the concept of modeling in microscopic level.
The Multi agent models are very suggestive simulations for spatio-temporal dynamics, since they are elaborating the relationships between micro-level individual actions and emergent macro-level phenomena. Ref. [5] accomplished multi-agent system framework, which model emergent human social behaviors (competitive, queuing, and herding) at the microscopic level, these models build artificial environment composed of agents, which have the ability to interact in intelligence and adaptability with each other [6]. In these models the agents are acting based on some strategies.
The agents are an atomic unit in the computer program and it is goal-directed. However, their interactions are based on predetermined mobility conditions like leader, follower, and inhibition agents. This kind of simulation is very effective for large scale rescue scenario and complex systems, and modeling crowd behaviors.
The agent-based modeling gives a very important facility, which is the high variety of representation, since the agent can represent any kind of structures either individual agent or aggregated once in the reference system, also provides the ability to coordinate that with the spatio-temporal (spatial/time) scales at any level of abstraction the modeler wants, according to the targets of the reference system modeling or the reference system concepts to be shown. This ability is very useful, especially when respecting the changes that could be appear during the simulation process, like new events or structures, agents emergence as in pheromone trail built by ant, and the social clusters evolution for any population.
The paper is organized as follows: Section I presents this introduction. Section II focuses on the observed data and their properties. Section III represents the research approach used to achieve this study, and elaborate the effective used parameters, that are used to simulate the human mobility during the observed event. Section IV describes the conclusions and future suggestions.
-
II. T HE C ASE S TUDY OF CDR S
In the last decades the s cientis ts ’ attention is paid to analyze the social and communication networks. This is accomplished by studying individuals mobility and analyze their life patterns, as well as the transportation surveys to collect long term mobility data, so this could be achieved by sought-after an efficient automatic datasets systems as CDRs Call Detail Records [7, 8]. The CDRs could be considered as georeferenced data for human mobility. Hence, it is no surprise that most of the quantitative data about human mobility have been gathered via CDRs of mobile phone networks [9].
Ref. [10] works on tracing human mobility using mobile phone data, in spite of highly utilization of this data in multi fields, but this research focuses on its usage in planning to transportation system, it has comparing between two data sources the mobile data and odometer reading from safety inspections of vehicles at the same region. It compares mobility features of mobile phone traces with mobility features of odometer readings from annual safety inspections of all private vehicles registered in the Boston Metropolitan Area. CDRs are records that are registered the whole individuals communications history for months, which are predetermined for billing purposes, but the researchers used it as very huge repository to the events (call, sms, and internet connection) of the mobile networks, and the mobility behavior of the network users, the CDRs are records registered in formal secured DB with standard style. Because of their standard format, they are easily extracted and manipulated, but the weakness of them is in the localization information, which is obtained from the mobile user activities only [11].
The investigations that are using CDRs have several problems like the privacy problem, since the information of the mobile network subscribers will be vulnerable, in order to be announced for unauthorized parties, therefore it is anonymized (hidden) to protect the subscribers' privacy. As well as, we the mass size of these data (CDRs), so they need sampling and accurate manipulations preserve their accuracy and avoid any misuse or misunderstanding of their reality, by other hand the graphical or geographical representation of these datasets is difficult, because of the hardware/software limitations that could be encountered during the processing operations. However, the CDRs datasets overcome the acquisition problems (financially/ time consuming), but their projection/ trajectories tracing still time consuming [7].
Generally, there are two data types which are the communication data, and the communication independent data (Itinerancy data). However, the mobile phone datasets are the most powerful media to analyze and discover the human mobility either individually or collectively, since the mobile phone now is the closest buddy to almost people, therefore it makes the phone data are the highly elected tools to uncover and understand the human life patterns, as well as the anomalous events of the investigated data [7].
The spatio-temporal datasets are the acquired CDRs from the mobile phone network, which have a huge size for millions of subscribers and hold many events either anomalous or normal events. The normal events give a good reflection of the daily life for the investigated area like citizens habits and social activities. The anomalous events data are very useful in detecting the disasters or catastrophes immediately (in real time) with spatial and temporal indications, so the evacuation and emergency reactions could be taken as soon as possible according to any alarm indications. All CDRs are reported periodically in seconds; therefore they are very accurate real time data of any mobile user activity.
The human life patterns of urban areas could be extracted by classifying the activities according to different time intervals over the investigated area. This analysis is an attempt to study the human mobility with regard to individuals activities alteration in the observed area along different time intervals, where each mobile event represents an individual activity. However, that does n’t mean absolute indication to pure individual activities, because the individual could be existed in a place out of coverage area, so this probability make him exist actually, but not necessarily appeared in the mobile net data. Nevertheless, the mobile phone activities reflect individuals densities in somehow. In this case study, CDRs don’t give an indication of mobility path. The drift of individuals activities in different places and times had been calculated using simulation platform.
The aim of this study is modeling and simulating individuals mobility during Armada event. The used data in this study are the CDRs generated by the given mobile phone operator (Orange Company in France). Armada is the name of the famous marine festival takes ten days period, it is one of world free spectacle in Rouen (capital city of Upper Normandy in France). This case study is observing the fifth edition of the Armada event during 4th - 15th July 2008. The case study includes 51,958,652 CDRs, which are activities of 288 hours with lack of 15 hours. The observed period includes 5 off days, which are weekends and vacation, and 7 work days. The classical CDRs contain: mobile IDs (alias), towers IDs and positions which are geo-referenced by 2D-coordinates (x, y), the cells on each tower, and the cells IDs, mobile activity types (call in/out, SMS in/out, mobile hand over, abnormal call halt, and normal call end), and the date and time of the mobile phone activity recorded [12].
These data are non-deterministic with discrete nature, so the collective mode would be the effective approach to analyze and simulate them. However, the mobile phone traces are incomplete to describe all individuals mobility, because many individuals travel in the city without making any mobile phone activity. As well as, the mobile phone traces are only captured by the towers, which are located at several locations in the urban city, hence the positions determination would be estimated approximately [13,14].
-
III. M ODELING A PPROACH
This study is an attempt to model and simulate the general pattern law for the collective data, as well as they are investigated in more detail by classifying them into general, work, and off days. The main parameters in this study are the ∆t (inter-event time), ∆r (travel distance), and ^ (radius of gyration). The samples means of the distributions are obtained by an exponential distribution. The computations are performed for the observed data of 12 days, they are manipulated for total individuals (population) in spatio-temporal mode.
-
A. Individuals Activities
The individuals usage of mobile phone are highly varied, ranged between very active users (having many calls/SMSs), and inactive users (having little calls/SMSs), hence sampling them would depend on their activities, which are ranged between rarely-frequently usages [15]. The probability distribution of ∆t has been computed for each consecutive activities of each individual, which are performed sequentially for the observed data of 12 days (each day independently). The probability function is computed to obtain the universal system pattern, it is estimated with regard to consecutive Δt parameter in order to formulate simplified model with its quantitative analysis parameters, the modeled data and simulated responses of the model are performed using one of the well-known functions probability density function (PDF) [15].
The exponential distribution (probability distribution) is capable of modeling the events happened randomly over time. It is used to describe the ∆t [15] of individuals activities with PDF as in equation (1). The cutoff distribution is limited by the maximum observed (Δt=1431minutes ) at which the individual can wait to make any mobile activity.
f ( x | p )= -e^ (1)
The distribution of Δ t is estimated by equation (2) and it is argued in Ref. [16] for total observed period, the long waiting times are characterizes the individuals of less activities [15, 17, 16].
p (Δ t )=(Δ t ) exp (Δ 1 ) (2)
-
B. Individuals Activities in Inter-event times
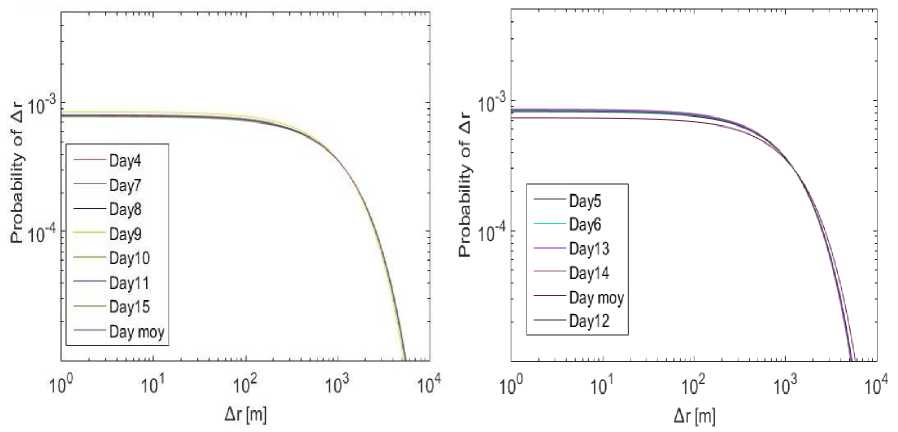
The inter-event times Δt are the activities parameter, which could be estimated to give an indication about human activities relevant to their mobility, in this study the minimum time is 15 minutes, and the maximum time is 1440 (24 hours) regarded as a highest elapsed time to travel within the city. Whereas, the displacements distribution p (Δ r ) have been computed for the total individuals during the observed period. It is argued in Ref. [16], where the displacements distribution is presented. The Δ r is the covered distance between each two consecutive activities during Δ t , where it is in the range 20-1440 minutes , the investigated distance is limited by the maximum distance that could be traveled by individual in Δ t . The cutoff distribution is determined by the maximum observed distance which individual can travel, where it is Δ r =7.23e+04 m along day hours. Note that, the maximum time slice couldn't exceed 24 ℎ ours with regards to the observed area. The p (Δ r ) distributions for different Δt follows truncated power law as in equation (3).
p (Δ r )=(Δ r ) exp (Δ ) (3)
As well as, for deeper insight the distribution is performed for the work days and off days respectively as in Fig.1, where the Δr of the work days are approximately similar, but for the off days the curve of average of them has longer displacements, which reflects that the individuals have a tendency to make long travels during the holidays. The regularity is obvious in all patterns.
Additionally, the gyration radius Tg is estimated, which is an important parameter to characterize the individuals mobility patterns during observed time. It measures how far and how frequent the individual moves during time. So, it enables the individuals sampling according to their relevant rt . The distribution of gyration radius Tg uncovers the population heterogeneity, where individuals traveled within p ( rg ) in long / short distances regularly within rg (t) as formulated in equation (4), which refers to the center of mass of each individual trajectory, as argued in Ref. [18].
(a)
(b)
Fig.1. Displacements distribution P(∆r), the cutoff distribution is determined by the maximum distance traveled by individuals for the inter-eventtimes, each day has its own curve and the curve of days mean is (Daymoy), the patterns are almost identical and the curves are collapsed, a: P(∆r) for work days period, it shows an identical patterns for this period , b: P(∆r) for off days period, it shows longer travel distances Δrs, this period has a variance in patterns.
T9 =√ i ( ; )∑ i=l(→-→ )2 (4)
( )
Where → refers to i=1... 7l" ( t ) positions recorded for individual a, and → = ∑ → , the aggregated
( t )
traveled distances (displacements) are formulated in the P( rg ) distribution, and the obtained power law P( rg ) as in equation (5).
p ( Tg )=( Tg ) exp ( Ta ) (5)
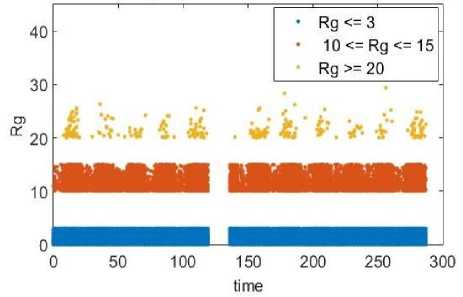
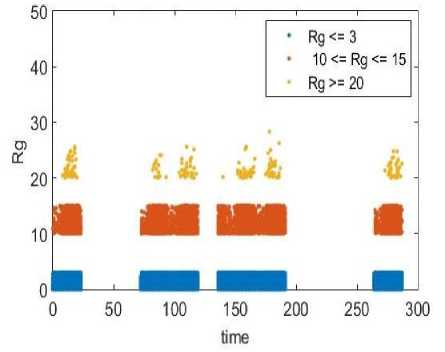
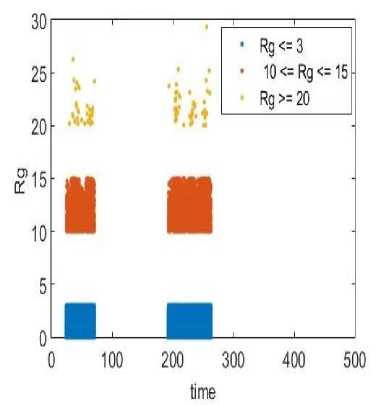
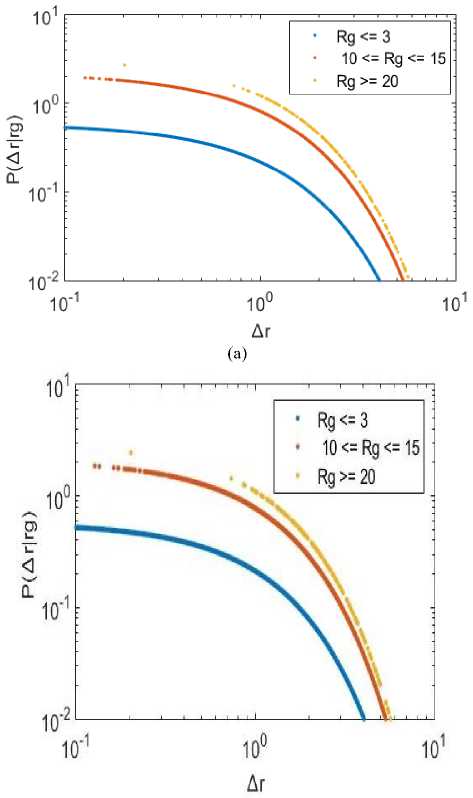
The resulted Tgs are classified into 6 samples of T9s (5, 10, 15, 20, 25, and 30) km, where the individuals are travel within these common rg . The developed algorithm to compute radius of gyration distribution has 0(n2 + 4n) complexity, and it is implemented with Matlab2015 platform. Whereas, the p( rg ) is computed for total population during the observed period in order to classify the ^ evolution along the observed time series, as in Fig.2 which shows the rg variance along time, they are approximately similar in their patterns, also the highest Tg occurrences are the small once ranged (5-15) , while the range (20-30) are the lowest once, which indicates that individuals have the tendency to mobile in small rg and in stable patterns along the general observed period. Then, the rg distributions are computed for the general, work, and off days periods respectively, as shown in Fig. 3 it is clear that rgs could be aggregated in 3 main ranges, which are ranked orderly such as the 10≤Tg ≤15 ,Tg ≤3, and 20≤Tg ≤30. This evolution over time Tg (t) is the same either during the total time series or work/ off time series. Generally, the individuals have high tendency is to travel within 10≤Tg ≤15. The T8s are evolved in same patterns during all verified period classes, also they are stable and ranked orderely as mentioned ealier.
-
C. Trajectories within Radius of Gyration
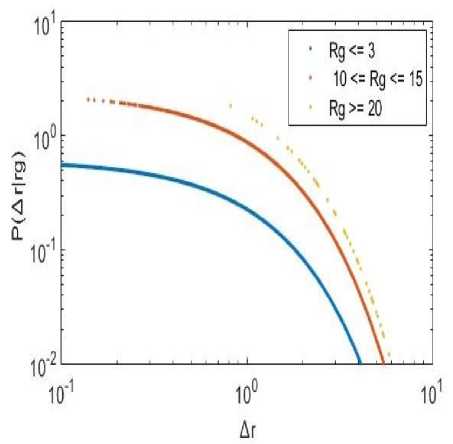
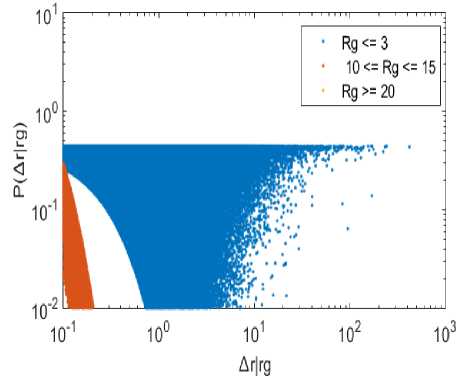
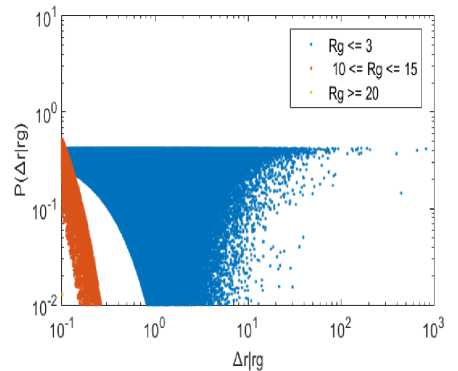
The radius of gyration ( Tg ) is considered to be a more dedicated feature that is capable of characterizing the periodic trajectories of individuals. However, the displacement distributions showed that Δrs of individuals are almost identical, so they are invariant. As well as, the activities distributions are uncovered the similarities of regular patterns during the time evolution of radius of gyration (rg). The experiments revealed the possibility of classifying individuals activities into some patterns samples, and almost individuals have similar activities patterns, but in general they could be varied depending on the days either working or off days. However, the individuals could be sampled into groups according to their relevance to ^(t) , where each group has similar patterns (similar asymptotic). The individuals mobility patterns are considered as the traveled distance Δr within each rc . There is a correlated relationship between Δr and rg . So, the p (Δr| rg ) distribution is presented in function of Δr . It is computed for all individuals during the general, work, and off days period as shown in Fig. 4. It’s clear that individuals of small rt have short Δrs , on the other hand individuals of large Tgs have mix of short and long Δrs . Therefore, it could be said that rg and ΔT are correlated to each other, and they are capable of giving impressive view of individuals mobility patterns. This distribution shows that the individuals are traveling in Δ rs that are bounded by their rg , and the short distances are included within small rg . However, the large rg have heterogeneity property. the mix of short and long Δrs , which give them the
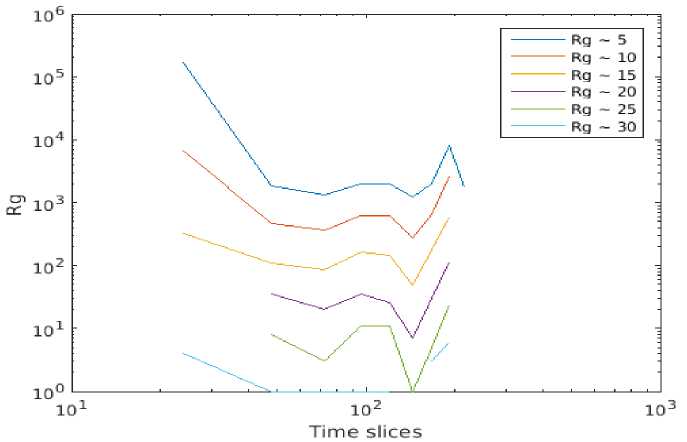
Fig.2. Distribution of gyration radius with loglog versus time series rg ( t ) during general observed period for all individuals, the rg evolution classifies 6 main groups of them, the measuring units for time unit is hours and for rg unit is Km.
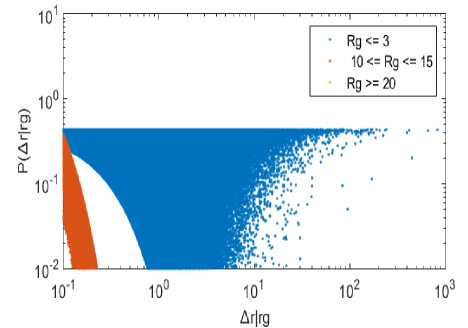
As well as, the PDF of each p (Δ r | Tg ) is verified for each sample for individuals travel within the T9s , as shown in Fig.5, and its probability distribution is modeled by equation (6), the individuals are sampled using PDF, this sampling is achieved according to their bounded rg . It is performed for the general, work, and off days periods. Hence, it is clear that the small rg is the most prevalent pattern for all period classes (general, work, and off) days period. Whereas, in off days period there is some change, where the 10≤ Tg ≤ 15 is increased a little bit, which means the individuals change their regular patterns during off days and vacations. However, the short Δ rs are still the dominant pattern.
p (Δ r | Tg )=(Δ r | Tg ) exp (Δ | rB ) (6)
The significant importance of revealing human trajectories enforces the tendency to build the statistical models. However, the human trajectories have random statistical patterns. In spite of data sources variance (billing system, GSM, and GPS), but the common characteristics are the aggregated Δ rs over Δ t . As well as, the individual trajectory is considered as the microscopic level of mobility abstraction, which is constituted of sequenced coordinates positions along the time, i.e. the individual displacements in spatio-temporal unit. Therefore, the consecutive mobile phone activities are good proxies to estimate human mobility in multi-level of abstraction as macroscopic level, mesoscopic level, or microscopic level [19, 20].
(a)
(b)
(c)
Fig.3. Distribution of gyration radius in function of time series Гд ( t ) for all individuals, the T9s evolution sampled in 3 main groups as in the figure legend, the measuring units for time unit is hours and for Гд unit is Km, a: The Гд ( t ) during general observed period, b:The Гд ( t ) during work days observed period, c: The Гд ( t ) during off days observed period.
(b)
(c)
Fig.4. Radius of gyration distribution р (Δ Г | Гд ) in function of Δr for the individuals travel distances that bounded by their relevant rgs , the small Гд bounded short travel distances Δ rs and the bigger ones have mix of short and long Δ rs , also small and medium Гд are the dominant in the three periods, a: Р (Δ Г | Гд ) during general observed period, b: р (Δ Г | Гд ) during work days observed period, c: Р (Δ Г | TQ ) during off days observed period, .
(a)
(b)
(c)
Fig.5. The PDF of individuals in function of their travel distances within relevant , that classifies the individuals samples, a: PDF of individuals travel distances within relevant during general observed period, b: PDF of individuals travel distances within relevant during work days observed period, c: PDF of individuals travel distances within relevant during off days observed period.
-
IV. C ONCLUSIONS
This research aimed to understand human mobility using the CDRs. This investigation endorsed that the mobile phone activities could act as a feature of grouping the total number of mobile network users, hence each group will have its own feature. As well as, it is concluded that the most common parameters of modeling human mobility are the inter-event time At, travel distance Ar, and radius of gyration rg , which are modeled by the power-law distribution. These parameters can reveal the mobility patterns of the evolved dynamic population along time. This study confirmed that radius of gyration ( ) is the most common quantity, which is associated with human mobility trajectories due to its capability in measuring the how far the mass from the center of mass, i.e. it represents how far and how frequently the individual moves. However, in this study it is founded that is gradually increased at the beginning, but it settles down versus time. It has a key effect on the travel distance (Ar) distributions. Also, the dynamic individuals could be sampled according to their bounded
, and they are travelling within common regular , which characterize the daily life patterns of the urban during the observed period. As well as, the individuals are travelling in many short distances during workdays, but they are travelling in few long distances during off days. However, the mix of long/short travel distance are bounded by their . The traveled distance distributions are collapsed or overlapped for groups. As well as, the activities distributions are uncovered the regular patterns and behaviors similarities during the time evolution of . The experiments analyzed the relationships between the Г and Ar along time, also they showed that all individuals have almost similar patterns, but these patterns in general are classified into two variant types, which are: working days and holiday days.
It is recommended that further research be undertaken in the following areas: Utilize another kind of spatiotemporal analysis techniques to manipulate the big data of CDRs, extract new human mobility parameters to make more detailed description for individuals dynamic behavior, and extend the observed area for the same population.
References Adaptive Modeling of Urban Dynamics during Armada Event using CDRs
- Mohamed Salem, Joachim Schonowski, Axel Küpper, Citizen-centric Smart Cities: M-Technology for realizing Smart Participatory Urban Sensing in E-Government, International Journal of Information Technology and Computer Science ( IJITCS ), Volume No : 12 Issue No : 1, December, 2013.
- Dapeng Li, Thomas J. Cova, Philip E. Dennison, A household-level approach to staging wildfire evacuation warnings using trigger modeling, Computers, Environment and Urban Systems, 2015.
- Yikang Rui, Urban Growth Modeling Based on Land-use Changes and Road Network Expansion, Doctoral Thesis in Geodesy and Geoinformatics with Specialization in Geoinformatics Royal Institute of Technology Stockholm, Sweden, 2013.
- Henderson L., The statistics of crowd fluids, Nature, 229, pp. 381–383, 1971.
- Pan X., Computational modelling of human and social behaviours for emergencyegress analyses, Stanford University: U.K., 2006.
- Héctor A. López-Ospina, Francisco J. Martínez b, Cristián E. Cortés, Microeconomic model of residential location incorporating life cycle and social expectations, Computers, Environment and Urban Systems, 2015.
- Thomas Couronné, Zbigniew Smoreda, Ana-Maria Olteanu, Individual Mobility and Communication Patterns, Analysis of Mobile Phone Datasets and Networks, NETMOB conference, MIT, Cambridge, MA, Oct. 10-11, 2011.
- Markus Schlapfer, Luis M. A. Bettencourt, Sebastian Grauwin, Mathias Raschke, Rob Claxton, Zbigniew Smoreda, Geoffrey B. West, Carlo Ratti, The Scaling of Human Interactions with City Size, Physics, July, 2014.
- John Steenbruggen, Emmanouil Tranos, Peter Nijkamp, Data from Mobile Phone Operators: A tool for Smarter Cities?, Elsevier Volume 39, Issues 3–4, May 2015, Pages 335–346, 2014.
- Francesco Calabrese, Mi Diao, Giusy Di Lorenzo, Joseph Ferreira, Jr. Carlo Ratti, Understanding Individual Mobility Patterns from Urban Sensing Data: A Mobile Phone Trace Example, Elsevier, September, 2012.
- Vatcharaporn Esichaikul and Phyo Thinzar Latt, Multidimensional Data Analysis of Call Records in a Telecommunication Company, International Journal of Information Technology and Computer Science ( IJITCS ), Volume 22 : Issue No : 1, December, 2015.
- Behadili Suhad Faisal, Cyrille Bertelle, Loay Edwar George, Visualization of People Attraction from Mobile Phone Trace Database: A Case study on Armada 2008 in French City of Rouen, Proceedings of the 1st International Engineering Conference On Developments in Civil & Computer Engineering Applications, 2014.
- Lin Sun, Enabling Pervasive Applications by Understanding Individual and Community Behaviors, Université Pierre & Marie Curie -TELECOM SudParis, December, 2012.
- Roberto Trasarti, Ana-Maria Olteanu-Raimond, Mirco Nanni, Thomas Couronne, Barbara Furletti, Fosca Giannotti, Zbigniew Smoreda, Cezary Ziemlicki, Discovering urban and Country Dynamics from Mobile Phone Data with Spatial Correlation Patterns, Telecommunications Policy archive, Volume 39 Issue 3, May 2015, Pages 347-362, 2015.
- Marta C. González, Cesar A. Hidalgo, Albert-Laszlo Barabasi, Understanding individual Human Mobility Patterns, nature 453, 2009.
- Suhad Faisal Behadili, Cyrille Bertelle, Loay E. George, Modelling Dynamic Patterns using Mobile Data, pp. 25–30, Cs & It-Cscp 2016 .
- Ilya Narsky, Frank C. Porter, Statistical Analysis Techniques in Particle Physics, Fits, Density Estimation and Supervised Learning, Wiley-VCH; 1 edition December 23, 2013.
- Suhad Faisal Behadili, Cyrille Bertelle, Loay E. George, Human Trajectories Characteristics, ICUPTCE'16, 2016.
- Christian M. Schneider, Vitaly Belik, Thomas Couronné, Zbigniew Smoreda, Marta C. Gonzalez, Unravelling Daily Human Mobility Motifs, Royal Society, 2013.
- Xiao-Yong Yan, Xiao-Pu Han, Tao Zhou, Bing-Hong Wang, Exact Solution of Gyration Radius of Individual's Trajectory for a Simplified Human Mobility Model, Physics, 2010.
